original
Combining self-organizing maps and hierarchical clustering for protein–ligand interaction analysis in post-fragment molecular orbital calculation

2021 年 21 巻 p. 1-10
詳細
2021 年 21 巻 p. 1-10
Fragment molecular orbital (FMO) calculation is a useful ab initio method for analyzing protein–ligand interactions in the current structure-based drug design. When multiple ligands exist for one receptor, a post-FMO calculation tool is required because of large numbers of interaction energy decomposition terms calculated using this method. In this study, a method that combines self-organizing maps (SOM) and hierarchical clustering analysis (HCA) was proposed to analyze the results of the FMO energy components. This method could effectively compress the high-dimensional energy terms and is expected to be useful to analyze the interaction between protein and ligands. A case study of antitype 2 diabetes mellitus target DPP-IV and its inhibitors was analyzed to verify the feasibility of the proposed method. After performing dimensional compression using SOM and further grouping using HCA, we obtained superclasses of the inhibitors based on the dispersion energy (DI), which showed consistency with structural information, indicating that further analyses of detailed energies per superclass can be an effective approach for obtaining important ligand–protein interactions.
The fragment molecular orbital (FMO) method [1,2] was developed for quantum chemical calculations of macromolecular systems in realistic environments and has recently been used in various fields. This method significantly reduces the computational cost of quantum chemical calculations by dividing the macromolecular systems into small fragments; appropriate fragmentation can yield minimal loss in accuracy compared with the full quantum chemical calculation. Because this approach is a molecular orbital calculation-based method, it can explicitly capture effects, such as polarization and charge–transfer interactions, which cannot be accurately evaluated using classical mechanical methods based on empirical parameters.
In FMO calculations, the molecular orbitals of monomer and dimer fragments and the interfragment interaction energy (IFIE) are calculated [3]. The energy can be further decomposed into electrostatic (ES), exchange repulsion (EX), charge transfer (CT), dispersion (DI), polarization (PL) interactions, and higher-order term using the pair interaction energy decomposition analysis (PIEDA) method [4]. These estimated energies are crucial in the structure-based drug design. In the FMO method, chemical bonds between the α- and carbonyl carbons are split and the intermolecular interaction energies are calculated using split fragments. In protein–ligand complexes, the total value of IFIE and its components between the ligand and protein fragments can be interpreted as the ligand–protein interaction [5]. So far, the sum of IFIE shows good correlations with the experimental indices of binding energies in several studies [6,7]. More recently, FMO calculation results have been collected in a public database; this database is being linked with Protein Data Bank Japan [8] and these results can be used for large-scale investigations [9].
However, the analyses of IFIE and decomposition results using FMO are not simple. For instance, because of many fragment pairs, the obtained values are in a high-dimensional space. If large numbers of ligands are computed to obtain IFIE between the ligands and one target protein, numerous results will be obtained and the analysis of large numbers of interaction energies will be challenging. Hence, a semiautomatic method for classifying ligands and extracting vital interactions of receptor–ligand complexes is required. Until now, various machine learning methods, such as hierarchical cluster analysis (HCA) [10], partial least squares (PLS) [11], and singular value decomposition analysis [12], have been used to analyze high-dimensional IFIE results. More recently, the dimension reduction of IFIE results using self-organizing map (SOM) and multidimensional scaling (MDS) has been reported for analyzing complexes of an estrogen receptor and its inhibitors [13]. These studies achieved good results; however, they used total IFIE values and not energy components obtained using PIEDA. Hence, we attempted to use energy components and machine learning methods for obtaining accurate results.
In this study, a dimension reduction method combining SOM and HCA was proposed for post-FMO calculation analysis, particularly for the energy components calculated using PIDEA. This method is expected to create appropriate ligand groups and facilitate the analysis of protein–ligand interactions. Moreover, to prove the usefulness of our method, the proposed method was employed to study the interaction between well-investigated diabetes target dipeptidyl peptidase-IV (DPP-IV) and its inhibitors.
2.1 Overall
The aim of creating a new method to effectively analyze post-FMO calculation results, particularly the energy decompositions of PIEDA, is the efficient usefulness of FMO and PIEDA in drug designs. PIEDA provides vital information about chemical interactions that may be crucial for inhibitor optimization, de novo drug design, and protein–ligand interaction investigation.
The decomposed components, particularly DIs, which majorly refer to the magnitude and nature of π−π stacking and CH–π interactions, are reflected by the ligand–protein interacting shapes. Therefore, ligands can be classified based on the DI matrices calculated using ligand–protein complexes. Further, the intensive analyses of these derived classes may have biochemical meanings.
In the proposal method, precalculated ligand–protein IFIE obtained using the FMO method and energy components from decompositions of PIEDA must be prepared. Based on energy component matrices, e.g., IFIE-DIs, ligands are clustered using SOM and HCA. The aggregated profile of each SOM grid indicates the importance of specific IFIE-DIs for clustering (Figure 1).

Figure 1. An illustration of the proposed method
2.2 PIEDA
In PIEDA, IFIE is divided into energy components based on the molecular orbitals that can easily acquire a physical meaning. The energy components are divided into ES, EX, CT, PL, DI, and higher-order terms. However, PL and higher-order terms are not considerably large and rarely develop into vital interactions. Therefore, these terms are grouped with CT as CT + mix; however, CT + mix is dominated by CT values. Based on the energy components, we can interpret the existing interaction. For instance, DI usually refers to the π−π stacking or CH–π interaction, ES refers to the electrostatic interaction, and ES + (CT + mix) refers to hydrogen bonding. However, because PIEDA components do not exactly correspond to these chemical interactions, we cannot determine the interaction type using only PIEDA components. Therefore, when investigating the interaction modes, a comprehensive determination based on the molecular structure is required.
In the proposed method, the protein–ligand complexes must be precalculated using the FMO method and the IFIE values should be divided using PIEDA. Because the weak interactions between the ligand and protein fragments can be considered less crucial, a cutoff value of ±3 kcal/mol was set to exclude them. For ease of interpretation, only IFIE-DIs were adopted for SOM. If missing IFIE-DIs exist owing to mutation or missing residues in the protein, these values can be imputed using the mean IFIE-DIs of other complexes. However, if the number of missing values is more than a quarter of the sample size, the imputation can be incorrect. Therefore, in such a case, IFIE-DIs with several missing values should be excluded.
2.3 SOM
SOM is a single-layer neural network with nodes along the n-dimensional grid, usually a two-dimensional grid, and can be considered an unsupervised dimensional compression method. This method projects high-dimensional distributions of input data to lower dimensions while maintaining the similarity relation. The resulting feature map represents a good approximation of the input space, and the placement of nodes is topologically related to the input space. The map density corresponds to the input space density, i.e., if a region of the input space has more data points, it is represented by more nodes. The aggregated profile (property) of SOM grids allows us to select vital features from the input space.
SOM used in the proposed method was principal component initialized. The initial grids were arranged in a rectangular geometry, with the axes on the first and second principal components of PCA. The aspect ratio of the grid numbers was set close to the ratio of the standard deviations of the first and second principal components. Batch training was performed 1000 times (epochs) using the Kohonen’s algorithm. The α value was set to 0.05–0.005, and the Euclidean distance function was defined as the distance measure between data.
2.4 HCA
HCA is the most basic method for clustering a set of dissimilarities between objects. In the algorithm, objects are initially defined as clusters and then most similar clusters are continuously combined using agglomeration methods until one cluster remains. The final results of this method are shown as a dendrogram (tree diagram), and the tree should be cut for classification.
Because SOM does not exhibit a hierarchical structure, SOM results (group average of grids) were used as inputs for HCA. By cutting the dendrogram at 10 kcal/mol, supper classes of ligands can be obtained.
2.5 Packages and implementation
The analysis protocol was implemented under R version 4.0.1. The primary packages used are SOM (kohonen version 3.0.10), PCA (stats version 4.0.1), HCA (stats version 4.0.1), and graphics (ggplot2 version 3.3.1 and viridis version 1.1.1).
3.1 Overall
To achieve a concise view of the proposed method, we applied it to DPP-IV and its inhibitors, which are prominent in the drug development for type 2 diabetes mellitus (T2DM) [14]. As T2DM is a prevalent lifestyle-related disease, drug discovery campaigns have been conducted. Thus, numerous cocrystallographical structures of the complexes of DPP-IV and candidate inhibitors, along with the inhibitory activities, have been reported, thus rendering it suitable for a study case. Here, a flow explaining the use of the proposed method in the post-FMO calculation analysis was presented. Moreover, whether critical interactions can be summarized along with the clustering of ligand structures was confirmed.
3.2 Structures of complexes
In this case study, 34 X-ray cocrystallographic data of the complexes of DPP-IV and its inhibitors were collected (SI A. Table S1). DPP-VI is a serine exopeptidase with a catalytic ligand binding site, including pockets, namely, S2ʹ, S1ʹ, S1, S2, and S2 extend. DPP-IV inhibitors are not a homogenous class of molecules and can be classified into 1–3 based on the binding pockets (Figure 2).

Figure 2. Ligand binding site of DPP-IV
Based on the X-ray crystal structure of DPP-IV in complex with its peptide substrate (PDB ID:2nu8).
3.3 Flow of analyses
Figure 3 shows the flow of the proposed method, including preprocessing.
First, the collected cocrystallographical data of the complexes of DPP-IV and its inhibitors were preprocessed using MOE 2019 [15]. Only one chain remained if multiple chains exist. Water atoms exhibiting a higher B-factor than the average of receptor heavy atoms were removed. Hydrogen atoms were added using the Protonate 3D module, and the hydrogen structure was optimized using the AMBER10:EHT force-field calculations, where the other atoms were fixed.
Second, FMO calculations were performed at the FMO2-MP2/6-31G* level using ABINIT-MP open (version. 1 Rev. 20) [16]. Fragmentation was performed as a single-residue split using automatic fragmentation implemented in ABINIT-MP, in which the ligand was treated as a single fragment. For computational accuracy, the target must be divided into fragments at the bonds between α- and carbonyl carbons; hence, the fragment unit of the carbon and oxygen atoms of the ester bond is shifted by one residue from the residue name, i.e., the amide group at the N-atom side of α-carbon is assigned to the same fragment. Additionally, the PIEDA option was selected to calculate the interacting components of IFIE.
Then, the proposed method was used, and SOM was applied to the IFIE-DI matrix. Although the proposed method is based on IFIE-DI, we also confirmed the results using other energy terms (Figure S1–S3). In this step, the SOM grids were generated and optimized using the hyperparameters mentioned earlier (section 2.3), and the profile of the SOM grids can be obtained. From these profiles, we can determine the vital interactions in clustering ligands. This visualization was easy to confirm.
Finally, the SOM grids were provided as inputs to HCA. The final dendrogram was established, and by cutting the dendrogram at 10 kcal/mol, superclasses were created.

Figure 3. Flowchart of the analyses of DPP-VI and its inhibitors using the proposed method
3.4 Results of analyses
Figure 4 shows the main results of the case study. The FMO calculation and PIEDA decomposition were verified before conducting the analysis using the proposed method. In all the complexes, the convergence of monomers and dimers was obtained, suggesting correct calculations. No IFIE-EX greater than 20 kcal/mol was observed, indicating no strong EX interaction between the inhibitor and protein fragment.
Figure 4a shows the final projections of IFIE-DIs on the SOM grids. When the classes of inhibitors were mapped on the SOM grids, clustering was correctly generated. Although SOM is an unsupervised learning, using IFIE-DIs as inputs can lead to clustering with biochemical meanings. In other words, these SOM clusters of IFIE-DIs can separate inhibitors into different special classes, which is particularly important for comparing multiple inhibitors in the drug design process. When we generated the SOM grids of other PIEDA components, the clustering did not match the inhibitor classes (SI B. Figure S1–S3). As mentioned above (section 2.2), DI is a value obtained from the perturbation term, referring to the π−π stacking or CH–π interaction, and is an attractive force commonly found in the inhibitor–protein interaction. While other terms depend on the electric charges of the inhibitors, these interaction magnitudes can be extreme and unsuitable when the inhibitors are highly charged.
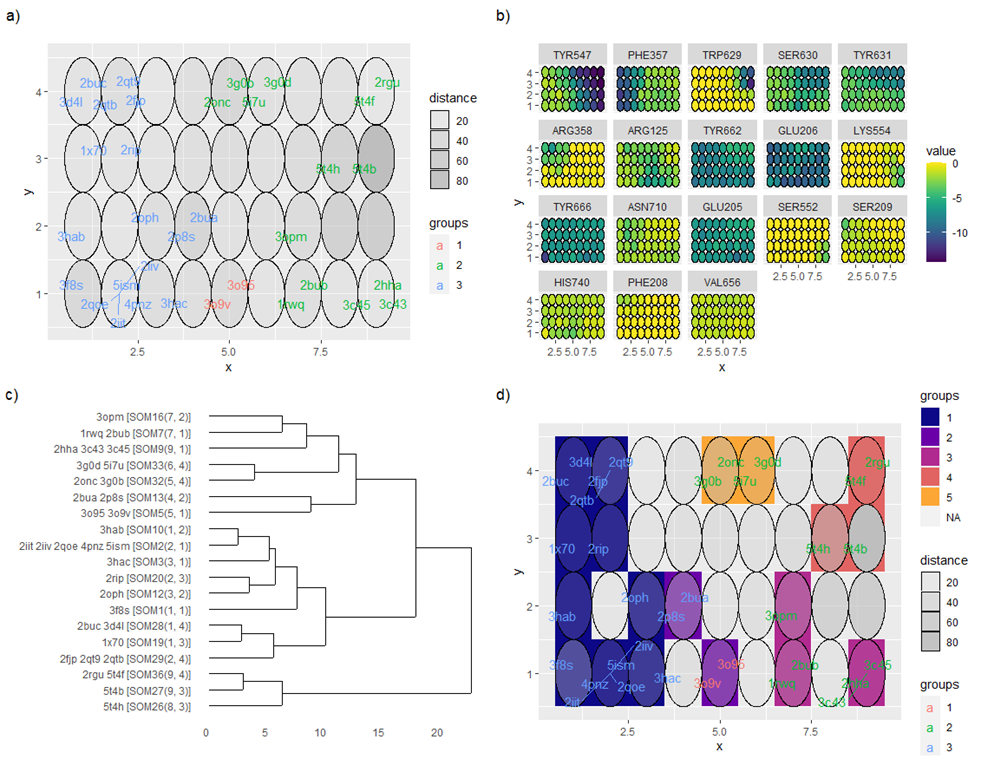
Figure 4. Results of analyses of DPP-IV inhibitors
a) SOM grids. The label, label colors, and distance represent the PDB ID, DPP-IV inhibitor class (red: class 1, green: class 2, blue: class 3), and average distance from the adjacent SOM grid point, respectively. b) Heatmap of SOM grid profile for crucial residues. c) Dendrogram created using HCA. d) Superclass map in SOM grids.
Furthermore, the SOM grid profile was obtained (Figure 4b). This visualization provided information on vital IFIE-DIs for clustering. For instance, strong DIs were detected between the inhibitor and SER630, TYR631, TYR662, GLU206, GLU205, and TYR666, which are fragments in the S1 and S2 pockets. Compared with other classes, large absolute values of IFIE-DIs between the inhibitor and fragment TYR547 were observed on the SOM grids of class 2 inhibitors and those between the inhibitor and fragment PHE357 on the SOM grids of class 3 inhibitors were confirmed. Conversely, in the grid profile of class 1, IFIE-DIs between the inhibitor and fragments TYR547 and PHE357 showed small absolutes. Slight differences can also be observed. For instance, a slightly stronger DI interaction between ligands and TRP629 was found on the SOM grids of class 3, while a slightly weaker DI interaction was observed between ligands and ARG358 on the SOM grids of class 2. These numerical and visualized results can be useful to demonstrate vital protein–inhibitor interactions.
Next, we can confirm the superclasses created by applying HCA to the generated SOM grid. HCA constructed a dendrogram, and by cutting it at 10 kcal/mol, five superclasses were obtained (Figure 4c). By mapping these superclasses to the SOM girds (Figure 4d) and comparing the real ligand classes, superclass 1 consists of class 2 inhibitors, superclass 2 comprises class 1 and 2 inhibitors, and superclasses 3–5 comprise class 3 inhibitors. Based on these results obtained using the proposed method, important fragment combinations for superclasses can be extracted (Table 1, SI C.).
Table 1. Important fragments characterizing the superclasses of DPP-IV inhibitors
| Superclass | TYR547 (S2ʹ) | PHE357 (S2 extend) | TRP629 (S2ʹ) | SER630 (S2ʹ) |
|---|---|---|---|---|
| 1 | 0 | + | 0 | 0 |
| 2 | 0 | 0 | 0 | 0 |
| 3 | + | 0 | 0 | 0 |
| 4 | + | 0 | + | + |
| 5 | + | 0 | 0 | + |
*0 denotes a no/weak interaction; + denotes a strong interaction.
Table 2. Interactions between DPP-IV inhibitors and proteins on a cluster-by-cluster basis obtained using PIEDA and molecular structure confirmation
| Fragments | Superclass | |||||
|---|---|---|---|---|---|---|
| 1 | 2 | 3 | 4 | 5 | ||
| S1 | TYR662 | p | p | p | p | P |
| TYR666 | p | p | p | p | P | |
| S1ʹ | SER630 | - | h | - | - | - |
| S2 | GLU205 | e | e | e | e | e |
| GLU206 | e | e | e | e | e | |
| ARG125 | e | e | e | e | e | |
| S2ʹ | TYR547 | - | - | p | p | p |
| TRP629 | - | - | - | p | - | |
| S2 extend | PHE357 | p | - | - | - | - |
*e: electrostatic interaction; p: π-orbital interaction; h: hydrogen-bonding interaction
Further analyses post the proposed method can be conducted in a bird’s eye view of all the interactions between the protein and inhibitors. As mentioned here, inhibitors can be automatically clustered into superclasses, and the relevant vital fragments can be extracted using the proposed method (SOM + HCA). Further analyses of IFIE-DIs as well as other PIEDA components using these important fragments can be conducted. For instance, when we verified the PIEDA components, the characters of the protein–inhibitor interactions can be further investigated (Table 2).
FMO calculations and PIEDA decompositions have recently been highlighted as tools for rational drug designs. All the calculations are based on the ab initio methodology, providing a superior approach compared with traditional force-field-based calculations. However, based on the algorithm on which several fragment pairs are generated and calculated, the analysis of the results requires a considerable effort, particularly when a series of ligands for one specific receptor are under investigation. Therefore, there is an unmet need to develop a simple method that can address multiple inhibitors.
In this study, we proposed a method that combines SOM and HCA to perform post-FMO/PIEDA calculation analysis. We assumed that the DI terms were more strongly associated with the shape of interaction interfaces compared with the other PIEDA components and clustered inhibitors based on IFIE-DIs. SOM generated grids fitting the input IFIEs, and the grid profiles provided information on vital fragments for clustering. For establishing additional superclasses, we applied HCA to the SOM grids.
Herein, a case study of DPP-IV and its inhibitors was presented to explain the feasibility of the proposed method and its results. The proposed method could correctly cluster the inhibitors and extract vital interactions. We also examined the possibility of using other PIEDA components. Based on our assumption, we could not automatically generate clusters corresponding to the real inhibitor classes when using other energy terms. Based on the results obtained using our method, further analyses can extract all types of critical interactions using vital fragments in protein–inhibitor interactions.
In drug designs, comparisons of a series of candidate compounds are critical. Lead optimizations are frequently conducted. However, this step requires considerable time and effort. The proposed method can assist in the analyses of molecular structures. More recently, the FMO database has been published for free use. Henceforth, with the accumulation of FMO calculation results, the studies on the protein–inhibitor interaction using ab initio method can be more widely conducted. The proposed method can be used in such studies.
In conclusion, we proposed a method for post-FMO/PIEDA calculation analysis. We believe this method can be widely used in future drug designs.
This work was supported by JSPS KAKENHI Grant Number JP17K08235.
The authors would like to gratefully acknowledge Prof. Kaori Fukuzawa and Prof. Yuji Mochizuki for their technical support of the ABINIT-MP program. This research was conducted as part of the FMO Drug Design Consortium (FMODD, https://fmodd.jp/). The FMO calculations were performed on the Oakforest-PACS (project IDs: hp190133; the Information Technology Center, The University of Tokyo, Tokyo, Japan). The authors would like to thank Enago (www.enago.jp) for the English language review.


