Abstract
The inhibition of hERG potassium channel is closely related to the prolonged QT interval, and to assess the risk could greatly contribute to the development of safer therapeutic compounds. In the hit-to-lead optimization stage of drug development, quantitative prediction of hERG inhibitory activity is crucial to design drug candidates without cardiotoxicity risk. Here, we developed a hERG regression model combining support vector regression (SVR) and descriptor selection by non-dominated sorting genetic algorithm (NSGA-II) based on AMED cardiotoxicity database consisting of hERG blocking information built by integrating public and commercial databases. To construct a regression model, 6,561 compounds with IC50 and/or Ki values were derived from AMED cardiotoxicity database, and randomly separated into training set (70%) for model building and test set (30%) for performance evaluation. To avoid overfitting by employing many non-relevant explanatory variables, NSGA-II, a variation of genetic algorithm for multiple objective optimization, was used for descriptor selection in order to maximize Q2 and minimize RMSE in 5-fold cross validation and minimize the number of used descriptors spontaneously. The prediction performance was then compared to those of ADMET predictor, commercial software providing various ADMET property predictions. The SVR model recorded R2 of 0.594 and RMSE of 0.604 for test set, clearly exceeding those of ADMET predictor (0.134 and 0.690, respectively). The regression model is available at our home page (https://drugdesign.riken.jp/hERG).
1. Introduction
Drug safety is an important issue in drug discovery process [1]. While lack of efficacy and safety covered approximately 30% of the failures in clinical trials in the 2000s, cardiotoxicity, hepatotoxicity, genotoxicity, and phototoxicity are also frequently observed. It was reported that cardiotoxicity and hepatotoxicity were found in 30 to 40% of clinical trials and post-approval studies, respectively [1]. The human Ether-a-go-go Related Gene potassium channel (hERG) is strongly related to drug-induced QT interval prolongation and critical arrhythmia, Torsades de Pointes (TdP) [2,3]. Because hERG can be be bound with structurally diverse compounds, various drugs (e.g., terfenadine [4], cisapride [5], and sertindole [6]) have been withdrawn from the market due to the hERG inhibition. Since, the assessment of hERG inhibitory activity is of great importance in drug discovery, various computational prediction methods have been developed using both structure and ligand-based approaches [7,8]. These studies included statistical models based on the structural information of small molecule inhibitors, and structure-based approaches employing docking simulations using modeled 3D structures of hERG. Although the electronic microscopy structure of hERG was reported in 2017 [9], docking simulations with hERG are still difficult challenges because of the high structural flexibility. In contrast, recent increase of the bioactivity information about hERG inhibitors in public databases (e.g., ChEMBL, PubChem) have been accelerating the improvement of statistical models using machine learning techniques.
The previous studies about machine learning models for hERG inhibition were summarized by Wang [7] and Villoutreix [8]. Among the recent studies, Pred-hERG, reported by Braga et al. [10] in 2005, recorded correct classification rate of 0.84 by building the classification models based on Morgan fingerprints and Chemistry Development Kit descriptors for 5,984 compounds in ChEMBL. Schyman et al. combined 3D similarity conformation and 2D similarity ensemble approach, and achieved 69% sensitivity and 95% specificity on an independent external data set [11]. In the previous study, we integrated the hERG-associated information from ChEMBL [12], GOSTAR [13], NIH Chemical Genomics Center dataset registered in PubChem [14], and hERGCentral [15] into a dataset consisting of more than 291,000 structurally diverse compounds named AMED cardiotoxicity database [16], and developed a novel hERG classification model using support vector machine with descriptor optimization by non-dominated sorting genetic algorithm-II (NSGA-II), resulting in the superior prediction performance to 3 commercially available software with accuracy of 0.984, ROC score of 0.966, and kappa statistics of 0.733 [17].
Though discrimination models can cover larger chemical space because of the availability of larger number of assay information and are especially useful to filter hit compounds obtained from initial high throughput screening, quantitative prediction is needed in hit-to-lead optimization stage in which chemical derivatization of a potent compound are performed to improve various ADMET properties while maintaining its binding affinity to the target protein. Among the previous works listed by Viloutreix [8], the largest dataset used for regression study was 882 compounds by Cianchetta [18]. The limited number of training data could result in the narrower applicability domain of the prediction model. In this study, we developed a regression model for hERG inhibitory activity by applying support vector regression (SVR) to AMED cardiotoxicity database as successfully applied to discrimination analysis in the previous study. The prediction performance of the SVR model was then compared to those by commercially available software.
2. Methods
2.1 Data set
To build a regression model for hERG inhibition, hERG blockage information registered in AMED cardiotoxicity database was used. AMED cardiotoxicity database was developed to construct comprehensive database of small molecule inhibitors for cardiac ion channels by integrating information available in various public databases and in-house assay results measured in RIKEN. The hERG inhibitory activity information was derived from ChEMBL (v23), GOSTAR, the NIH Chemical Genomics Center (NCGC) dataset in PubChem bioassay, hERGCentral. Detailed procedures of the curation to format ontologies, the standardization of chemical structures to merge data entries, and the classification of hERG inhibitors and inactive compounds were reported previously [16]. Among the hERG inhibitory activity information, assay results reporting valid IC50 (or Ki, Kd) values were derived, then mean pIC50 value was calculated for each compound. As the results, a dataset consisting of 6,561 compounds with mean pIC50 values ranging from 3.015 to 9.854 was compiled. The distribution of the pIC50 values was shown in Figure 1. The mean and median values of the pIC50 of the data set were 5.541 and 5.377, respectively. To evaluate the regression models, the dataset was randomly separated into training set (70%, 4,630 compounds) for model building and test set (30%, 1,931 compounds) for performance evaluation.

2.2 Machine learning
To select a machine learning algorithm for detailed optimization, linear regression, SVR, random forest (RF), and deep neural network (DNN) were first applied to build hERG regression models using R packages implemented in Pipeline Pilot [19] with default parameter settings. Considering the results of initial evaluation, SVR was selected for further optimization by descriptor selection and parameter tuning. SVR is a nonlinear regression model by mapping the data vectors to a high-dimensional descriptor space using kernel trick. In this study, a radial basis function (RBF) was chosen as a kernel function. During the descriptor selection described below, the gamma for the RBF and C, the constant for the slacks variant, were fixed to the default values of Pipeline Pilot (1.0 and 1.0/nx, respectively (nx indicates the number of descriptors)), to reduce computational cost. After the descriptor selection, C and gamma were optimized by a grid search in the 5-fold cross validation on the training set. The search ranges of C and gamma are as follows: C = 0.5, 1.0, or 2.0, Gamma = 0.5/nx, 1.0/nx, or 2.0/nx, where nx represented the number of explanatory variables. Other parameters were set to the default values of Pipeline Pilot.
2.3 Descriptor selection
Following the successful application in the hERG discrimination model in previous study [17], NSGA-II, a genetic algorithm based multi-objective optimization algorithm, was applied for the descriptor selection to build a regression model for hERG inhibition. In this study, 1,111 descriptors and ECFP4 structural fingerprint were calculated using RDKit [20], CDK [21], and Mordred [22] as the source of explanatory variables. Then, descriptors showing zero variance among the dataset, descriptors with missing values, highly correlated descriptors whose correlation coefficient to other descriptors exceeded 0.9, and obviously non-relevant descriptors such as the number of unknown stereo atoms were removed. To decrease the complexity, only ECFP4 was considered among the various structural fingerprints because inclusion of multiple high-dimensional fingerprints could increase the data size and calculation time. Descriptors consisting of multiple values were treated as a set, when their usage or exclusion for the model building was considered in the descriptor selection. As the results, 309 sets of descriptors were considered for the descriptor selection by NSGA-II. The list of 309 descriptor sets was available in supporting information (Table S1).
NSGA-II is an optimization algorithm to find the Pareto optimal for multiple objective functions. First, an initial population is generated randomly. The individuals in each population are sorted according to their dominance levels. The individuals in the Pareto front, which no other individual shows higher values for all objective functions than, are defined as level 1. Then, the individuals only dominated (overtaken for all of the objective functions) by the level 1 individuals are defined as level 2, and so on. In addition to the dominance level, the crowding distance is also calculated to rank the individuals with the same dominance level. The crowding distance represents how close an individual is to its neighbors. In each generation, a given number of individuals were selected based on their dominance level. If individuals with the same dominance level remain, then those with a larger crowding distance are selected. The selected individuals become the parents of the next generation, and generate the offspring by mutation and crossover. The selected individuals and offspring compose the population of the next generation. This procedure is iterated until it reaches the specified number.
In this study, NSGA-II was employed to select descriptor set by simultaneously maximizing Q2, minimizing root mean square error (RMSE), and minimizing the number of used descriptors by 5-fold cross validation for 50 iterations. The parameters of NSGA-II were defined as follows: generations = 50, population size = 20, mutation rates = 0.02 (off to on) and 0.2 (on to off), and crossover rate = 0.6.
2.4 Performance metrics
To evaluate the prediction performance, coefficient of determination (R2) and RMSE were calculated for each machine learning method. During the descriptor selection, Q2 and RMSE were calculated from the 5-fold cross validation and used as the objective function, while the separated test set was used for the evaluation of the optimized SVR model. To compare the SVR model to commercial software, the built-in hERG regression model of ADMET predictor (version 8.0) [23] was also employed to predict the inhibitory activities of the test set compounds.
3. Results and discussion
3.1 Comparison of machine learning algorithms
The prediction performances of machine learning algorithms using all 309 descriptor sets as the explanatory variables were summarized in Table 1. Among the machine learning techniques, SVR provided the lowest RMSE (0.653) for the prediction of the test set, while RF recorded slightly higher R2 value (0.536). Since the initial assessment was performed only using the default parameters implemented in Pipeline Pilot, SVR contained more parameters to optimize, such as cost factor and gamma of RBF kernel function than RF, thus, SVR was selected for the further optimization by the NSGA-II based descriptor selection.
Table 1. The prediction performances of the machine learning models for the preliminary assessment
| Algorithm |
R |
R2
|
RMSE |
| Linear regression |
0.537 |
0.288 |
0.870 |
| SVR |
0.729 |
0.531 |
0.653 |
| RF |
0.732 |
0.536 |
0.671 |
| DNN |
0.697 |
0.486 |
0.682 |
3.2 Descriptor selection by NSGA-II
The proceeding of descriptor selection by NSGA-II for 50 iterations was shown in Figure 2. The chart shows the mean value of Q2 and RMSE in the cross validation and the number of used explanatory variables for descriptor sets derived in each generation. Along with the optimization, Q2 and RMSE slightly improved with less explanatory variables, and almost reached the plateau around 30th iteration, indicating the sufficient optimization was achieved by the NSGA-II for 50 iterations. Among the derived descriptor sets, the descriptor set which showed the highest R2 value consisted of 91 descriptors (323-dimensional vector in total) and recorded Q2 of 0.526 and RMSE of 0.655 in the 5-fold cross validation of training set, and was used as the explanatory variables for the SVR models with the optimization of the parameter C and gamma value. The selected descriptors were listed in supporting information (Table S2).
3.3 Prediction performance of optimized SVR model
The prediction performances of the SVR model based on the 91 descriptors selected by NSGA-II was assessed using the separated test set. The SVR model recorded the R2 value of 0.594 and RMSE of 0.604, showing steady improvement from the SVR model using all the calculated descriptors and default parameter settings built in the initial assessment. The optimized SVR model was then compared to commercially available hERG inhibitory activity prediction software. Figure 3 shows the scatter plots of the experimentally determined hERG pIC50 and the predicted pIC50 by the optimized SVR model and ADMET predictor. The presented SVR model clearly outperformed AMED predictor in the prediction of the test set with R2 value of 0.594, compared to 0.134 by ADMET predictor.
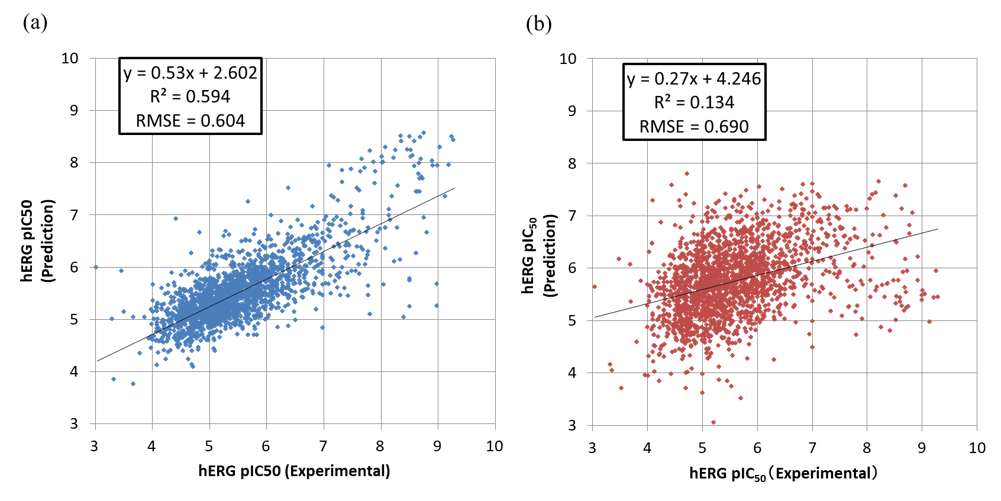
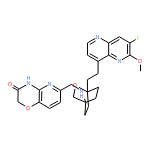
To assess how the SVR model outperformed ADMET predictor, the 5 compounds in the test set which recorded the largest differences in the absolute errors by the SVR model and ADMET predictor were listed in Table 2. Though the results contain both over and underestimate errors by ADMET predictor, all 5 compounds have a commonality in the existence of sterically bulky substituents around cationic tertiary amine. These bulky substituents make the assessment of the accessibility of the cationic atoms to the potential cation-pie interaction counterpart, hERG Y652 amino acid residue, difficult, which could result in the dramatic effect to the hERG inhibitory activities. By the use of comprehensive hERG information collected in AMED cardiotoxicity database, the SVR model could learn the potency of these scaffolds, indicating the importance of the structural diversity of the training dataset. Along with the structural diversity, our previous study revealed that the distributions of molecular properties of compounds in each database integrated in AMED cardiotoxicity database could differ due to their data source [16]. For example, ChEMBL and GOSTAR which consist of scientific literatures and patents tend to contain larger compounds compared to high throughput hERG assay results of LOPAC1280 library provided by NCGC, because manuscripts and patents often contain highly optimized structures compared to screening library compounds. Thus, more robust property distribution could be expected for AMED cardiotoxicity database by integrating various databases, which could contribute the higher prediction performance of the presented SVR model.
Table 2. The top 5 compounds for which AMED SVR model recorded lower absolute errors than ADMET predictor
| Structure |
ChEMBL_ID |
pIC50
(experimental)
|
ADMET
predictor
|
AMED
SVR
model
|

|
CHEMBL1784521 |
4.720 |
7.805 |
4.742 |

|
CHEMBL1784524 |
4.440 |
7.591 |
4.595 |

|
CHEMBL1257937 |
9.284 |
5.454 |
8.430 |
|
CHEMBL3422965 |
8.604 |
5.437 |
8.405 |
|
|
CHEMBL3422971 |
8.708 |
5.539 |
8.492 |
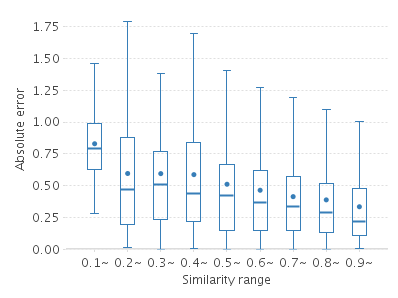
To further evaluate the prediction performance of the SVR model, absolute errors between the experimental and predicted hERG pIC50 were compared to the structural similarities of the test set compounds to the training set compounds. Figure 4 showed the relationship by box plot with the bin size of 0.1. In the similarity range above 0.4, the mean, median, and upper limit of the absolute error constantly decreased when more similar compounds were contained in the training set. Considering the rapid increase of publicly available activity information for hERG inhibition, the use of AMED cardiotoxicity database developed by integrating multiple small molecule databases would contribute the prediction performance of the SVR model by providing structurally diverse small molecules as the training data.
4. Conclusion
In the presented study, the hERG regression model using SVR and NSGA-II based descriptor selection was developed. In the initial comparison of machine learning methods, SVR recorded the lowest RMSE and selected as the algorithm for further optimization. Considering that the initial comparison was performed using the default parameters of Pipeline Pilot for the model buildings, the prediction performance of DNN could be somewhat underestimated, because the wide customize capacity of the DNN, including the number of layers, the number of neurons, the use of dropout, was not utilized in the procedure. For the future work, rigorous hyperparameter optimization of DNN could improve the prediction performance of the hERG regression model.
Along with the previously reported discrimination analysis, NSGA-II based descriptor selection successfully trimmed the non-relevant descriptors for the prediction, and yielded the descriptor set consisting of 91 descriptors showing the prediction performance of R2=0.594 and RMSE=0.604, which clearly exceeded the prediction performance of ADMET predictor (R2=0.134, RMSE=0.690) for the test set. Along with the optimization by the descriptor selection, the increased size of training data by the use of AMED cardiotoxicity database could contribute the improvement of prediction performance, considering the observed correlation between the absolute error of the prediction and structural similarity to training data. To improve the generalization property of the prediction model, further analysis to diminish the training set dependency of the prediction performance could provide better applicability to novel chemical series in future. The prediction model is available at https://drugdesign.riken.jp/hERG/, and will be updated with the AMED cardiotoxicity database. Since the cardiac active potential was modulated by various ion channels, additional consideration of effect from other ion channels to hERG inhibition could improve the assessment of cardiotoxicity risk of small molecules. Thus, more comprehensive analysis of the ion channel inhibition is planned for the future study.
Acknowledgement
This research is funded by the AMED Drug Discovery Informatics project. The authors thank Mr. Ogura for the implementation of NSGA-II based descriptor selection, and Dr. Konagaya, Mr. Mungkalaton, and the members of the AMED Drug Discovery Informatics project for useful discussions about data formats.
References
- [1] Laverty, H. G.; Benson, C.; Cartwright, E. J.; Cross, M. J.; Garland, C.; et al. How Can We Improve Our Understanding of Cardiovascular Safety Liabilities to Develop Safer Medicines? Br. J. Pharmacol. 2011, 163, 675–693. doi: 10.1111/j.1476-5381.2011.01255.x
- [2] Snyders, D. J. Structure and Function of Cardiac Potassium Channels. Cardiovasc. Res. 1999, 42, 377–390. doi: 10.1016/s0008-6363(99)00071-1
- [3] Redfern, W. S.; Carlsson, L.; Davis, A. S.; Lynch, W. G.; MacKenzie, I.; et al. Relationships between Preclinical Cardiac Electrophysiology, Clinical QT Interval Prolongation and Torsade de Pointes for a Broad Range of Drugs: Evidence for a Provisional Safety Margin in Drug Development. Cardiovasc. Res. 2003, 58, 32–45. doi: 10.1016/s0008-6363(02)00846-5
- [4] Woosley, R., L. Cardiac actions of antihistamines. Annu. Rev. Pharmacol. Toxicol. 1996, 36, 233–252. doi: 10.1146/annurev.pa.36.040196.001313
- [5] Rampe, D.; Roy, M., L.; Dennis, A.; Brown, A., M. A mechanism for the proarrhythmic effects of cisapride (Propulsid): High affinity blockade of the human cardiac potassium channel hERG FEBS Lett. 1997, 417, 28–32. doi: 10.1016/s0014-5793(97)01249-0
- [6] Alvarez, P., A.; Pahissa, J. QT alterations in psychopharmacology: proven candidates and suspects Curr. Drug Saf. 2010, 5, 97–104. doi: 10.2174/157488610789869265
- [7] Wang, S.; Li, Y.; Xu, L.; Li, D.; Hou, T. Recent Developments in Computational Prediction of HERG Blockage. Curr. Top. Med. Chem. 2013, 13, 1317–1326. doi: 10.2174/15680266113139990036
- [8] Villoutreix, B. O.; Taboureau, O. Computational Investigations of HERG Channel Blockers: New Insights and Current Predictive Models. Adv. Drug Deliv. Rev. 2015, 86, 72–82. doi: 10.1016/j.addr.2015.03.003
- [9] Wang W, MacKinnon R. Cryo-EM Structure of the Open Human Ether-À-Go-Go-Related K+ Channel hERG. Cell 2017, 169, 422–430. doi: org/10.1016/J.CELL.2017.03.048
- [10] Braga, R. C.; Alves, V. M.; Silva, M. F. B.; Muratov, E.; Fourches, D.; et al. H. Pred-HERG: A Novel Web-Accessible Computational Tool for Predicting Cardiac Toxicity. Mol. Inform. 2015, 34, 698–701. doi: 10.1002/minf.201500040
- [11] Schyman, P.; Liu, R.; Wallqvist, A. General Purpose 2D and 3D Similarity Approach to Identify hERG Blockers J. Chem. Inf. Model. 2016, 56, 213–222. doi: 10.1021/acs.jcim.5b00616
- [12] Gaulton, A.; Bellis, L. J.; Bento, A. P.; Chambers, J.; Davies, M.; et al. ChEMBL: A Large-Scale Bioactivity Database for Drug Discovery. Nucleic Acids Res. 2012, 40, D1100–D1107. doi: 10.1093/nar/gkr777
- [13] GOSTAR (GVK BIO Online Structure Activity Relationship Database) GVK Biosciences Private Limited, Plot No. 28 A, IDA Nacharam, Hyderabad, India. https://gostardb.com/gostar (2017)
- [14] Kim, S.; Thiessen, P. A.; Bolton, E. E.; Chen, J.; Fu, G.; et al. PubChem Substance and Compound Databases. Nucleic Acids Res. 2016, 44(D1), D1202–D1213. doi: 10.1093/nar/gkv951
- [15] Du, F.; Yu, H.; Zou, B.; Babcock, J.; Long, S.; Li, M. hERGCentral: A Large Database to Store, Retrieve, and Analyze Compound-Human Ether-à-Go-Go Related Gene Channel Interactions to Facilitate Cardiotoxicity Assessment in Drug Development. Assay Drug Dev. Technol. 2011, 9, 580–588. doi: 10.1089/adt.2011.0425
- [16] Sato, T.; Yuki, H.; Ogura, K.; Honma, T. Construction of an Integrated Database for hERG Blocking Small Molecules. PLOS ONE. 2018, 13, 1–18. doi: 10.1371/journal.pone.0199348
- [17] Ogura, K.; Sato, T.; Yuki, H; Honma, T. Support Vector Machine model for hERG inhibitory activities based on the integrated hERG database using descriptor selection by NSGA-II. Sci Rep. 2019, 9 (1):12220. doi: 10.1038/s41598-019-47536-3
- [18] Cianchetta, G.; Li, Y.; Kang, J.; Rampe, D.; Fravolini, A.; et al. Predictive models for hERG potassium channel blockers. Bioorg. Med. Chem. Lett. 2005, 15, 3637–3642. doi: 10.1016/j.bmcl.2005.03.062
- [19] Pipeline Pilot 2017, Dassault Systèmes BIOVIA, San Diego, US. (2017).
- [20] RDKit: Open-Source Cheminformatics Software. https://www.rdkit.org.
- [21] Willighagen, E. L.; Mayfield, J. W.; Alvarsson, J.; Berg, A.; Carlsson, L.; et al. The Chemistry Development Kit (CDK) v2.0: atom typing, depiction, molecular formulas, and substructure searching. J. Cheminf. 2017, 9, 33. doi: 10.1186/s13321-017-0220-4
- [22] Moriwaki, H.; Tian, Y. S.; Kawashita, N.; Takagi, T. Mordred: a molecular descriptor calculator. J. Cheminform. 2018, 6, 10(1):4. doi: 10.1186/s13321-018-0258-y
- [23] ADMET Predictor (version 8.0); Simulations Plus, Inc. 42505 10th Street West, Lancaster, CA 93534-7059, U.S.: http://www.simulations-plus.com (2016).


;%0A%09%09%09newWindow.document.open();%0A%09%09%09newWindow.document.write('<img src=%22./Graphics/21_70_5.png%22>');%0A%09%09%09newWindow.document.close();%0A%09%09)
;%0A%09%09%09newWindow.document.open();%0A%09%09%09newWindow.document.write('<img src=%22./Graphics/21_70_6.png%22>');%0A%09%09%09newWindow.document.close();%0A%09%09)
;%0A%09%09%09newWindow.document.open();%0A%09%09%09newWindow.document.write('<img src=%22./Graphics/21_70_7.png%22>');%0A%09%09%09newWindow.document.close();%0A%09%09)
;%0A%09%09%09newWindow.document.open();%0A%09%09%09newWindow.document.write('<img src=%22./Graphics/21_70_8.png%22>');%0A%09%09%09newWindow.document.close();%0A%09%09)