Abstract
Background:
Heart rate variability (HRV) is usually reduced in patients with CAD. We therefore investigated whether reduced HRV is predictive of angiographic CAD beyond Framingham risk in patients with stable angina.
Methods and Results:
A total of 514 patients (age, 66.1±14.3
years, 358 men) were enrolled. Holter ECG was performed before catheterization, and 24-h HRV was analyzed in both the frequency domain (VLF, LF, HF and total power) and the time domain (SDNN, SDANN, RMSSD and pNN20). Angiographic CAD was defined as ≥50% diameter reduction of 1 or more coronary arteries. On coronary angiography 203 patients (39.6%) had angiographic CAD. Patients with CAD had significantly higher Framingham risk and lower HRV according to both frequency and time domain parameters. After controlling for age, gender, heart rate, SBP, renal function, lipids and Framingham risk, reduced HRV indices remained predictors of CAD (OR, 95% CI for LF, HF, SDNN, RMSSD and pNN20: 0.81, 0.66–0.99; 0.77, 0.63–0.94; 0.75, 0.59–0.96; 0.72, 0.58–0.88; and 0.76, 0.62–0.94, respectively). On subgroup analysis, HRV parameters appeared to be predictive of CAD only in subjects with high Framingham risk or diabetes.
Conclusions:
Reduced HRV is predictive of CAD in patients with stable angina, independent of traditional risk factors and Framingham risk. The predictive value of HRV may be relevant only in subjects with high Framingham risk or diabetes. (Circ J 2016; 80: 494–501)
Coronary artery disease (CAD) is the most common type of heart disease. Coronary angiography (CAG) and intervention are the standard treatment for evaluation of coronary anatomy and, further, to alleviate their symptoms and even prevent future acute coronary syndrome (ACS).1–3
Such an invasive diagnostic procedure, however, does not appear to be suitable, given that, in an American College of Cardiology registry involving 398,978 patients, only 37.6% of the patients who had undergone CAG had obstructive CAD.4
Heart rate variability (HRV) is a non-invasive marker for the autonomic nervous system.5,6
The generality of time-domain indices of HRV are usually calculated from 24-h recording of heart rate, but the frequency-domain indices could be derived from either 24-h or as short as 2-min electrocardiographic (ECG) recordings.6
Kotecha et al showed that low HRV from 5-min ECG recordings immediately before CAG was strongly predictive of angiographic CAD.7
Transient perturbations of HRV introduced by some manipulations and emotional or physical stress in the catheterization laboratory, however, might not be negligible.5
In addition, the presence of myocardial infarction, significant valvular heart disease, and impaired left ventricular function in their subjects could also confound the measurement of HRV.7
We therefore conducted this study to investigate whether HRV could predict angiographic CAD beyond traditional risks in patients with stable angina, using 24-h ECG recording, and to further elucidate the variations between time-domain and frequency-domain HRV indices.
Methods
Subjects
The subjects were selected from an intramural registry of Taipei Veterans General Hospital (TARGET registry), conducted to enroll patients with clinical impression of CAD. In addition to treadmill exercise test, ambulatory ECG monitoring, echocardiography, medical history, physical examinations, and biochemistry were also prospectively logged in a Web-based electronic medical recording system. Estimated glomerular filtration rate (eGFR) was calculated using the published formula for Chinese subjects,8
and Framingham 10-year event risk was also calculated accordingly.9
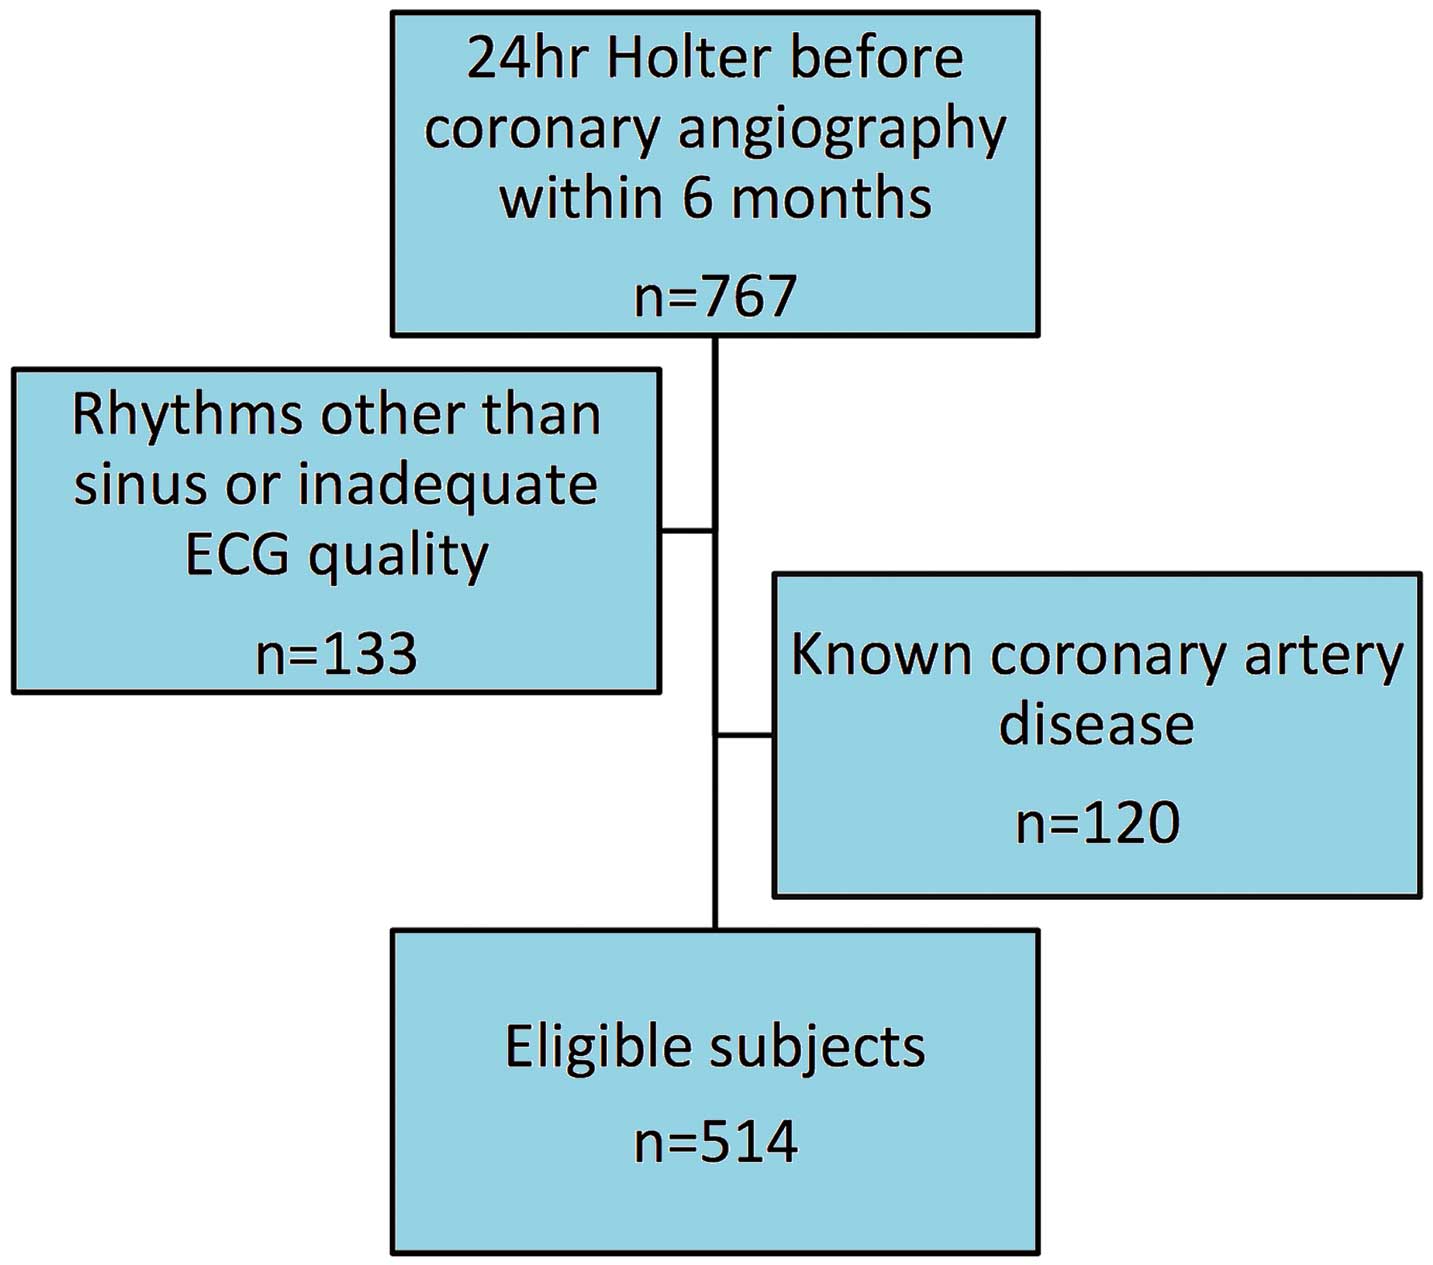
Subjects with positive non-invasive stress test and CAG within 6 months were eligible, while patients with heart failure, previous myocardial infarction, or documented CAD on CAG were excluded. From 2009 to 2013, we collected data on a total of 767 patients with stable angina, who had received 24-h ambulatory ECG monitoring using the same system (Medilog FD4, Oxford Instruments, UK). The final subject group consisted only of patients with sinus rhythm (Figure 1). The investigation conformed to the principles outlined in the Declaration of Helsinki, and the institutional review board of Taipei Veterans General Hospital approved the study.
Holter recording for up to 24 h was carried out using 3-channel digital recorders (Medilog FD4). When at least 18 h of good quality ECG signals were obtained, the ECG signals were then automatically processed and scrutinized using open-source HRV algorithms to conduct standard HRV analyses of the heartbeats.6,10
In contrast, the intervals between ectopic beats, between normal and ectopic beats, and between the unrecognizable beats were excluded from analysis. Patients with rejected intervals >5% of the total recordings were excluded from the study. Briefly, the time-domain measures of HRV consisted of mean heart rate and standard deviation of the normal interbeat intervals (SDNN), the root mean square of the successive difference between adjacent normal interbeat intervals (RMSSD), and the percentage of adjacent intervals that varied by >20 ms (pNN20), which is more discriminative for pathologic conditions than pNN50.11
SDNN gauges the overall variability of interbeat intervals. RMSSD and pNN20 rank the short-term variations of interbeat intervals, which are mainly regulated by parasympathetic innervation.12
In contrast, standard spectral HRV measures included high-frequency power (HF; 0.15–0.40 Hz), low-frequency power (LF; 0.04–0.15 Hz), and very low-frequency power (VLF; 0.003–0.04 Hz).6
The spectral HRV data were transformed using the natural logarithm for statistical analysis.
Definition of CAD
CAG was performed with at least 6 standardized projections of the left coronary artery and 2 of the right coronary artery. We classified the angiographic results into 3 categories: normal; non-obstructive CAD; and angiographic CAD (defined as ≥50% diameter reduction in 1 or more native epicardial coronary arteries or main tributary).13
Two independent and experienced interventionists, who were blinded to patient characteristics, reviewed all angiograms, with decision by senior physician in the case of differences in interpretation.
Statistical Analysis
Data are given as mean±SD or n (%). The 3 groups were compared via 1-way ANOVA and post-hoc Bonferroni test for continuous variables. Categorical variables were compared using the chi-squared test. Predictors of CAD were investigated using logistic regression analysis, and the independence of each HRV indices was tested on multiple logistic regression analysis after controlling for age, gender, systolic blood pressure (SBP), eGFR, high-density lipoprotein cholesterol (HDL-C), and even Framingham risk. Forward stepwise multiple logistic regression analysis was used to compare the predictive value of HRV indices in the time domain and frequency domain, after controlling for age, gender, SBP, eGFR, and HDL-C. Collinearity in the multivariate Cox regression models was examined by calculating the variance inflation factor. No significant collinearity was found in any of the multivariate Cox regression models. To quantify the clinical impact of adding HRV indices to Framingham 10-year risk score in predicting obstructive CAD, we used receiver operating characteristic (ROC) curve analysis, net reclassification improvement (NRI), and integrated discrimination improvement (IDI). The diagnostic accuracy of each model was calculated using discriminant analysis. On ROC curve analysis 409.1 ms2
and 404.6 ms2
were identified as cut-offs of HF and LF power, respectively, in the total population to predict CAD. The probability of angiographic CAD according to Framingham 10-year absolute event risk and HRV was compared using chi-squared test. On subgroup analysis, age was controlled for in order to evaluate the independent associations of HRV with CAD. Sensitivity analysis was conducted in patients who had undergone both Holter recording and CAG within 90 days. Level of statistical significance was set at P<0.05. Statistical analysis was carried out using SPSS 17.0 (SPSS, Chicago, IL, USA) and SAS 9.2 (SAS Institute, Cary, NC, USA).
Results
Among the total of 514 subjects (66.1±14.3 years, 154 women), 203 patients (39.5%) had angiographic CAD, 157 patients (30.5%) had non-obstructive CAD, and the other 154 patients (30%) had normal coronary arteries. Baseline characteristics are listed in
Table 1. In addition to conventional risk factors, SDNN, SDANN, RMSSD, pNN20, VLF power, LF power, HF power and total power significantly decreased in the order of normal coronary artery, non-obstructive CAD, and angiographic CAD (Table 2). Meanwhile, LF/HF was similar between the groups.
Table 1.
Subject Baseline Characteristics
| |
Normal coronary artery
(n=154) |
Non-obstructive CAD
(n=157) |
Angiographic CAD
(n=203) |
P-value |
| Age (years) |
57.7±14.4 |
66.3±12.6*,† |
73.1±11.7*,†,‡ |
<0.001 |
| Male gender (%) |
92 (59) |
114 (72.6)*,† |
152 (74.9)*,† |
0.004 |
| SBP (mmHg) |
123±16.6 |
129±17.1*,† |
135.2±19.4*,†,‡ |
<0.001 |
| DBP (mmHg) |
74.8±11.9 |
76.3±11.2 |
75.2±11.5 |
0.403 |
| Comorbidities |
| Hypertension |
54 (34.6) |
84 (53.5)*,† |
132 (64.7)*,†,‡ |
<0.001 |
| Diabetes |
23 (14.7) |
44 (28)*,† |
83 (40.7)*,†,‡ |
<0.001 |
| Hyperlipidemia |
24 (15.4) |
43 (27.4)*,† |
59 (28.9)*,† |
0.007 |
| Smokers |
35 (22.4) |
53 (33.8)*,† |
77 (37.7)*,† |
0.007 |
| Total cholesterol (mg/dl) |
171.3±30.7 |
180.6±34.8*,† |
171.7±37.2*,‡ |
0.024 |
| HDL-C (mg/dl) |
49.4±15.4 |
48.8±14.9 |
43.9±14.1*,†,‡ |
0.001 |
| LDL-C (mg/dl) |
103±26.8 |
113±29.1*,† |
105.7±31.6*,‡ |
0.008 |
| eGFR (ml/min/1.73 m2) |
93.8±27.8 |
88±27.6 |
76.7±32.2*,†,‡ |
<0.001 |
| Framingham risk (%) |
8.4±6.1 |
14.3±9.7*,† |
18.7±11.8*,†,‡ |
<0.001 |
| Medications |
| β-blockers |
33 (21.2) |
44 (28) |
84 (41.2)*,†,‡ |
<0.001 |
| RAS blockers |
44 (28.6) |
59 (37.6) |
113 (55.7)*,†,‡ |
<0.001 |
| Non-dihydropyridine CCB |
28 (18.2) |
33 (21) |
49 (24.1)*,† |
0.393 |
| Statins |
21 (13.5) |
40 (25.5)*,† |
88 (43.1)*,†,‡ |
<0.001 |
Data given as mean±SD or n (%). *P<0.05 (†vs. normal coronary artery subjects; ‡angiographic CAD vs. non-obstructive CAD). CAD, coronary artery disease; CCB, calcium channel blocker; DBP, diastolic blood pressure; eGFR, estimated glomerular filtration rate; HDL-C, high-density lipoprotein cholesterol; LDL-C, low-density lipoprotein cholesterol; RAS blockers, angiotensin-converting enzyme inhibitor or angiotensin II receptor blocker; SBP, systolic blood pressure.
Table 2.
Heart Rate and HRV vs. Angiography Findings
| |
Normal coronary artery
(n=154) |
Non-obstructive CAD
(n=157) |
Angiographic CAD
(n=203) |
P-value |
| Mean heart rate (beats/min) |
85.94±19.36 |
80.62±15.03*,† |
81.61±14.39*,† |
0.008 |
| Frequency-domain variables |
| VLF power (ms2)§ |
8.25±0.90 |
8.11±0.99 |
7.92±0.83*,† |
0.002 |
| LF power (ms2)§ |
6.93±1.08 |
6.75±1.13 |
6.50±1.04*,†,‡ |
0.001 |
| HF power (ms2)§ |
6.71±1.25 |
6.49±1.35 |
6.31±1.29*,† |
0.017 |
| TP (ms2)§ |
8.70±0.92 |
8.55±0.95 |
8.36±0.85*,†,‡ |
0.002 |
| LF/HF |
2.06±1.47 |
2.24±1.83 |
1.98±1.34 |
0.259 |
| Time-domain variables |
| SDNN (ms) |
109.64±39.41 |
103.87±35.62 |
94.73±32.82*,†,‡ |
<0.001 |
| SDANN (ms) |
93.81±37.75 |
87.77±33.97 |
80.59±31.12*,†,‡ |
0.001 |
| RMSSD (ms) |
41.31±24.77 |
39.68±26.12 |
35.77±22.38*,† |
0.084 |
| pNN20 (%) |
41.02±19.42 |
38.62±20.19 |
34.87±19.51*,† |
0.012 |
Data given as mean±SD. *P<0.05 (†vs. normal coronary artery subjects; ‡angiographic CAD vs. non-obstructive CAD). §Natural logarithm transformed. CAD, coronary artery disease; HF, high frequency; HRV, heart rate variability; LF, low frequency; pNN20, percent of the interbeat intervals differ from neighboring intervals by >20 ms; SDANN, standard deviation of the 5-min mean RR intervals; SDNN, standard deviation of all R-R intervals; RMSSD, root mean square of the successive difference between adjacent normal interbeat intervals; TP, total power; VLF, very low frequency.
Advanced age, male gender, SBP, eGFR, HDL-C, and Framingham risk correlated with the presence of angiographic CAD, while the total cholesterol and low-density lipoprotein cholesterol did not (data not shown). Except for LF/HF ratio, all the other HRV indices were predictors of obstructive CAD, while patients who had high HRV indices were less likely to have angiographic CAD. LF power, HF power, and total power, as well as SDNN, RMSSD, and pNN20 remained independent predictors when age, gender, heart rate, SBP, eGFR, and HDL-C were controlled for (Table 3, model 1). After further controlling for Framingham risk, the correlations remained (Table 3, model 2). With fixed adjustments for conventional risk factors in a forward stepwise logistic regression analysis among frequency-domain HRV variables, HF power was the strongest predictor in the model. Again among the time-domain HRV variables, RMSSD had the greatest added value in this forward stepwise logistic regression analysis. Both HF power and RMSSD consistently correlated with angiographic CAD, independent of conventional risks, comorbidity, and prescribed medication (Table S1).
Table 3.
Predictors of Angiographic CAD
| |
Model 1 |
Model 2 |
| OR (95% CI) |
P-value |
OR (95% CI) |
P-value |
| Frequency-domain variables† |
| VLF power (1 SD=0.9 ms2) |
0.85 (0.68–1.05) |
0.138 |
0.86 (0.69–1.07) |
0.166 |
| LF power (1 SD=1 ms2) |
0.80 (0.65–0.99) |
0.035 |
0.81 (0.66–0.99) |
0.043 |
| HF power (1 SD=1.3 ms2) |
0.76 (0.62–0.93) |
0.009 |
0.77 (0.63–0.94) |
0.012 |
| TP (1 SD=0.9 ms2) |
0.81 (0.65–0.99) |
0.043 |
0.81 (0.66–1.00) |
0.054 |
| Time-domain variables |
| SDNN (1 SD=36.2 ms) |
0.74 (0.58–0.94) |
0.015 |
0.75 (0.59–0.96) |
0.020 |
| SDANN (1 SD=34.5 ms) |
0.83 (0.66–1.06) |
0.134 |
0.85 (0.66–1.07) |
0.169 |
| RMSSD (1 SD=24.4 ms) |
0.71 (0.58–0.88) |
0.001 |
0.72 (0.58–0.88) |
0.002 |
| pNN20 (1 SD=19.8%) |
0.75 (0.61–0.92) |
0.007 |
0.76 (0.62–0.94) |
0.010 |
†Natural logarithm transformed. Model 1 controlling for age, gender, SBP, eGFR, HDL-C, heart rate; model 2 controlling for age, gender, SBP, eGFR, HDL-C, heart rate, Framingham risk. Abbreviations as in Tables 1,2.
On subgroup analysis, reduced HF power was related to angiographic CAD, independent of age, especially in high Framingham risk or diabetic subjects. Both of the interactions between Framingham risk or diabetes with HF power in predicting CAD were significant (P=0.024 and 0.013), respectively (Figure 2). In contrast, the prediction of angiographic CAD by HF power was not significantly affected by age, gender, smoking habit, hypertension, or use of β-blockers.

On ROC curve analysis, HF power did not improve the diagnostic probability of angiographic CAD on top of Framingham risk in either the high-risk patients (P=0.077) or in the total group (Figure 3). HF power, however, did offer additional risk stratification with respect to the Framingham risk algorithm (Figure 4). On discriminant analysis the HRV indices improved the diagnostic accuracy on top of absolute 10-year Framingham risk score in the total group and especially in the high Framingham risk (>20%) subjects (Table 4). The addition of HF or LF power to Framingham risk in the prediction model indeed offered significant NRI of 31.1% in the high-risk group (Table 4). Although none of the HRV indices provided substantial NRI beyond Framingham risk alone in the whole subject group, all of the HRV indices produced considerable clinical NRI and IDI in the total group and in the high-risk group (Table 4).


Table 4.
Improvement in Prediction of Angiographic CAD by Incorporating HRV Into Framingham 10-Year Event Risk Score
| |
Classified accuracy (%) |
NRI (%) |
cNRI (%) |
IDI (%) |
Total
group |
High-risk
group† |
Total
group |
High-risk
group† |
Total
group |
High-risk
group† |
Total
group |
High-risk
group† |
| Framingham risk |
66.3 |
66 |
|
|
|
|
|
|
| +HF power |
68.3 |
71.3 |
4.8 |
31.1* |
18.9* |
53.9* |
0.8* |
6.9* |
| +LF power |
66.3 |
71.3 |
1.5 |
31.1* |
17.9* |
59.7* |
1.3* |
7.5* |
| +TP power |
67.1 |
70.2 |
3.2 |
24.8 |
17.6* |
49.4* |
1.1* |
6.0* |
| +SDNN |
67.3 |
69.1 |
4.0 |
13.8 |
22.8* |
35.1* |
1.3* |
4.8* |
| +RMSSD |
68.3 |
71.3 |
5.6 |
20.2 |
23.8* |
42.2* |
1.1* |
8.6* |
| +pNN20 |
66.9 |
69.1 |
0 |
26.4 |
20.0* |
51.6* |
1.0* |
6.5* |
*P<0.05. †Framingham 10-year event risk score >20%. (c)NRI, (clinical) net reclassification improvement; IDI, integrated discrimination improvement; RMSSD, root mean square of the successive difference between adjacent normal interbeat intervals. Other abbreviations as in Tables 1,2.
Among 437 subjects (85% of the total group) who had CAG within 90 days after Holter recording, the HRV indices remained independent predictors of angiographic CAD, after controlling for age, gender, SBP, and HDL-C (Table S2).
Discussion
The major findings of this study are as follows: (1) both frequency-domain and time-domain HRV indices were independently associated with angiographic CAD; (2) HRV indices were related to CAD in various subgroups, but there might be significant interactions between patients with and without high Framingham risk or diabetes; (3) reductions of HRV may provide incremental predictive value in predicting CAD especially in high-risk patients. The results expand our understanding of the association between autonomic activity and CAD and support the clinical applications of HRV in the evaluation of CAG indications.
Reduction of HRV has been considered to represent a breakdown of sympathetic and parasympathetic modulation, which is related to the progression of coronary atherosclerosis and the presence of CAD.14–17
A population-based, prospective study suggested that altered cardiac autonomic activity, especially lower parasympathetic activity, is associated with the risk of developing CAD.18
In a case-control study, Hayano et al also reported that reduced vagal activity correlated with the severity of CAD,19
which is consistent with the present findings. Moreover, of the HRV parameters, HF power and RMSSD improved the model predictive probability the most. Confounders have been identified to affect cardiac autonomic function, especially left ventricular function.20,21
In the Kotecha et al study, one-third of the patients with angiographic CAD had myocardial infarction, 20% of them had impaired left ventricular function, and >24% had abnormal rhythm;7
all would confound the measures of HRV. In contrast, this study excluded patients with known heart failure or myocardial infarction, existing CAD, or rhythm disorders. On multiple logistic regression analysis the predictive value of HRV was independent of traditional risk factors, comorbidities, and the use of cardiovascular drugs. Although it is difficult to relate specific HRV measures to either sympathetic or parasympathetic tone,22
the present study has shown that both frequency-domain and time-domain HRV are predictive of CAD in patients with stable angina.
There is growing use of short-term measures of HRV to evaluate clinical outcomes in the general population and in patients with myocardial infarction.7,18,23,24
The pre-procedural measures of HRV from 5-min ECG recordings are able to predict the following CAG results, regardless of morbidity, medication, and ECG abnormalities.7
The reproducibility of short-term HRV remains a controversy, however, while autonomic activity varies within 1 day and can be affected even by acute mental stress.25,26
Given that patients undergoing CAG may face mental stress due to having an invasive examination, the predictions may differ in different patients, pre-procedural settings, and even the temperature in the catheterization room. Miyase et al showed that 5-min HRV was predictive of CAD only when it was measured immediately but not 1 day before CAG.27
In addition, as a tool of prediction, immediate pre-procedural measures may introduce no change to clinical decisions. In contrast, HRV derived from 24-h Holter ECG are stable and reproducible across a long follow-up period and even after invasive treatment.28,29
Although the study indicated that 24-h HRV analysis might improve the clinical decision-making with regard to CAG, the feasibility was low. But if patients have undergone 24-h ECG recording for other reasons, it could be valuable to assist with CAD prediction.
The present study also demonstrated significant interactions of HRV in predicting angiographic CAD in the patients with or without high Framingham risk >20%, and in patients with or without diabetes. In short, patients without diabetes did not have improvements in prediction of CAD with HF or LF power. The findings are in line with those of Karjalainen et al, who found that the prognostic impact of autonomic function in CAD was very small in non-diabetic subjects.30
Moreover, reduced HF power as well as LF power independently correlated with angiographic CAD, after controlling for age in patients with high Framingham risk or diabetes rather than in those without (Figures S1–S3). There was a significant improvement in risk reclassifications by modeling HRV in the prediction model of angiographic CAD in high Framingham risk patients. Given that diabetes has long been recognized as a myocardial infarction-equivalent risk,31
the present study supports HRV as a remarkable predictor of CAD, especially in high-risk patients.
Study Limitations
Given the nature of observational studies, there are several limitations. First, the subject group was drawn from a registry, and not all of the participants were required to undergo Holter study, hence there would be selection biases. Second, there was a considerable time lag between Holter ECG and CAG, introducing the possibility of maturation bias to internal validity. The available data, however, suggest the high stability of HRV measures derived from 24-h ambulatory ECG monitoring in both healthy subjects and in the CAD subjects.28,32,33
In addition, the study results consisted of both time-domain and frequency-domain measures of HRV, and the results were confirmed further by sensitivity test. Third, we did not evaluate the myocardial damage, if any, which might confound the measure of HRV. None of the subjects, however, had past clinical events of myocardial damage, given that we excluded patients with either heart failure or previous myocardial infarction. Fourth, we used pNN20 rather than the commonly used pNN50 as an HRV index. Last, we did not analyze the relationship between CAD territories and HRV, although right coronary artery lesions might affect heart rate.
Conclusions
The measures of HRV are associated with angiographic CAD in patients with stable angina, independent of traditional risk factors, comorbidity, medication, and Framingham risk. In addition, in patients with high risk of CAD, HRV were even more predictive. Measures of HRV may provide specific advantages in clinical practice to improve the risk reclassification of angiographic CAD. Given the inconvenience of 24-h ECG recordings, the benefit and feasibility of using Holter ECG to optimize the diagnostic algorithm of CAD remain important.
Acknowledgments
The study was supported by Taipei Veterans General Hospital (V103B-017), and Ministry of Health and Welfare, Taiwan (MOHW-104-TDU-B-211-113003).
Disclosures
The authors declare no conflicts of interest.
Supplementary Files
Supplementary File 1
Table S1.
Independence of HRV indices in predicting angiographic CAD
Table S2.
Sensitivity analysis†
for the predictors of angiographic CAD in subjects with 24-h ECG and CAG within 90 days (n=437)
Figure S1.
Odds ratios per increment of 1 SD of low-frequency power (LF; 1 SD=1.3 ms2) for the presence of obstructive coronary artery disease in the younger (≤65 years) and the older (>65 years) subjects; in women and men; in subjects with Framingham risk >20% and ≤20%; and in subjects with and without smoking, hypertension, diabetes, or use of β-blockers after controlling for age.
Figure S2.
Receiver operator curves (ROC) comparing (red line) Framingham 10-year absolute event risk with (blue line) the model containing Framingham 10-year absolute event risk and low-frequency (LF) power heart rate variability index in the (A) total group and (B) in the patients with Framingham 10-year absolute event risk >20%.
Figure S3.
Probability of obstructive coronary artery disease (CAD) according to Framingham 10-year absolute event risk of total CAD and low-frequency (LF) power.
Please find supplementary file(s);
http://dx.doi.org/10.1253/circj.CJ-15-0588
References
- 1.
Fihn SD, Gardin JM, Abrams J, Berra K, Blankenship JC, Dallas AP, et al. 2012 ACCF/AHA/ACP/AATS/PCNA/SCAI/STS guideline for the diagnosis and management of patients with stable ischemic heart disease: A report of the American College of Cardiology Foundation/American Heart Association task force on practice guidelines, and the American College of Physicians, American Association for Thoracic Surgery, Preventive Cardiovascular Nurses Association, Society for Cardiovascular Angiography and Interventions, and Society of Thoracic Surgeons. Circulation 2012; 126: e354–e471, doi:10.1161/CIR.0b013e318277d6a0., Erratum in: Circulation 2014; 129: e463, doi:10.1161/CIR.0b013e318277d6a0.
- 2.
Task Force Members,
Montalescot G, Sechtem U, Achenbach S, Andreotti F, Arden C, Budaj A, et al. 2013 ESC guidelines on the management of stable coronary artery disease: The Task Force on the management of stable coronary artery disease of the European Society of Cardiology. Eur Heart J 2013; 34: 2949–3003.
- 3.
Shiomi H, Morimoto T, Furukawa Y, Nakagawa Y, Sakata R, Okabayashi H, et al. Comparison of percutaneous coronary intervention with coronary artery bypass grafting in unprotected left main coronary artery disease: 5-year outcome from CREDO-Kyoto PCI/CABG Registry Cohort-2. Circ J 2015; 79: 1282–1289.
- 4.
Patel MR, Peterson ED, Dai D, Brennan JM, Redberg RF, Anderson HV, et al. Low diagnostic yield of elective coronary angiography. N Engl J Med 2010; 362: 886–895.
- 5.
Hayano J, Sakakibara Y, Yamada A, Yamada M, Mukai S, Fujinami T, et al. Accuracy of assessment of cardiac vagal tone by heart rate variability in normal subjects. Am J Cardiol 1991; 67: 199–204.
- 6.
Heart rate variability: Standards of measurement, physiological interpretation and clinical use. Task Force of the European Society of Cardiology and the North American Society of Pacing and Electrophysiology. Circulation 1996; 93: 1043–1065.
- 7.
Kotecha D, New G, Flather MD, Eccleston D, Pepper J, Krum H. Five-minute heart rate variability can predict obstructive angiographic coronary disease. Heart 2012; 98: 395–401.
- 8.
Sung SH, Cheng HM, Wang KL, Yu WC, Chuang SY, Ting CT, et al. White coat hypertension is more risky than prehypertension: Important role of arterial wave reflections. Hypertension 2013; 61: 1346–1353.
- 9.
Wilson PW, D’Agostino RB, Levy D, Belanger AM, Silbershatz H, Kannel WB. Prediction of coronary heart disease using risk factor categories. Circulation 1998; 97: 1837–1847.
- 10.
Goldberger AL, Amaral LA, Glass L, Hausdorff JM, Ivanov PC, Mark RG, et al. PhysioBank, PhysioToolkit, and PhysioNet: Components of a new research resource for complex physiologic signals. Circulation 2000; 101: E215–E220, doi:10.1161/01.CIR.101.23.e215.
- 11.
Mietus JE, Peng CK, Henry I, Goldsmith RL, Goldberger AL. The pNNx files: Re-examining a widely used heart rate variability measure. Heart 2002; 88: 378–380.
- 12.
Goldberger JJ, Challapalli S, Tung R, Parker MA, Kadish AH. Relationship of heart rate variability to parasympathetic effect. Circulation 2001; 103: 1977–1983.
- 13.
Scanlon PJ, Faxon DP, Audet AM, Carabello B, Dehmer GJ, Eagle KA, et al. ACC/AHA guidelines for coronary angiography. A report of the American College of Cardiology/American Heart Association Task Force on practice guidelines (Committee on Coronary Angiography). Developed in collaboration with the Society for Cardiac Angiography and Interventions. J Am Coll Cardiol 1999; 33: 1756–1824.
- 14.
Wennerblom B, Lurje L, Tygesen H, Vahisalo R, Hjalmarson A. Patients with uncomplicated coronary artery disease have reduced heart rate variability mainly affecting vagal tone. Heart 2000; 83: 290–294.
- 15.
Huikuri HV, Jokinen V, Syvanne M, Nieminen MS, Airaksinen KE, Ikaheimo MJ, et al. Heart rate variability and progression of coronary atherosclerosis. Arterioscler Thromb Vasc Biol 1999; 19: 1979–1985.
- 16.
Simula S, Vanninen E, Lehto S, Hedman A, Pajunen P, Syvanne M, et al. Heart rate variability associates with asymptomatic coronary atherosclerosis. Clin Auton Res 2014; 24: 31–37.
- 17.
Watanabe S, Amiya E, Watanabe M, Takata M, Ozeki A, Watanabe A, et al. Simultaneous heart rate variability monitoring enhances the predictive value of flow-mediated dilation in ischemic heart disease. Circ J 2013; 77: 1018–1025.
- 18.
Liao D, Cai J, Rosamond WD, Barnes RW, Hutchinson RG, Whitsel EA, et al. Cardiac autonomic function and incident coronary heart disease: A population-based case-cohort study. The ARIC Study. Atherosclerosis Risk in Communities Study. Am J Epidemiol 1997; 145: 696–706.
- 19.
Hayano J, Sakakibara Y, Yamada M, Ohte N, Fujinami T, Yokoyama K, et al. Decreased magnitude of heart rate spectral components in coronary artery disease: Its relation to angiographic severity. Circulation 1990; 81: 1217–1224.
- 20.
Nolan J, Batin PD, Andrews R, Lindsay SJ, Brooksby P, Mullen M, et al. Prospective study of heart rate variability and mortality in chronic heart failure: Results of the United Kingdom heart failure evaluation and assessment of risk trial (UK-heart). Circulation 1998; 98: 1510–1516.
- 21.
Nikolic VN, Jevtovic-Stoimenov T, Stokanovic D, Milovanovic M, Velickovic-Radovanovic R, Pesic S, et al. An inverse correlation between TNF alpha serum levels and heart rate variability in patients with heart failure. J Cardiol 2013; 62: 37–43.
- 22.
Lahiri MK, Kannankeril PJ, Goldberger JJ. Assessment of autonomic function in cardiovascular disease: Physiological basis and prognostic implications. J Am Coll Cardiol 2008; 51: 1725–1733.
- 23.
Tsuji H, Larson MG, Venditti FJ Jr, Manders ES, Evans JC, Feldman CL, et al. Impact of reduced heart rate variability on risk for cardiac events: The Framingham Heart Study. Circulation 1996; 94: 2850–2855.
- 24.
Steeds R, Fletcher J, Smith M, West J, Channer K, Townend J. Prognostic significance of early short-term measurements of heart rate variability following acute myocardial infarction. Am J Cardiol 2004; 94: 1275–1278.
- 25.
Magri D, Piccirillo G, Quaglione R, Dell’armi A, Mitra M, Velitti S, et al. Effect of acute mental stress on heart rate and QT variability in postmyocardial infarction patients. ISRN Cardiol 2012; 2012: 912672.
- 26.
Cipryan L, Litschmannova M. Intra-day and inter-day reliability of heart rate variability measurement. J Sports Sci 2013; 31: 150–158.
- 27.
Miyase Y, Miura S, Shiga Y, Nakamura A, Norimatsu K, Nishikawa H, et al. The ratio of low-frequency to high-frequency in ambulatory electrocardiographic monitoring immediately before coronary angiography as a predictor of the presence of coronary artery disease. J Clin Med Res 2014; 6: 36–43.
- 28.
Bjorkander I, Forslund L, Ericson M, Rehnqvist N, Hjemdahl P, Kahan T. Long-term stability of heart rate variability in chronic stable angina pectoris, and the impact of an acute myocardial infarction. Clin Physiol Funct Imaging 2009; 29: 201–208.
- 29.
Wennerblom B, Lurje L, Solem J, Tygesen H, Uden M, Vahisalo R, et al. Reduced heart rate variability in ischemic heart disease is only partially caused by ischemia: An HRV study before and after PTCA. Cardiology 2000; 94: 146–151.
- 30.
Karjalainen JJ, Kiviniemi AM, Hautala AJ, Piira OP, Lepojarvi ES, Peltola MA, et al. Determinants and prognostic value of cardiovascular autonomic function in coronary artery disease patients with and without type 2 diabetes. Diabetes Care 2014; 37: 286–294.
- 31.
Haffner SM, Lehto S, Ronnemaa T, Pyorala K, Laakso M. Mortality from coronary heart disease in subjects with type 2 diabetes and in nondiabetic subjects with and without prior myocardial infarction. N Engl J Med 1998; 339: 229–234.
- 32.
Kleiger RE, Bigger JT, Bosner MS, Chung MK, Cook JR, Rolnitzky LM, et al. Stability over time of variables measuring heart rate variability in normal subjects. Am J Cardiol 1991; 68: 626–630.
- 33.
Bigger JT Jr, Fleiss JL, Rolnitzky LM, Steinman RC. Stability over time of heart period variability in patients with previous myocardial infarction and ventricular arrhythmias: The CAPS and ESVEM investigators. Am J Cardiol 1992; 69: 718–723.
