Abstract
Background:
Chronic elevation of left ventricular (LV) diastolic pressure (DP) or chronic elevation of left atrial (LA) pressure, which is required to maintain LV filling, may determine LA wall deformation. We investigated this issue using transthoracic 3-dimensional speckle tracking echocardiography (3D-STE).
Methods and Results:
We retrospectively enrolled 75 consecutive patients with sinus rhythm and suspected stable coronary artery disease who underwent diagnostic cardiac catheterization and 3D-STE on the same day. We computed the global LA wall area change ratio, termed the global LA area strain (GLAS), during both the reservoir phase (GLAS-r) and contraction phase (GLAS-ct). The LVDP at end-diastole (LVEDP) and mean LVDP (mLVDP) were measured with a catheter-tipped micromanometer in each patient. GLAS-r and GLAS-ct were significantly correlated with both mLVDP (r=−0.70 [P<0.001] and r=0.71 [P<0.001], respectively) and LVEDP (r=−0.63 [P<0.001] and r=0.65 [P<0.001], respectively). In receiver operating characteristic curve analysis, the optimal cut-off values for diagnosing elevated LVEDP (≥16 mmHg) were 75.7% (sensitivity 83.3%, specificity 77.8%) for GLAS-r and −43.1% (sensitivity 90.0%, specificity 80.0%) for GLAS-ct. Similarly, for diagnosing elevated mLVDP (≥12 mmHg), the cut-off values were 63.6% (sensitivity 88.9%, specificity 80.3%) for GLAS-r and −26.2% (sensitivity 66.7%, specificity 97.0%) for GLAS-ct.
Conclusions:
We showed that 3D-STE-derived GLAS values could be used to non-invasively diagnose elevated LV filling pressure.
Left atrial (LA) reservoir function plays a key role in maintaining left ventricular (LV) filling and cardiac output without LA pressure (LAP) elevation, and its impairment can thus lead to LAP elevation.1,2
LA strain measurement using 2-dimensional (2D) speckle tracking echocardiography (STE) can be used to assess LA longitudinal reservoir function. As shown previous in studies, this method is useful for estimating LV diastolic dysfunction (LVDD) and for predicting future adverse events in patients with various cardiovascular diseases.3–5
In asymptomatic patients with hypertension or diabetes, LA longitudinal strain already is reduced, even when LA volume (LAV) is the same as that of age-matched controls.6
These findings indicate that LA deformation, except in the longitudinal direction, should increase to maintain LA reservoir function. Moreover, because LA dysfunction resulting from LA wall ischemia is expected to vary and differ in patients with and without concomitant LV ischemia, measuring LA longitudinal strain alone may be inadequate for assessing LA reservoir or booster pump functions. We investigated these issues using commercially available 3-dimensional (3D) STE (3D-STE) software.7,8
To this end, patients with suspected coronary artery disease (CAD) were enrolled in the study, and we investigated chronic elevation of LV diastolic pressure (LVDP) provoked by subclinical ischemia resulting from CAD or prior myocardial infarction (PMI), which can elevate LAP, stiffen the LA wall, and reduce LA wall area strain.
Methods
Participants
The present retrospective, cross-sectional study included patients with clinically suspected CAD. All patients underwent coronary angiography (CAG) between April 2013 and June 2014 in the Department of Cardiology, Nagoya City University Hospital. Patients with acute coronary syndrome, decompensated congestive heart failure, hypertrophic and dilated cardiomyopathies, hemodynamically significant valvular heart disease, atrial fibrillation/flutter, artificial pacemaker, or renal insufficiency (serum creatinine ≥1.5 mg/dL) were excluded from the study. This cohort included 83 patients with sinus rhythm who underwent echocardiographic examinations and cardiac catheterizations on the same day.
The present study was performed in accordance with the Declaration of Helsinki. All patients provided written informed consent before echocardiography or cardiac catheterization and were aware of an opt-out provision. Procedures were performed according to the regulations proposed by the Ethical Guidelines Committee of Nagoya City University Graduate School of Medical Sciences.
Conventional 2D and Doppler Echocardiography
All echocardiographic parameters were evaluated using ultrasound (ArtidaTM; Canon Medical Systems, Otawara, Japan), with patients examined at rest, lying in the left-sided supine position. Two-dimensional and Doppler parameters were measured to assess LV diastolic function, in accordance with recommendations.1,9
M-Mode tracing of the LV in the parasternal longitudinal axis view provided the LV dimension and both the septal and posterior wall thicknesses at end-diastole. LV mass was indexed by adjusting for body surface area (LV mass index [LVMI]), computed with a cubic formula.9
We also calculated the relative wall thickness (RWT). The biplane modified Simpson’s method was used to measure the LV ejection fraction (EF). The maximal LAV at end-systole was estimated with the biplane method of disks and adjusted for body surface area (LAV index [LAVI]).9
We measured peak mitral inflow velocities at the mitral orifice during early diastole (E) and atrial contraction (A) with pulsed Doppler echocardiography in the apical 4-chamber view to determine the E/A ratio and the E wave deceleration time. Peak mitral annular velocities were measured at both the septal and lateral corners of the mitral annulus during early diastole (e′) with pulsed Doppler imaging. To obtain mean e′, we took the average of values measured at both sites and defined the E/mean e′ as the standard index for LV filling pressure.1,10,11
3D-STE
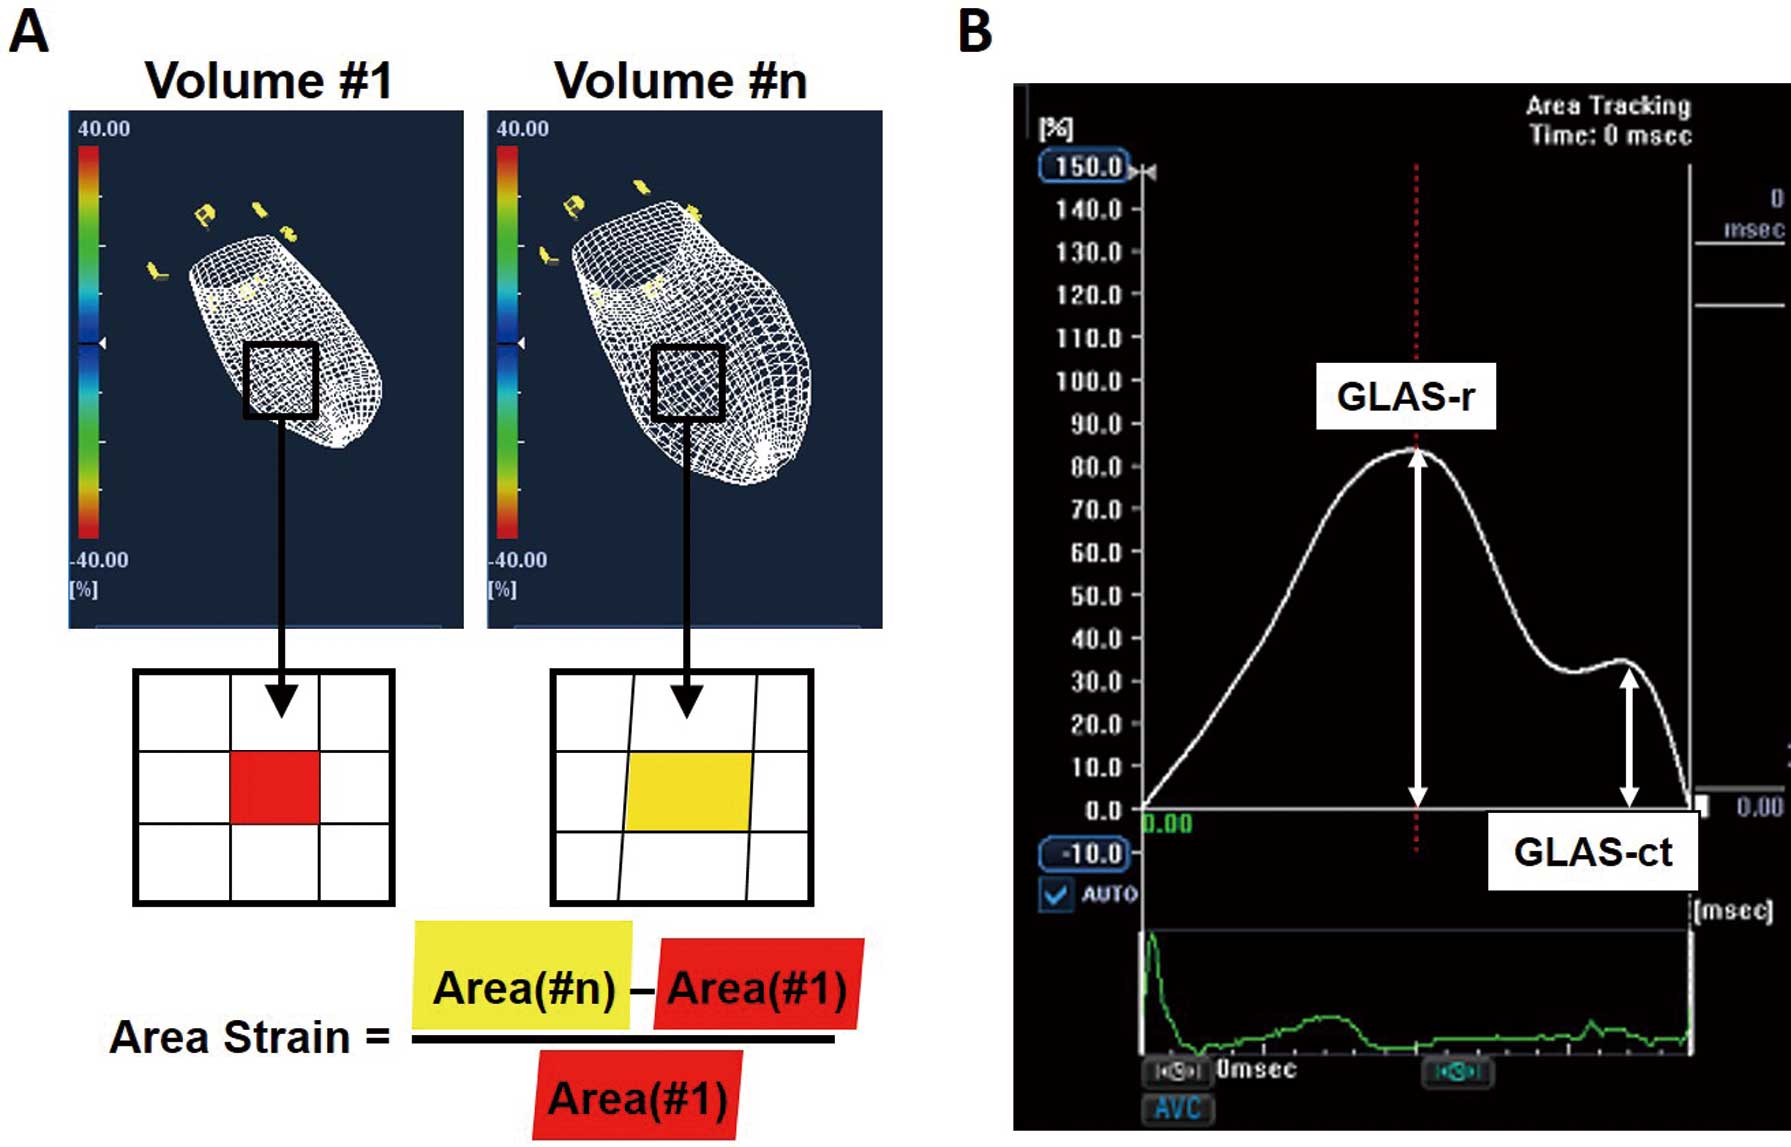
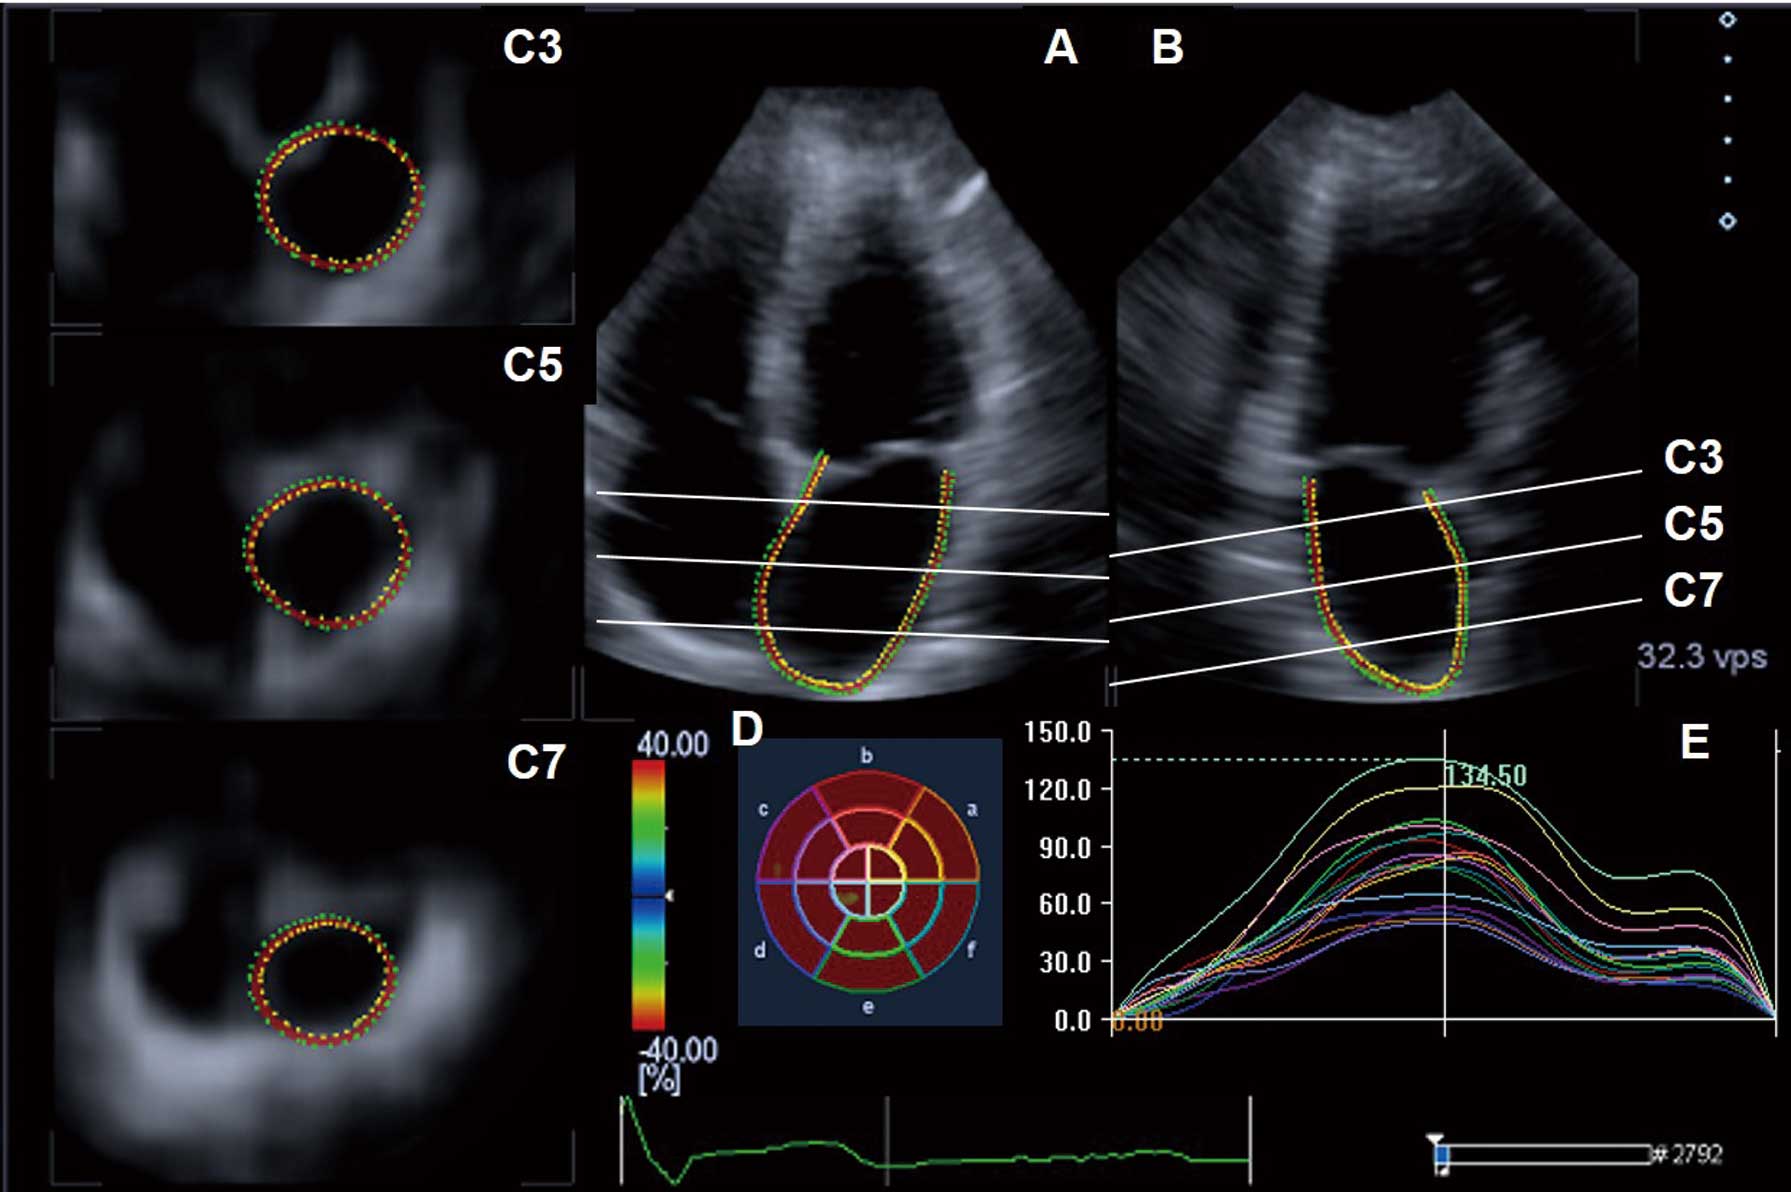
Following 2D echocardiography, 3D echocardiographic images were acquired with a matrix array transthoracic transducer in the apical LV chamber view. A full-volume image was constructed from 6 wedge-shaped images, with at least 8 wedge-shaped subvolume images be acquired during 8 consecutive cardiac cycles at end expiration. The global LA area strain (GLAS) was evaluated offline using an echocardiographic image analysis system (Ultra-ExtendTM; Canon Medical Systems). A single observer blinded to all cardiac catheterization data performed all analyses. Two orthogonal apical planes and 3 short-axis planes focused on the LA were displayed with the 3D image data (Figure 1). The area strain represented the percentage change in the LA wall area compared with its initial volume at LV end-diastole (the upslope of the R wave of the electrocardiogram), which was set as the zero reference.12
The rate of volume change ranged from 24 to 40 volumes per second. Based on the temporal change in the GLAS profile, we obtained peak GLAS during the reservoir phase (GLAS-r) and GLAS during the contraction phase (GLAS-ct;
Figure 2). Following the consensus document, GLAS-r was expressed as a positive value and GLAS-ct as a negative value.12
The temporal changes in longitudinal and circumferential strains, corresponding to 2D strain averaged from all segments, were simultaneously computed from the 3D data. We then determined global LA longitudinal strains (gALS) during the reservoir (gALS-r; positive value) and contraction (gALS-ct; negative value) phases, as well as global LA circumferential strains (gACS) during these 2 phases (gACS-r [positive value] and gACS-ct [negative value], respectively).
Most patients underwent cardiac catheterization within 2 h immediately after echocardiographic examination, but several patients underwent the procedure about half a day later, but on the same day. Before contrast material was injected into the LV or coronary artery, LV pressure (LVP) was measured with a 6-Fr catheter-tipped micromanometer (Sentron; CD Leycom, Zoetermeer, Netherlands) and recorded on a polygraph system (RMC-3000; Nihon Kohden, Tokyo, Japan). The LVP offset obtained with the micromanometer was calibrated against the pressure measured simultaneously with the fluid-filled system. As shown in
Figure 3, LVEDP was determined from the recorded pressure waveform. The mean LVDP (mLVDP), regarded as a surrogate marker of mean LAP, was calculated using the method proposed by Yamamoto et al.13
After recording the LVP, we performed biplane contrast left ventriculography for diagnosing LV wall motion abnormality. According to the criteria proposed by the European Study Group on Diastolic Heart Failure, mLVDP ≥12 mmHg was considered elevated, and LVEDP ≥16 mmHg was also considered elevated.14
Then, CAG was performed using isosorbide dinitrate. CAD in this study was defined as >75% stenosis in at least 1 of the 3 major coronary arteries, based on CAG.

Statistical analyses were performed with SPSS version 26.0 (IBM Corp., Armonk, NY, USA). All patients were assigned to 1 of 2 groups, based on the criteria of elevated LVEDP, elevated mLVDP, having CAD, having a left circumflex coronary artery (LCx) lesion, or having a history of PMI because of LCx occlusion. Continuous data are expressed as the mean±SD and were compared using Student’s t-tests. The LVMI is expressed as the median value with interquartile range because it was not normally distributed, and median values were compared using the Mann-Whitney U test. The Mann-Whitney U test was also used to compare mean values for unbalanced groups (i.e., the elevated mLVDP group was much smaller than the normal mLVDP group). Categorical data are presented as numbers and percentages and were compared using the Chi-squared or Fisher’s exact test. Correlations between variables and LVEDP or mLVDP were evaluated with Pearson’s or Spearman’s method, as appropriate. Logistic regression analyses were used to determine parameters for diagnosing elevated LVEDP or mLVDP. Receiver operating characteristic (ROC) curve analyses were used to determine optimal cut-off values for echocardiographic parameters for diagnosing elevated mLVDP or LVEDP. Multivariate areas under the ROC curves (AUCs) were used to assess significant differences among parameters. Significance was defined as 2-tailed P<0.05.
Results
Of 83 patients, 8 were excluded because of inadequate 3D-STE quality. Thus, the final analyses was performed on 75 patients. Of these patients, 62 (82.7%) were diagnosed on CAG as having new-onset or recurrent angina pectoris, 23 (30.7%) had a single vessel lesion, and 39 (52.0%) had multiple vessel lesions. The remaining 13 patients (17.3%) did not have new CAD. Sixty-five patients (86.7%) had preserved LVEF (≥50%). Four patients (5.3%) had previously been treated for congestive heart failure due to acute myocardial infarction (MI), all of whom had reduced LVEF.
Table 1
compares patient clinical characteristics and cardiac catheterization data between groups with elevated or normal LVEDP and mLVDP. LVEDP was elevated in 30 patients (40.0%) and normal in 45 patients (60.0%). These groups did not differ significantly in age, sex, mean blood pressure, LVEF, history of PMI, or major comorbidities. Compared with patients with normal LVEDP, CAD was more common among patients with elevated LVEDP, especially those with a lesion of the left anterior descending artery (LAD), lower heart rates, and higher mLVDP values and more frequent use of angiotensin-converting enzyme inhibitors or angiotensin receptor blockers for major CAD-associated comorbidities. Compared with patients with normal mLVDP, LAD lesions and higher LVEDP values were more common with elevated mLVDP. The groups did not differ in the use of medications for comorbidities.
Table 1.
Comparisons of Clinical Characteristics and Cardiac Catheterization Data Between Patients With Elevated and Normal Left Ventricular Pressure
| |
LVEDP |
mLVDP |
≥16 mmHg
(n=30) |
<16 mmHg
(n=45) |
P value |
≥12 mmHg
(n=9) |
<12 mmHg
(n=66) |
P value |
| Age (years) |
67.8±8.7 |
67.6±9.9 |
0.96 |
65.7±10.4 |
68.0±9.3 |
0.50 |
| Male sex |
21 (70.0) |
30 (66.7) |
0.76 |
6 (66.7) |
45 (68.2) |
0.93 |
| Heart rate (beats/min) |
62.6±10.0 |
69.4±13.5 |
0.02 |
66.3±14.5 |
66.7±12.5 |
0.88 |
| Mean BP (mmHg) |
103.2±14.7 |
98.9±13.4 |
0.20 |
104.3±16.6 |
100.1±13.6 |
0.19 |
| LVEF (%) |
63.0±15.2 |
65.2±13.9 |
0.51 |
56.9±20.9 |
65.3±13.2 |
0.20 |
| LVEDP (mmHg) |
19.8±4.5 |
11.1±2.9 |
<0.001 |
24.6±5.0 |
13.2±4.1 |
<0.001 |
| mLVDP (mmHg) |
11.5±3.8 |
5.3±2.2 |
<0.001 |
16.1±3.6 |
6.7±2.8 |
<0.001 |
| Hypertension |
20 (66.7) |
31 (68.9) |
0.84 |
7 (77.8) |
44 (66.7) |
0.50 |
| Dyslipidemia |
26 (86.7) |
37 (82.2) |
0.61 |
7 (77.8) |
56 (84.8) |
0.59 |
| Diabetes |
11 (36.7) |
19 (42.2) |
0.63 |
4 (44.4) |
26 (39.4) |
0.77 |
| Past history of HF |
3 (10.0) |
1 (2.2) |
0.14 |
2 (22.2) |
2 (3.0) |
0.02 |
| CAD |
28 (93.3) |
34 (75.6) |
0.009 |
9 (100) |
53 (80.3) |
0.14 |
| LAD |
27 (90.0) |
27 (60.0) |
0.005 |
9 (100) |
45 (68.2) |
0.046 |
| LCx |
14 (46.7) |
20 (44.4) |
0.85 |
4 (44.4) |
30 (45.5) |
0.95 |
| RCA |
12 (40.0) |
14 (31.1) |
0.43 |
5 (55.6) |
21 (31.8) |
0.16 |
| PMI |
13 (43.3) |
14 (31.1) |
0.28 |
3 (33.3) |
24 (36.4) |
0.86 |
| LAD |
7 (23.3) |
7 (15.6) |
0.40 |
2 (22.2) |
12 (18.2) |
0.77 |
| LCx |
3 (10.0) |
3 (6.7) |
0.60 |
2 (22.2) |
4 (6.1) |
0.09 |
| RCA |
8 (26.7) |
7 (15.6) |
0.24 |
4 (44.4) |
11 (16.7) |
0.051 |
| Paroxysmal Af or AFL |
1 (3.3) |
3 (6.7) |
0.53 |
0 (0) |
4 (6.1) |
0.45 |
| ACEI or ARB treatment |
19 (63.3) |
16 (35.6) |
0.02 |
6 (66.7) |
29 (43.9) |
0.20 |
| β-blocker treatment |
16 (53.3) |
21 (46.7) |
0.57 |
4 (44.4) |
33 (50.0) |
0.75 |
| CCB treatment |
10 (33.3) |
21 (46.7) |
0.25 |
3 (33.3) |
28 (42.4) |
0.60 |
| Statin treatment |
22 (73.3) |
27 (60.0) |
0.24 |
5 (55.6) |
44 (66.7) |
0.51 |
| Diuretics treatment |
2 (6.7) |
3 (6.7) |
1.00 |
0 (0) |
5 (7.6) |
0.39 |
Data are the mean±SD or n (%). ACEI, angiotensin-converting enzyme inhibitor; Af, atrial fibrillation; AFL, atrial flutter; ARB, angiotensin receptor blocker; BP, blood pressure; CAD, coronary artery disease newly diagnosed in this study; CCB, calcium channel blocker; HF, heart failure; LAD, left anterior descending artery; LCx, left circumflex coronary artery; LVEDP, left ventricular end-diastolic pressure; LVEF, left ventricular ejection fraction; mLVDP, mean left ventricular diastolic pressure; PMI, prior myocardial infarction; RCA, right coronary artery.
Comparisons of conventional 2D and 3D echocardiographic parameters between patients with elevated or normal LVP are presented in
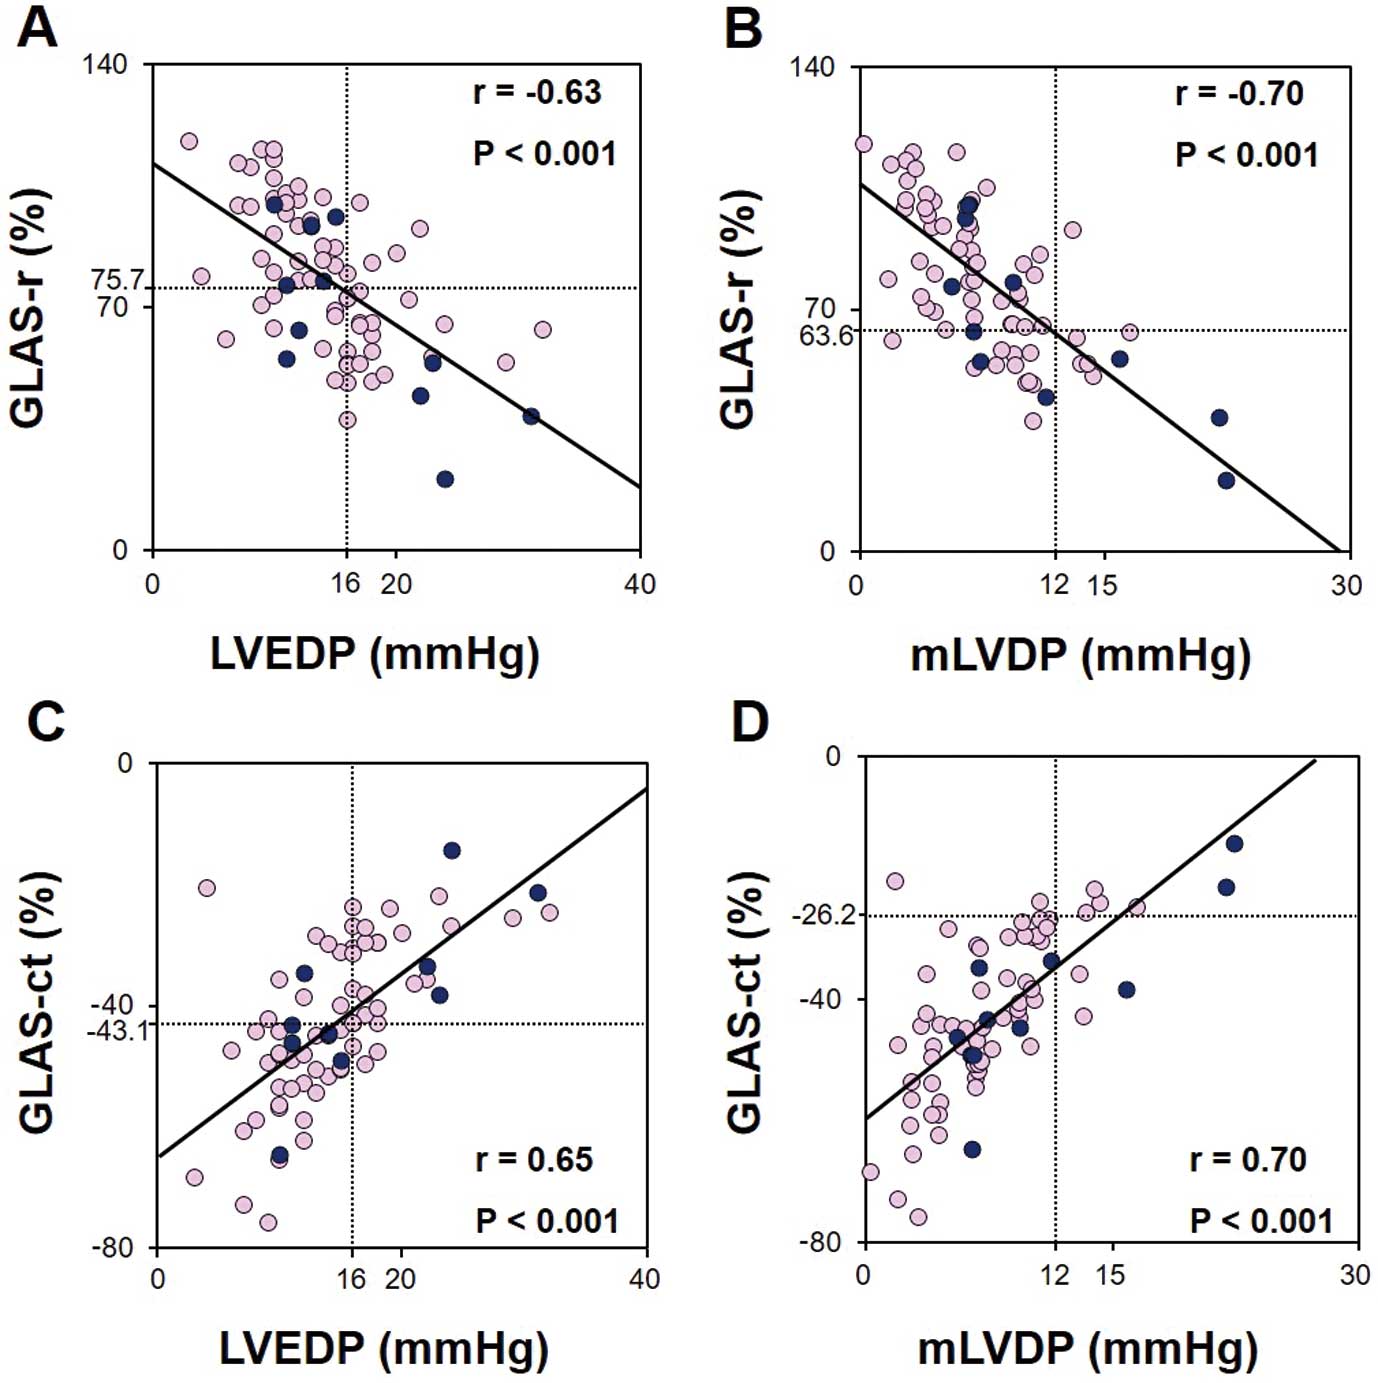
Table 2. Univariate correlation analyses revealed a significant correlation of LVEDP with the E velocity, E/A ratio, E/mean e′, LAVI, GLAS-r, and GLAS-ct in all patients, including patients with preserved LVEF (Table 3). In addition, mLVDP was significantly correlated with deceleration time and RWT in all patients, except those with preserved LVEF (Table 3).
Figure 4
shows the correlations of GLAS-r and GLAS-ct with LVEDP and mLVDP in all patients.
Table 2.
Comparisons of Conventional 2- and 3-Dimensional Echocardiographic Parameters Between Patients With Elevated and Normal Left Ventricular Pressures
| |
LVEDP |
mLVDP |
≥16 mmHg
(n=30) |
<16 mmHg
(n=45) |
P value |
≥12 mmHg
(n=9) |
<12 mmHg
(n=66) |
P value |
| E (cm/s) |
71.7±19.7 |
58.1±11.7 |
0.001 |
81.1±25.8 |
61.1±13.6 |
0.035 |
| A (cm/s) |
75.4±18.4 |
76.6±16.5 |
0.76 |
75.0±21.6 |
76.3±16.6 |
0.79 |
| E/A ratio |
0.99±0.34 |
0.78±0.18 |
0.003 |
1.17±0.53 |
0.81±0.21 |
0.027 |
| DT (ms) |
206.5±48.4 |
229.3±62.4 |
0.10 |
186.9±59.4 |
224.7±56.7 |
0.07 |
| Mean e′ (cm/s) |
7.5±1.8 |
7.2±1.9 |
0.54 |
7.8±2.5 |
7.2±1.8 |
0.46 |
| E/mean e′ ratio |
10.2±3.7 |
8.6±2.6 |
0.047 |
11.4±5.1 |
8.9±2.7 |
0.19 |
| LAVI (mL/m2) |
32.3±10.8 |
24.8±8.4 |
0.002 |
35.1±8.9 |
26.8±9.9 |
0.013 |
| LVMI (g/m2) |
104.6 [84.1–134.7] |
98.7 [85.7–110.1] |
0.27 |
115.4 [86.8–152.1] |
99.5 [85.0–114.4] |
0.32 |
| RWT |
0.43±0.08 |
0.45±0.10 |
0.38 |
0.41±0.10 |
0.45±0.09 |
0.29 |
| GLAS-r (%) |
61.6±16.9 |
88.2±17.6 |
<0.001 |
54.7±19.4 |
80.7±20.1 |
0.001 |
| GLAS-ct (%) |
−33.0±8.9 |
−49.1±11.3 |
<0.001 |
−27.6±9.2 |
−44.7±12.1 |
<0.001 |
Data are the mean±SD or median (interquartile range). DT, deceleration time of E wave; E and A, early and late peak velocity of mitral inflow, respectively; GLAS-r and GLAS-ct, global left atrial area strain during reservoir phase and during contraction phase, respectively; LAVI, left atrial volume index; LVEDP, left ventricular end-diastolic pressure; LVMI, left ventricular mass index; mean e′, the averaged value of peak velocities obtained at both the septal and lateral annual corners during early diastole; mLVDP, mean left ventricular diastolic pressure; RWT, relative wall thickness.
Table 3.
Univariate Correlation Analyses Between Clinical or Echocardiographic Parameters and LVEDP or mLVDP
| |
LVEDP |
mLVDP |
All patients
(n=75) |
Patients with LVEF ≥50%
(n=65) |
All patients
(n=75) |
Patients with LVEF ≥50%
(n=65) |
Correlation
coefficient |
P value |
Correlation
coefficient |
P value |
Correlation
coefficient |
P value |
Correlation
coefficient |
P value |
| Age |
−0.06 |
0.47 |
−0.13 |
0.13 |
−0.06 |
0.48 |
−0.10 |
0.25 |
| Male sex |
−0.03 |
0.79 |
−0.06 |
0.55 |
0.003 |
0.97 |
−0.05 |
0.62 |
| Hypertension |
−0.001 |
0.99 |
−0.001 |
0.99 |
0.09 |
0.34 |
0.07 |
0.50 |
| Diabetes |
−0.03 |
0.80 |
0.01 |
0.93 |
−0.01 |
0.90 |
−0.10 |
0.94 |
| Dyslipidemia |
0.06 |
0.56 |
0.07 |
0.49 |
0.08 |
0.43 |
0.11 |
0.29 |
| CAD |
0.22 |
0.03 |
0.22 |
0.04 |
0.26 |
0.01 |
0.26 |
0.01 |
| PMI |
0.14 |
0.15 |
0.11 |
0.31 |
0.15 |
0.11 |
0.09 |
0.36 |
| Paroxysmal Af or AFL |
−0.11 |
0.29 |
−0.10 |
0.34 |
−0.15 |
0.13 |
−0.14 |
0.17 |
| E |
0.46 |
<0.001 |
0.44 |
<0.001 |
0.45 |
<0.001 |
0.45 |
<0.001 |
| A |
−0.03 |
0.81 |
0.04 |
0.75 |
−0.06 |
0.61 |
0.05 |
0.71 |
| E/A ratio |
0.28 |
0.015 |
0.32 |
0.01 |
0.25 |
0.03 |
0.33 |
0.01 |
| DT |
−0.21 |
0.07 |
−0.12 |
0.36 |
−0.27 |
0.02 |
−0.14 |
0.27 |
| Mean e′ |
−0.03 |
0.79 |
−0.01 |
0.94 |
−0.07 |
0.54 |
−0.01 |
0.94 |
| E/mean e′ ratio |
0.27 |
0.02 |
0.25 |
0.047 |
0.36 |
0.002 |
0.32 |
0.01 |
| LAVI |
0.39 |
0.001 |
0.30 |
0.014 |
0.47 |
<0.001 |
0.39 |
0.001 |
| LVMI |
0.12 |
0.29 |
0.10 |
0.44 |
0.23 |
0.051 |
0.19 |
0.13 |
| RWT |
−0.15 |
0.19 |
−0.06 |
0.61 |
−0.27 |
0.02 |
−0.08 |
0.53 |
| GLAS-r |
−0.63 |
<0.001 |
−0.60 |
<0.001 |
−0.70 |
<0.001 |
−0.66 |
<0.001 |
| GLAS-ct |
0.65 |
<0.001 |
0.62 |
<0.001 |
0.70 |
<0.001 |
0.69 |
<0.001 |
Abbreviations as in Tables 1,2.
The gALS-r and gACS-r were 27.9±7.4% and 38.4±11.1%, respectively. The magnitude of gACS-r was greater than that of gALS-r (P<0.001). Even in patients with preserved LVEF, the magnitude of gACS-r was greater than that of gALS-r (39.4±10.5% vs. 29.0±7.1%, respectively; P<0.001). Similarly, the magnitude of gACS-ct was greater than that of gALS-ct in all patients (−23.7±7.6% vs. −14.2±4.4%, respectively; P<0.001), including those with preserved LVEF (−23.7±8.0% vs. −14.3±4.8%, respectively; P<0.001). These values were all significantly correlated with both LVEDP and mLVDP in all patients, including those with preserved LVEF (Supplementary Table 1). Correlations with LVEDP and mLVDP were stronger for gACS-r and gACS-ct than for gALS-r and gALS-ct.
Effect of CAD on Relationships Between 3D-STE-Derived Strain Parameters and LVDPs
Compared with patients without CAD, all 3D-STE-derived strain parameters tended to be reduced in patients with CAD. In particular, GLAS-ct, gALS-r, and gACS-ct were significantly reduced in patients with than without CAD (GLAS-ct: −41.3±12.8% vs. −49.1±12.8% [P=0.048]; gALS-r: 26.9±7.2% vs. 32.8±7.5% [P=0.019]; and gACS-ct: −22.7±7.5% vs. −28.3±6.8% [P=0.02]). In contrast, there were no significant differences in GLAS, gALS, or gACS between subgroups with and without LCx lesions. However, in patients with PMI because of LCx occlusion (n=6), GLAS-ct, gALS-r, gACS-r, and gACS-ct were significantly reduced compared with patients without lateral PMI (GLAS-ct: −31.4±11.7% vs. −43.6±12.7% [P=0.033]; gALS-r: 21.2±8.2% vs. 28.5±7.2% [P=0.044]; gACS-r: 28.7±10.7% vs. 39.2±10.8% [P=0.042]; gACS-ct: −16.5±8.6% vs. −24.3±7.3% [P=0.037]).
Logistic Regression Analyses for Diagnosing Elevated LVEDP or mLVDP
Univariate logistic regression analyses were performed to identify possible independent variables (P<0.05). The E/A ratio, E/mean e′, LAVI, and GLAS were selected for diagnosing elevated LVEDP, and the E velocity, E/mean e′, LAVI, and GLAS were also selected for diagnosing elevated mLVDP (Supplementary Table 2). Multivariate logistic regression analysis identified GLAS-r and the E/A ratio as determinants for diagnosing elevated LVEDP in Model 1 (per 10% increase in GLAS-r: odds ratio [OR] 0.35, 95% confidence interval [CI] 0.21–0.58, P<0.001; and per 0.1 increase in the E/A ratio: OR 1.74, 95% CI 1.22–2.48, P=0.002). It also identified GLAS-ct as a determinant in Model 2 (per 10% increase: OR 4.70, 95% CI 2.35–9.40, P<0.001). Similarly, in multivariate logistic regression analyses for diagnosing elevated mLVDP, GLAS-r and E velocity were identified as determinants in Model 3 (per 10% increase in GLAS-r: OR 0.54, 95% CI 0.32–0.89, P=0.015; and per 10 cm/s increase in E velocity: OR 1.76, 95% CI 1.09–2.83, P=0.02), and GLAS-ct was identified as a determinant in Model 4 (per 10% increase: OR 4.92, 95% CI 1.79–13.6, P=0.002). All patients with elevated mLVDP had CAD and none of them had paroxysmal atrial fibrillation/flutter. Thus, both variables were excluded from the analysis for diagnosing elevated mLVDP.
Validation of Diagnostic Accuracy for Estimating Elevated LVEDP
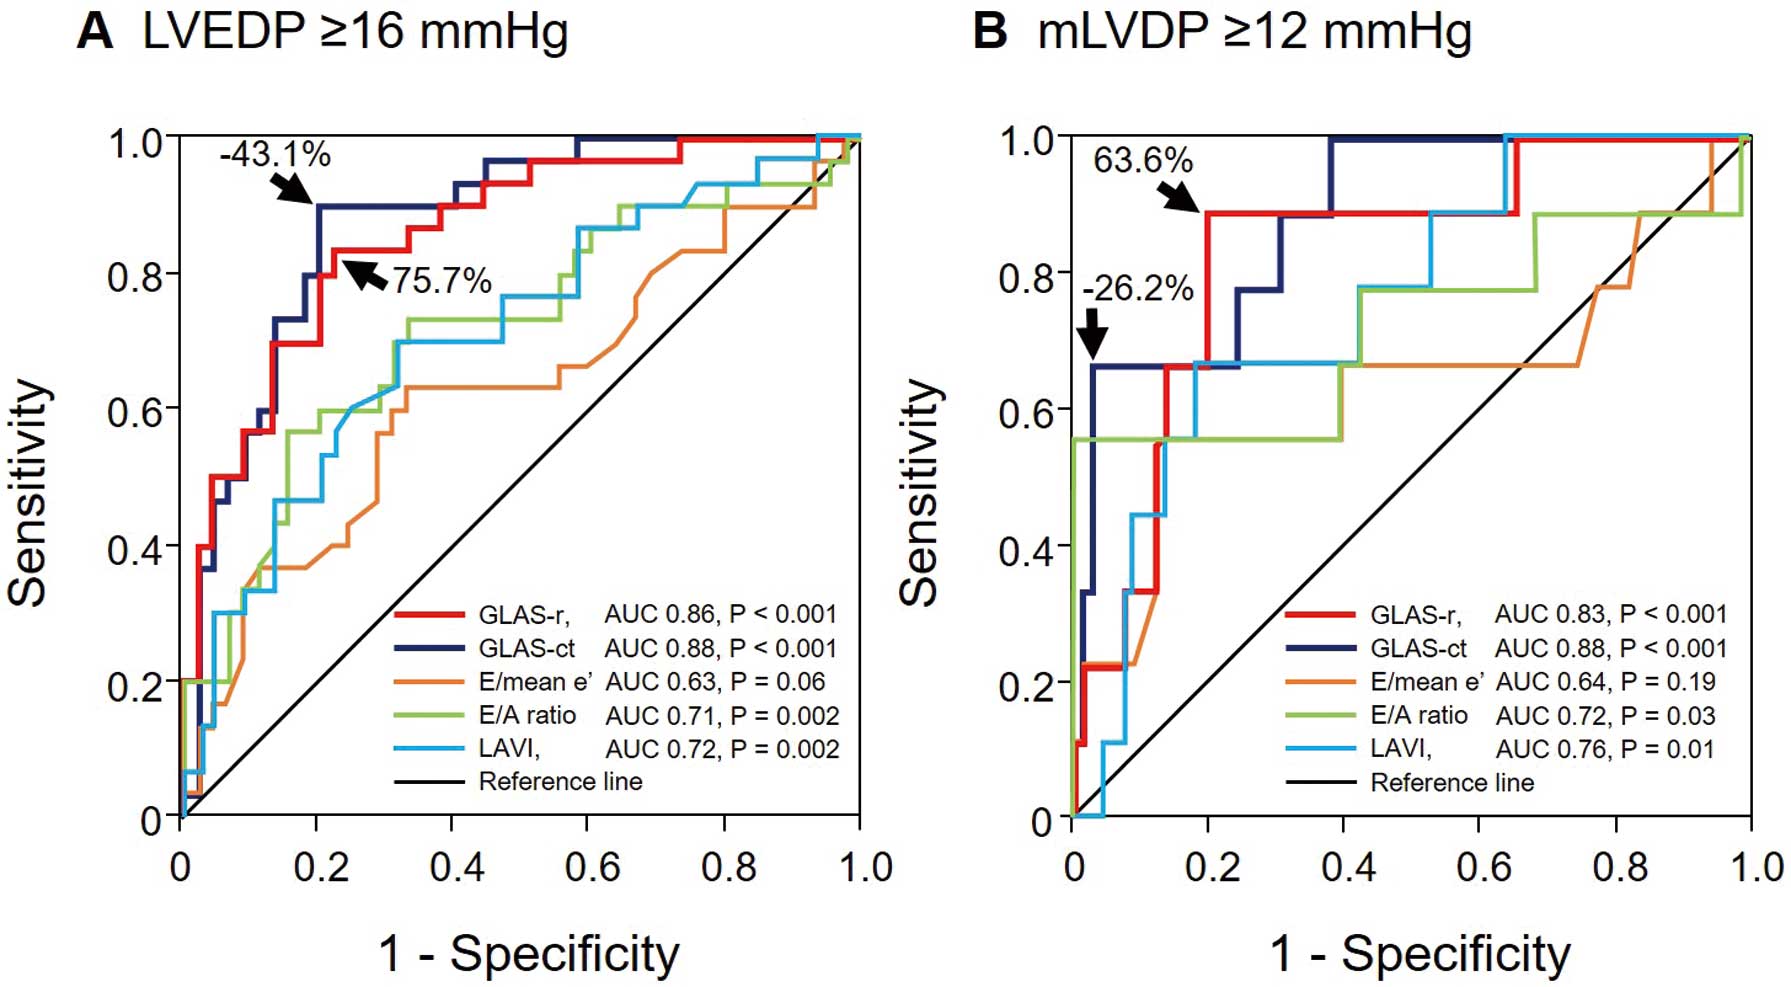
To verify the accuracy of the 2 GLAS parameters for diagnosing elevated LVEDP, we performed ROC curve analyses (Figure 5A). The AUC of GLAS-r for diagnosing elevated LVEDP was 0.86 (95% CI 0.78–0.94; P<0.001) and the optimal cut-off value was 75.7% (sensitivity 83.3%, specificity 77.8%, accuracy 80.0%). Similarly, the AUC of GLAS-ct for identifying elevated LVEDP was 0.88 (95% CI 0.80–0.96; P<0.001) and the optimal cut-off value was −43.1% (sensitivity 90.0%, specificity 80.0%, accuracy 84.0%).
Furthermore, even in patients with preserved LVEF, the AUCs of both GLAS-r and GLAS-ct were sufficiently high for diagnosing elevated LVEDP (0.86 [95% CI 0.77–0.95, P<0.001] and 0.87 [95% CI 0.79–0.96, P<0.001], respectively). Using the same cut-off values, the diagnostic sensitivities, specificities, and accuracies were 80.8%, 79.5%, and 80.0%, respectively, for GLAS-r and 88.5%, 79.5%, and 83.1%, respectively, for GLAS-ct.
Validation of Diagnostic Accuracy for Estimating Elevated LV Filling Pressure
To identify patients with elevated mLVDP, we also performed ROC curve analyses (Figure 5B). The AUCs of both GLAS-r and GLAS-ct were 0.83 (95% CI 0.70–0.97, P=0.001) and 0.88 (95% CI 0.78–0.99, P<0.001), respectively. The optimal cut-off values were 63.6% (sensitivity 88.9%, specificity 80.3%, accuracy 81.3%) for GLAS-r and −26.2% (sensitivity 66.7%, specificity 97.0%, accuracy 93.3%) for GLAS-ct.
In patients with preserved LVEF, the AUCs of both GLAS-r and GLAS-ct were 0.78 (95% CI 0.61–0.95, P=0.025) and 0.88 (95% CI 0.75–1.00, P=0.003), respectively. Using the same cut-off values, the predictive sensitivities, specificities, and accuracies were 83.3%, 81.4%, and 81.5%, respectively, for GLAS-r, and 66.7%, 96.6%, and 93.8%, respectively, for GLAS-ct.
Validation of the Reproducibility of the GLAS Estimation
To assess the reproducibility of the GLAS estimation, we randomly selected 20 patients and had another observer analyze their images. We performed Bland-Altman and intraclass correlation coefficient (ICC) analyses to evaluate intra- and interobserver agreements, respectively. Bland-Altman analyses demonstrated mean differences (±SD) of 5.4±9.0% for GLAS-r and −5.8±11% for GLAS-ct. The ICC analyses also demonstrated significant correlations for GLAS-r (0.97, 95% CI 0.94–0.99, P<0.001) and GLAS-ct (0.96, 95% CI 0.93–0.98, P<0.001).
Discussion
The present study offers a first assessment of correlations between cardiac catheterization-derived LVDPs and 3D-STE-derived GLAS values in patients with suspected CAD. We found that by evaluating GLAS we could identify patients with either elevated LV filling pressure or elevated LVEDP with high specificity from a cohort with suspected CAD. We also found that LA circumferential strains, which can be assessed by 3D-STE, are important in diagnosing LVDD as well as longitudinal strains.
Previous studies have demonstrated the feasibility of acquiring a 3D-STE data and evaluating LA strain with echocardiography and 3D-STE analysis, as we have done here, in healthy volunteers and even in patients with atrial fibrillation.8
In the present study, we demonstrated that we could also measure GLAS using the same analytical system in approximately 90% of all patients, which is sufficient for clinical practice.
Some previous studies using experimental models examined, in detail, the effects of myocardial ischemia on LA function and indicated that circumferential deformation may be important for maintaining LA reservoir function.15,16
As Barbier et al demonstrated in experiments performed in dogs, LV longitudinal shortening (i.e., LV base systolic descent) and LA relaxation subsequent to LA contraction are determinants of LA reservoir function.15
Acute LV regional ischemia resulting from temporary LAD occlusion impairs the late phase of LA reservoir function. In contrast, the early phase of LA reservoir function, produced by LA relaxation, is not impaired. Barbier et al also assessed LA reservoir function by using LA area change from minimum to maximum, which included circumferential as well as longitudinal deformation.15
Bauer et al demonstrated, in an experimental model in sheep, that LA contraction and relaxation are important in compensating LV filling and maintaining cardiac output during acute ischemia.16
In particular, cardiac output was significantly reduced in their model of both LA and LV ischemia produced by occluding the proximal LCx compared with a model with LV ischemia alone.16
This difference could be explained by the fact that both LA stroke volume and stroke work were significantly reduced with LA ischemia. With the deterioration of LV systolic function, particularly LV global longitudinal strain (LV-GLS), LA reservoir function should gradually become dependent on LA relaxation. However, with the deterioration of LV-GLS, LA contraction and subsequent LA relaxation are not necessarily impaired. Hence, preserving the reservoir function of the LA requires compensatory enhancement of the strain in the circumferential direction. For these reasons, we focused on LA circumferential strains during the reservoir and contraction phases, which should be useful for assessing LA function, especially in patients with CAD. As we showed in this study, LA function can be assessed using 3D-STE.
In patients without apparent heart failure or with preserved LVEF, some previous studies indicated that LA circumferential strain may play an important role in assessing LVDD, even before apparent LA abnormalities develop.6,17
Mondillo et al, comparing patients to age-matched controls, demonstrated that the 2D-STE-derived LA longitudinal strain during reservoir phase (LASr) had already deteriorated in asymptomatic patients with echocardiographically abnormal LV geometry and with hypertension or diabetes, even if their LAV was similarly normal.6
These authors also reported no significant differences between LAVs at the reservoir, conduit, and contraction phases in their cohorts. This finding indicates that augmenting the circumferential strain compensates for the impairments of LASr. We demonstrated that the magnitudes of LA circumferential strains (gACS-r and gACS-ct) were significantly greater than those of longitudinal strains (gALS-r and gALS-ct) in all patients, including patients with preserved LVEF. In addition, we found that the correlations of gALS-r and gALS-ct with LVEDP and mLVDP were not sufficiently high to diagnose LVDD in patients with CAD with preserved LVEF. In contrast, gACS-r and gACS-ct showed stronger correlations with LVEDP and mLVDP. These results indicate that an echocardiographic parameter that enables assessment of LA function along both the longitudinal and circumferential axes is necessary for an accurate diagnosis of elevated LVEDP or mLVDP through LA strain. We have shown that the integrated parameters, such as GLAS-r and GLAS-ct, could together be used to diagnose elevated LVEDP and mLVDP with sufficient accuracy in this patient population.
In a multicenter study of 322 patients (median LVEF was 55%) with cardiovascular disease of different etiologies, including CAD, Inoue et al demonstrated that 2D-STE-derived LA longitudinal reservoir and pump strains, as well as the other established echocardiographic parameters, could not assess LV filling pressure with sufficient accuracy in patients with preserved LVEF.18
Interestingly, in patients with preserved LVEF, LV-GLS was also demonstrated to be the strongest determinant of LA longitudinal reservoir strain than the other determinants, LV filling pressure and LAVI. These results indicate that the augmenting effect of LV-GLS on LA longitudinal reservoir strain becomes stronger with increasing LVEF, but this incremental strain may disturb the determination of LA longitudinal reservoir strain by LV filling pressure. These findings are consistent with our inference that it may be preferable to use LA circumferential strain, perpendicular to mitral annular motion during systole, to estimate LV filling pressure, especially in patients with preserved LVEF.
In the present study, LA circumferential strain reflected the elevated LVEDP (mLVDP) more tightly than LA longitudinal strain. This means that LA circumferential strain could tightly reflect the LA volume change than LA longitudinal strain. It is well acknowledged that LVEF directly affects LA longitudinal strain; however, it also affects LA circumferential strain indirectly via LA volume changes.15,18
The conventional 2D-STE technique cannot be used to assess LA circumferential strain. Therefore, we believe that 3D-STE-derived GLASs, which include the integrated information of LA circumferential direction and LA longitudinal direction, are promising parameters to evaluate LV filling pressure and LVEDP.
Clinical Implications
In our study cohort, the prevalence of CAD, PMI, hypertension, and diabetes was 92%, 36%, 68%, and 40%, respectively. These conditions have been recognized as significant risk factors leading to the future development of heart failure. If predicted LV filling pressure is high in these subjects based on 3D-STE-derived GLASs, the event rate due to heart failure may be high, as observed in compensated heart failure patients with high LV filling pressure.19
Further studies are needed in this respect.
Study Limitations
The small number and specific type of patients may have influenced our results. In the present study we enrolled patients with suspected stable CAD and some atherosclerotic risk factors, because LV pressure measurement using a catheter-tipped micromanometer could not be performed in patients with an apparent or decompensated heart failure. We excluded patients with frequent ventricular arrhythmias or supraventricular arrhythmias, including atrial fibrillation, because measurements of GLAS require sufficient temporal resolution and quality of the 3D image to set sampling lines along the LA endocardial surface border and to trace it through a cardiac cycle. Therefore, we enrolled patients with sinus rhythm and obtained 3D images constructed from 6 wedge-shaped subvolumes, and the echocardiographic examinations were performed just before rather than simultaneously with cardiac catheterization. We could identify an elevated LVEDP (mLVDP) using the GLASs, even in patients with suspected CAD and/or at a high risk of heart failure, most of whom had preserved LVEF and normal-range LAVI. In patients with apparent heart failure and an elevated LVEDP (mLVDP), a considerable decrease in the LA area strain should be expected due to the deterioration of LA function.3,18
Thus, we believe that the findings of the present study could possibly be applied to patients with heart failure. In patients with compensated or chronic heart failure, this methodology would be useful for the management of heart failure patients with predicted LVEDP (LVDP).
Conclusions
The results of this study indicate that elevations in mLVDP and LVEDP are important determinants of LA wall strain. The GLAS measured with 3D-STE could be a useful parameter for the non-invasive diagnosis of elevated mLVDP and LVEDP in patients with suspected CAD or with some atherosclerotic diseases, and even in patients with preserved LVEF and without chronic heart failure.
Sources of Funding
This study did not receive any specific funding.
Disclosures
Y.S. is a member of
Circulation Reports’ Editorial Team. The remaining authors have no conflicts of interest to declare.
IRB Information
The Internal Review Board of Nagoya City University Graduate School of Medical Sciences approved this clinical investigation (Reference no. 60-19-0037).
Data Availability
The deidentified participant data will not be shared.
Supplementary Files
Please find supplementary file(s);
http://dx.doi.org/10.1253/circrep.CR-21-0083
References
- 1.
Nagueh SF, Smiseth OA, Appleton CP, Byrd BF 3rd, Dokainish H, Edvardsen T, et al. Recommendations for the evaluation of left ventricular diastolic function by echocardiography: An update from the American Society of Echocardiography and the European Association of Cardiovascular Imaging. J Am Soc Echocardiogr 2016; 29: 277–314.
- 2.
Suga H. Importance of atrial compliance in cardiac performance. Circ Res 1974; 35: 39–43.
- 3.
Wakami K, Ohte N, Asada K, Fukuta H, Goto T, Mukai S, et al. Correlation between left ventricular end-diastolic pressure and peak left atrial wall strain during left ventricular systole. J Am Soc Echocardiogr 2009; 22: 847–851.
- 4.
Cameli M, Lisi M, Mondillo S, Padeletti M, Ballo P, Tsioulpas C, et al. Left atrial longitudinal strain by speckle tracking echocardiography correlates well with left ventricular filling pressures in patients with heart failure. Cardiovasc Ultrasound 2010; 8: 14.
- 5.
Singh A, Medvedofsky D, Mediratta A, Balaney B, Kruse E, Ciszek B, et al. Peak left atrial strain as a single measure for the non-invasive assessment of left ventricular filling pressures. Int J Cardiovasc Imaging 2019; 35: 23–32.
- 6.
Mondillo S, Cameli M, Caputo ML, Lisi M, Palmerini E, Padeletti M, et al. Early detection of left atrial strain abnormalities by speckle-tracking in hypertensive and diabetic patients with normal left atrial size. J Am Soc Echocardiogr 2011; 24: 898–908.
- 7.
Kleijn SA, Aly MF, Terwee CB, van Rossum AC, Kamp O. Three-dimensional speckle tracking echocardiography for automatic assessment of global and regional left ventricular function based on area strain. J Am Soc Echocardiogr 2011; 24: 314–321.
- 8.
Mochizuki A, Yuda S, Oi Y, Kawamukai M, Nishida J, Kouzu H, et al. Assessment of left atrial deformation and synchrony by three-dimensional speckle-tracking echocardiography: Comparative studies in healthy subjects and patients with atrial fibrillation. J Am Soc Echocardiogr 2013; 26: 165–174.
- 9.
Lang RM, Badano LP, Mor-Avi V, Afilalo J, Armstrong A, Ernande L, et al. Recommendations for cardiac chamber quantification by echocardiography in adults: An update from the American Society of Echocardiography and the European Association of Cardiovascular Imaging. J Am Soc Echocardiogr 2015; 28: 1–39.e14.
- 10.
Nagueh SF, Middleton KJ, Kopelen HA, Zoghbi WA, Quinones MA. Doppler tissue imaging: A noninvasive technique for evaluation of left ventricular relaxation and estimation of filling pressures. J Am Coll Cardiol 1997; 30: 1527–1533.
- 11.
Ommen SR, Nishimura RA, Appleton CP, Miller FA, Oh JK, Redfield MM, et al. Clinical utility of Doppler echocardiography and tissue Doppler imaging in the estimation of left ventricular filling pressures: A comparative simultaneous Doppler-catheterization study. Circulation 2000; 102: 1788–1794.
- 12.
Badano LP, Kolias TJ, Muraru D, Abraham TP, Aurigemma G, Edvardsen T, et al. Standardization of left atrial, right ventricular, and right atrial deformation imaging using two-dimensional speckle tracking echocardiography: A consensus document of the EACVI/ASE/Industry Task Force to standardize deformation imaging. Eur Heart J Cardiovasc Imaging 2018; 19: 591–600.
- 13.
Yamamoto K, Nishimura RA, Redfield MM. Assessment of mean left atrial pressure from the left ventricular pressure tracing in patients with cardiomyopathies. Am J Cardiol 1996; 78: 107–110.
- 14.
Paulus WJ, Tschöpe C, Sanderson JE, Rusconi C, Flachskampf FA, Rademakers FE, et al. How to diagnose diastolic heart failure: A consensus statement on the diagnosis of heart failure with normal left ventricular ejection fraction by the Heart Failure and Echocardiography Associations of the European Society of Cardiology. Eur Heart J 2007; 28: 2539–2550.
- 15.
Barbier P, Solomon SB, Schiller NB, Glantz SA. Left atrial relaxation and left ventricular systolic function determine left atrial reservoir function. Circulation 1999; 100: 427–436.
- 16.
Bauer F, Jones M, Qin JX, Castro P, Asada J, Sitges M, et al. Quantitative analysis of left atrial function during left ventricular ischemia with and without left atrial ischemia: A real-time 3-dimensional echocardiographic study. J Am Soc Echocardiogr 2005; 18: 795–801.
- 17.
Mandoli GE, Pastore MC, Benfari G, Bisleri G, Maccherini M, Lisi G, et al. Left atrial strain as a pre-operative prognostic marker for patients with severe mitral regurgitation. Int J Cardiol 2021; 324: 139–145.
- 18.
Inoue K, Khan FH, Remme EW, Ohte N, García-Izquierdo E, Chetrit M, et al. Determinants of left atrial reservoir and pump strain and use of atrial strain for evaluation of left ventricular filling pressure. Eur Heart J Cardiovasc Imaging, doi:10.1093/ehjci/jeaa415.
- 19.
Nijland F, Kamp O, Karreman AJ, van Eenige MJ, Visser CA. Prognostic implications of restrictive left ventricular filling in acute myocardial infarction: A serial Doppler echocardiographic study. J Am Coll Cardiol 1997; 30: 1618–1624.