Abstract
Background:
The incidence of new-onset atrial high-rate episode (AHRE) is higher among patients with cardiac implantable electronic devices (CIEDs) than in the general population. We sought to elucidate the clinical factors associated with AHRE in CIED patients, including P-wave dispersion (PWD) in sinus rhythm.
Methods and Results:
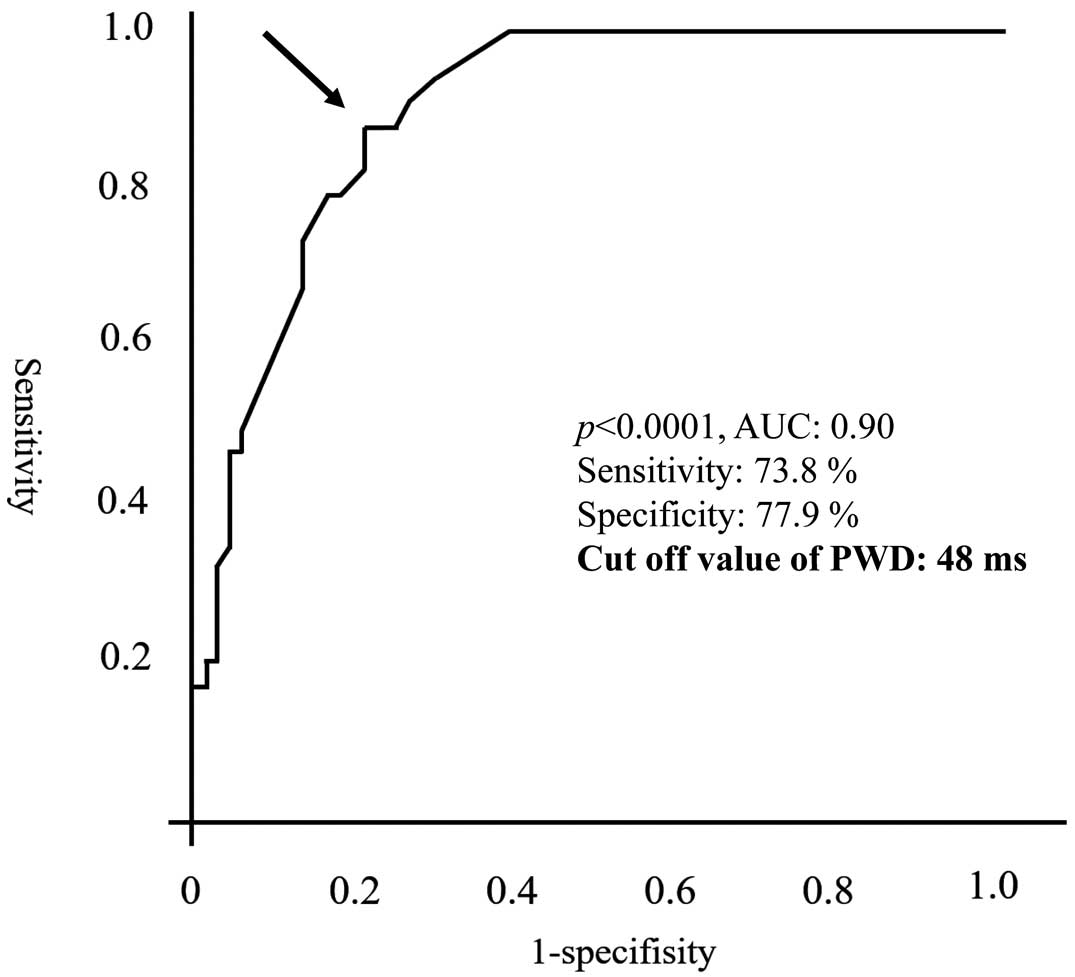
In all, 101 patients with CIEDs newly implanted between 2010 and 2014 were included in the study. PWD was measured at the time of device implantation via a body-surface electrocardiogram. AHRE was defined as any episode of sustained atrial tachyarrhythmia (>170 beats/min) recorded in the device’s memory. Patients were divided into an AHRE (n=34) and non-AHRE (n=67) group based on the presence or absence of AHRE within 1 year of device implantation and compared. Mean (±SD) patient age was 75±11 years. A greater incidence of sick sinus syndrome (P=0.05) and longer PWD (62.6±13.1 vs. 38.2±13.9 ms; P<0.0001) were apparent in the AHRE than non-AHRE group. Multivariate analysis revealed that PWD was an independent predictor of new-onset AHRE (odds ratio 1.11; 95% confidence interval 1.06–1.17; P<0.0001). In logistic regression analysis, receiver-operating characteristic curve analysis (area under the curve 0.90; P<0.001) suggested the best cut-off value for PWD was 48 mm (sensitivity 73.8%, specificity 77.9%).
Conclusions:
PWD is a simple but feasible predictor of new-onset AHRE in patients with CIEDs.
Atrial fibrillation (AF), the most frequently encountered clinical cardiac arrhythmia, is associated with increased mortality and morbidity rates, largely due to thromboembolic complications and heart failure. The clinical detection of AF in the early phase is important to avoid such events, but is not always easy, particularly in cases of asymptomatic AF. Although repeated electrocardiogram (ECG) recording or 24-h ambulatory ECG monitoring are considered useful in detecting AF in the early phase, their sensitivities as detection tools are totally limited.1
Recently, continuous rhythm monitoring with cardiac implantable electronic devices (CIEDs) has been used to diagnose brief episodes of arrhythmia, including paroxysmal AF, which are recorded as atrial high-rate episodes (AHREs), particularly in the absence of clinical evidence of AF.1
Using this approach, new-onset atrial tachyarrhythmia/AF can be diagnosed earlier in patients with than without CIEDs.
Previous reports have demonstrated that a prior history of heart failure, the presence of sick sinus syndrome (SSS), and a large left atrial volume index (LAVI) are independent predictors of new-onset AHRE in patients with CIEDs.2
Furthermore, new-onset AHRE in patients with CIEDs has been linked to an increased risk of stroke, systemic embolism, and worsening heart failure.3–5
As such, predicting new-onset AHRE following CIED implantation in patients without a history of AF is key to obtaining good patient outcomes.
P-wave dispersion (PWD), a well-known ECG parameter and predictor of AF, is defined as the difference between the maximum and the minimum P-wave durations detected on the body surface 12-lead ECG.6,7
Previous studies have suggested that a longer PWD may be associated with AF occurrence after cardiac surgery, AF recurrence after conversion, and the appearance of the first AF episode and/or paroxysmal AF.7–10
Furthermore, it was reported that PWD could be a sensitive and specific ECG marker for the risk of AF with a cut-off value of 40 ms for the identification of patients with a history of paroxysmal AF.6
However, the connection between PWD and new-onset AHRE in patients with CIEDs remains largely unexamined. Therefore, in the present study we sought to elucidate clinical factors, including PWD, associated with silent AHRE in the CIED patient population.
Methods
Study Population
The institutional ethics review board at the Kitasato University School of Medicine approved retrospective review of the data used in this study (Approval no. B18-195).
The study population consisted of 258 consecutive patients newly implanted with CIEDs between January 2010 and December 2014 at Kitasato University School of Medicine. For the study purpose of monitoring for AHREs, patients without atrial leads were excluded. The CIEDs used in this study consisted of permanent dual-chamber (DDD) pacemakers for SSS or atrioventricular block. Patients with implantable cardioverter-defibrillators and cardiac resynchronization therapy devices were excluded because these patients are believed to be at higher risk of cardiac events. Each device was implanted in accordance with the Class I–IIa indications of the current American Heart Association and Japanese Circulation Society guidelines.11,12
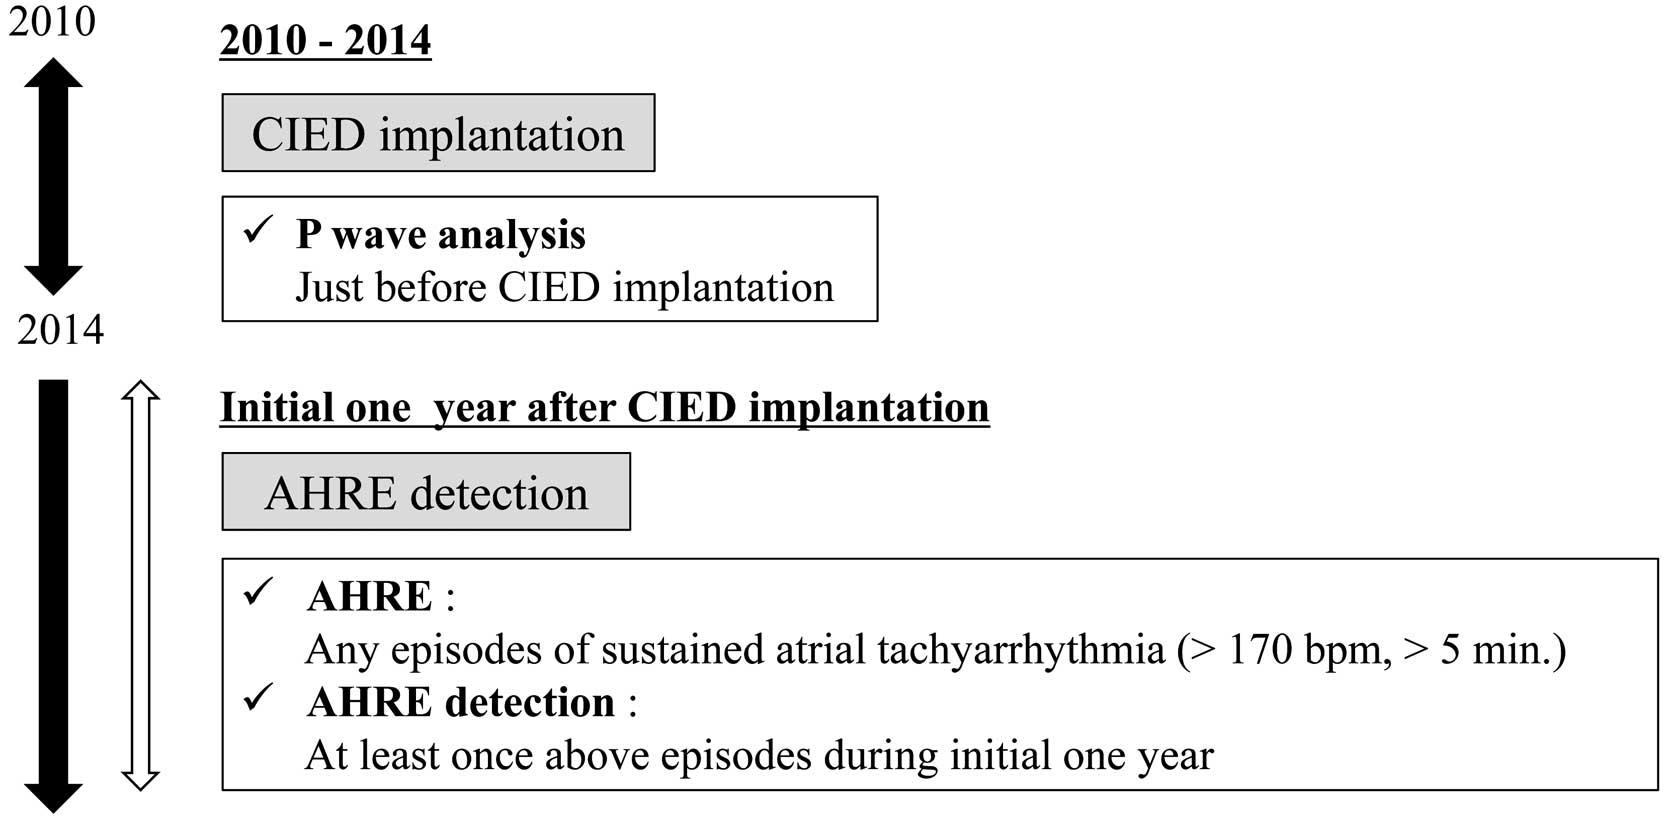
Patients with idiopathic cardiomyopathy, end-stage renal disease (with hemodialysis), previously documented AF and/or without 12-lead ECG recordings made just prior to DDD pacemaker implantation were also excluded from the study. The absence of AF history was confirmed by repeated body surface ECG and/or Holter ECG. Finally, a total of 101 patients were included in the study analysis (Figure 1).

All procedures were performed in accordance with the Declaration of Helsinki and the ethical standards of the responsible committee on human experimentation.
Data Collection and AHRE Detection
All patients underwent baseline clinical history taking, 12-lead ECG recording, chest X-ray imaging, transthoracic echocardiography, and blood sampling as basic examinations prior to DDD pacemaker implantation. All the CIEDs implanted had the capacity to record AHREs; 32 devices were manufactured by St. Jude Medical (St. Paul, MN, USA), 25 devices were manufactured by Medtronic (Minneapolis, MN, USA), 18 devices were manufactured by Biotronik (Berlin, Germany), 15 devices were manufactured by Ela Medical (Montrouge, France), and 11 devices were manufactured by Boston Scientific (Marlborough, MA, USA). All patients were assessed at 6-month intervals after the initial device check performed 1 week after implantation. Clinical data, including the presence of AHREs during the preceding 6-month period, were collected at each follow-up visit via device interrogation. An AHRE was defined as any episode of sustained atrial tachyarrhythmia (>5 min and >170 beats/min) detected through the atrial lead (Figure 2).13
The atrial sensing threshold was set at 0.5 mV. To detect the existence of AHRE, a cut-off of ≥5 min was used in this study to exclude the overdiagnosis of various atrial signals, such as far-field oversensing and/or sinus tachycardia.13
Other atrial noises were excluded by checking the intracardiac ECGs stored in the pacemakers as much as possible.3
The study population was divided into 2 groups, those with and without new-onset AHRE during the initial 1 year after CIED implantation.
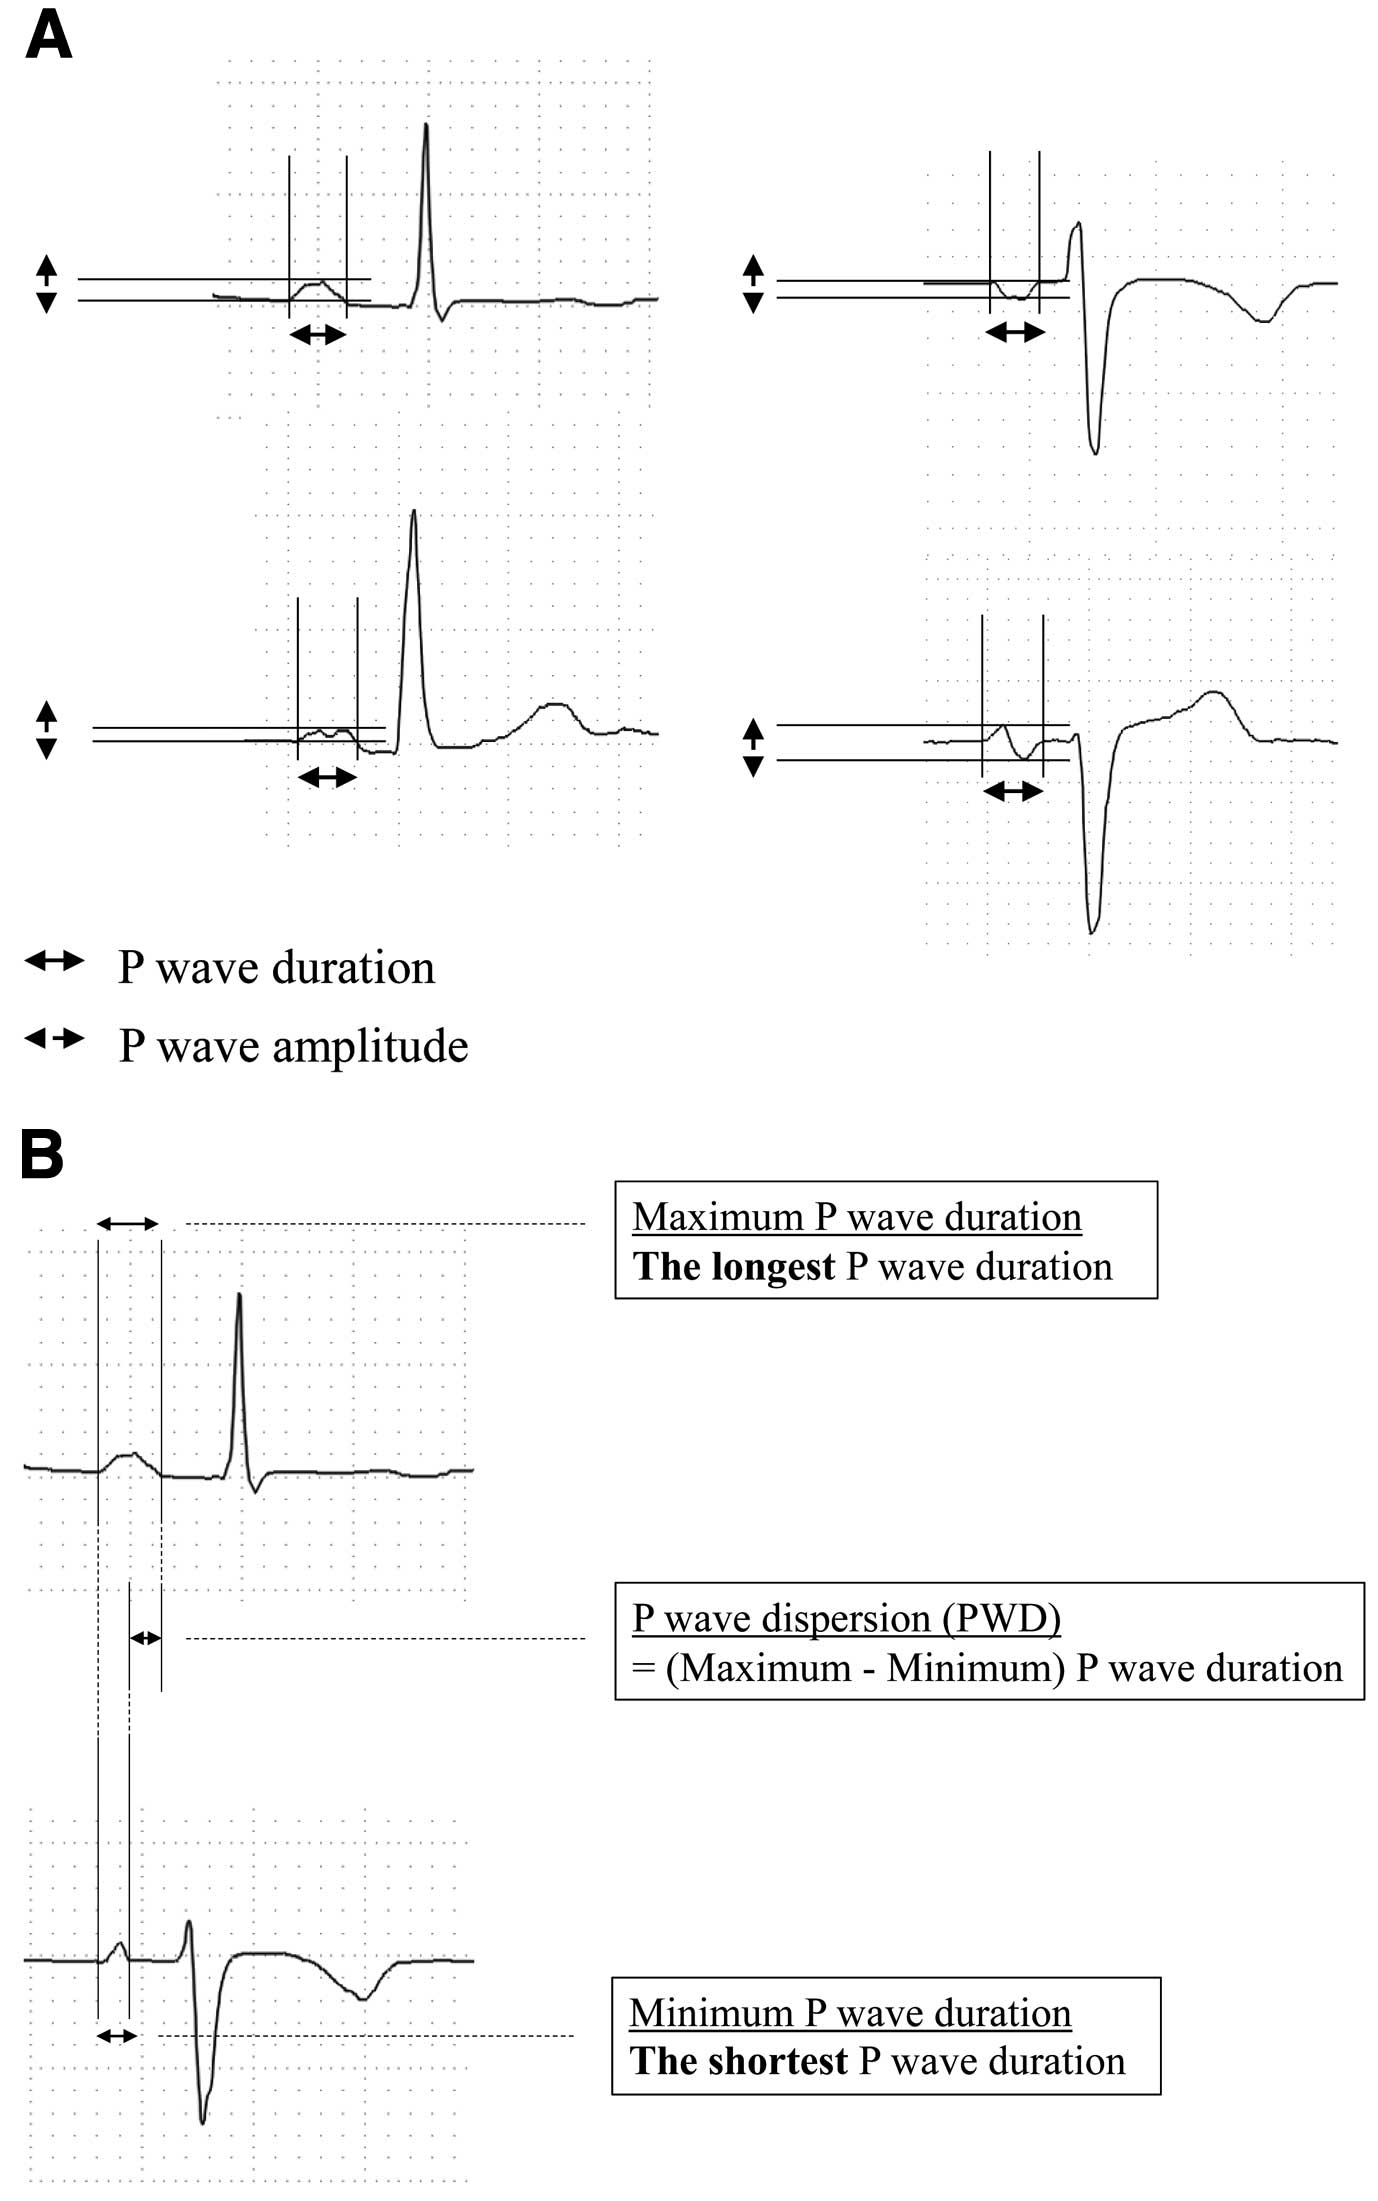
In all patients, the body surface 12-lead ECG was recorded at a paper speed of 25 mm/s with a calibration of 1 mV=10 mm and analyzed thoroughly for the calculation of the maximum and minimum P-wave amplitude, maximum and minimum P-wave duration, and PWD. For P-wave analysis, the most recent ECG recording of sinus rhythm recorded just prior to CIED implantation was used (Figure 2). P-Wave duration and PWD were manually measured in all leads, with an ECG magnifier being used to mark the P-wave onset and offset. The P-wave duration was defined as the time from the onset to the end of the P-wave deflection. The onset of the P-wave was considered to be the junction between the isoelectric line and the first visible upward or downward slope of the trace, whereas the return of the trace to its isoelectric line was considered to be the end of the P-wave. When a P-wave exhibited a biphasic form, the latter negative phase was also included in the P-wave duration (Figure 3A). The P-wave amplitude was measured as the height of the peak of positive deflection or the depth of the bottom of negative deflection from the isoelectric line of the onset point.14–17
In the case of a biphasic P-wave, the P-wave amplitude was measured as the difference between the positive peak and negative bottom of the recording (Figure 3A). For P-wave analysis, durations and amplitudes of P-waves in leads II and V1 and the maximum P-wave duration in all 12 leads were used as the parameters of interest. Furthermore, PWD was calculated as the difference between the maximum and minimum P-wave durations in milliseconds within the same 12-channel ECG (Figure 3B).8,18
Data were analyzed using JMP software (SAS Institute, Cary, NC, USA). Continuous variables were compared using the independent t-test or the Mann-Whitney U test, whereas categorical data were analyzed using the Chi-squared test. A binary logistic regression approach was used to evaluate independent predictive factors and to create an odds risk of the occurrence of AHRE. A receiver operating characteristic (ROC) curve was used to analyze the diagnostic accuracy, sensitivity, specificity, and predictive value of PWD for new-onset AHRE. For all comparisons, 2-sided P<0.05 was considered to be statistically significant.
Results
Comparison of Basic Characteristics
Of the 101 patients, 34 exhibited AHREs during the initial 1 year after CIED implantation and were subsequently allocated to the AHRE group, whereas the remaining 67 were allocated to the non-AHRE group.
Table 1
summarizes the basic clinical characteristics of the patients before CIED implantation. The significance of differences between the AHRE and non-AHRE groups was determined. Although the subpopulation of SSS patients was larger in the AHRE than non-AHRE group (P=0.05), there were no significant differences in any other parameters between the 2 groups.
Table 1.
Baseline Characteristics in Patients With and Without AHREs
| |
All patients
(n=101) |
AHRE
(n=34) |
Non-AHRE
(n=67) |
P value |
| Age (years) |
75±11 |
76±10 |
75±11 |
0.64 |
| Male sex |
51 (51) |
14 (41) |
37 (55) |
0.18 |
| Diagnosis |
| SSS |
40 (39) |
18 (53) |
22 (33) |
|
| AVB |
61 (61) |
16 (48) |
45 (67) |
|
| Past medical history |
| Cerebral infarction |
4 (4) |
2 (6) |
2 (3) |
0.49 |
| CHF |
17 (17) |
6 (18) |
11 (16) |
0.87 |
| IHD |
13 (12) |
5 (15) |
8 (12) |
0.69 |
| HT |
71 (70) |
25 (74) |
46 (69) |
0.61 |
| Prescription |
| β-blocker |
11 (11) |
3 (8.8) |
8 (12) |
0.63 |
| RASI |
54 (54) |
20 (59) |
34 (51) |
0.44 |
| Pacing (%) |
| Atrial pacing |
41±34 |
46±33 |
39±34 |
0.29 |
| Ventricular pacing |
64±42 |
63±42 |
65±43 |
0.66 |
| Laboratory data |
| Cr (mg/dL) |
1.1±0.5 |
1.2±0.7 |
0.9±0.3 |
0.12 |
| LDL-C (mg/dL) |
112±34 |
107±29 |
115±37 |
0.31 |
| Echocardiogram |
| LAD (mm) |
39±6 |
40±5 |
39±6 |
0.17 |
| LVEF (%) |
66±7 |
68±8 |
66±6 |
0.09 |
| MR (III–IV) |
3 (4) |
0 (0) |
3 (5) |
0.12 |
| TR (III–IV) |
6 (7) |
3 (11) |
3 (5) |
0.34 |
Unless indicated otherwise, data are presented as the mean±SD or n (%). AHRE, atrial high-rate episode; AVB, atrioventricular block; CHF, chronic heart failure; Cr, creatinine; HT, hypertension; IHD, ischemic heart disease; LAD, left atrium dimensions; LDL-C, low-density lipoprotein cholesterol; LVDd, left ventricular diastolic dimensions; MR, mitral regurgitation; RASI, renin-angiotensin system inhibitor; SSS, sick sinus syndrome; TR, tricuspid regurgitation.
Findings of the P-wave analysis are summarized in
Table 2. In the univariate analysis, the P-wave durations in leads II and V1 were longer in the AHRE than non-AHRE group (lead II, 118±24 vs. 109±22 ms, respectively [P=0.04]; lead V1, 111±26 vs. 95±20 ms, respectively [P=0.005]) and the maximum P-wave duration was similarly longer in the AHRE than non-AHRE group (132±22 vs. 117±13, respectively; P=0.0009). The PWD was also longer in the AHRE than non-AHRE group (63±13 vs. 38±14, respectively; P=0.001;
Table 2).
Table 2.
Analysis of P-Waves in Patients With and Without AHREs
| |
All patients
(n=101) |
AHRE
(n=34) |
Non-AHRE
(n=67) |
P value |
| P-wave duration (ms) |
| Maximum |
122±18 |
132±22 |
117±13 |
0.0009* |
| Minimum |
76±18 |
69±20 |
79±16 |
0.02* |
| PWD (ms) |
46±18 |
63±13 |
38±14 |
<0.0001* |
| Maximum P-wave amplitude (mV) |
0.15±0.09 |
0.17±0.15 |
0.14±0.05 |
0.4 |
| Lead V1 |
| P-wave amplitude (mV) |
0.11±0.05 |
0.11±0.06 |
0.11±0.05 |
0.8 |
| P-wave duration (ms) |
100±23 |
111±26 |
95±20 |
0.005* |
| Lead II |
| P-wave amplitude (mV) |
0.13±0.06 |
0.12±0.07 |
0.13±0.05 |
0.2 |
| P-wave duration (ms) |
112±23 |
118±24 |
109±22 |
0.04* |
Unless indicated otherwise, data are presented as the mean±SD or n (%). *Statistical significance. AHRE, atrial high-rate episode; PWD, P-wave dispersion.
Logistic regression analysis revealed a correlation between PWD and new-onset AHRE with a 11% relative risk increase for each millisecond of PWD (hazard ratio [HR] 1.11; 95% confidence interval [CI] 1.06–1.17; P<0.0001;
Table 3), but not so for SSS (HR 1.6; 95% CI 0.44–5.8; P=0.48) or left atrium diameter (HR 0.94; 95% CI 0.84–1.1; P=0.26). The maximum and minimum P-wave durations were not included in this analysis because they were considered to be strong confounding factors of PWD. The cut-off points of PWD for the prediction of new-onset AHRE were determined from the ROC curve of the logistic regression analysis (Figure 4). The most powerful cut-off point was 48 ms, with a sensitivity of 0.738 and a specificity of 0.779, for PWD (area under the curve [AUC] 0.90; P<0.0001).
Table 3.
Independent Predictors for New Appearance of AHREs Following Implantation of Cardiac Implantable Electronic Devices
| |
Univariate analysis |
Multivariate analysis |
| HR (95% CI) |
P value |
HR (95% CI) |
P value |
| SSS |
2.30 (0.99–5.36) |
0.05 |
1.6 (0.44–5.80) |
0.48 |
| LAD |
1.05 (0.96–1.14) |
0.17 |
0.94 (0.84–1.10) |
0.26 |
| PWD |
1.13 (1.08–1.18) |
<0.0001* |
1.11 (1.06–1.17) |
<0.0001* |
*Statistical significance. CI, confidence interval; HR, hazard ratio. Other abbreviations as in Tables 1,2.
Discussion
In the present study we demonstrated that the PWD, as measured just before CIED implantation, was associated with the appearance of new-onset AHRE in the first year after CIED implantation. Specifically, longer PWD was an independent predictor of the appearance of new-onset AHRE in the multivariate analysis. The cut-off value of PWD of 48 ms determined by ROC curve analysis (AUC 0.90) achieved considerably high sensitivity and specificity values of 73.8% and 77.9%, respectively.
In this study we detected a considerable number of patients with new-onset AHRE in the relatively early phase after CIED implantation. In prior studies, AHRE was defined as an episode lasting at least 5–6 min with an atrial rate of >170–190 beats/min,1,19,20
and we used a similar definition in the present study. By using such criteria, the overdetection of AHREs due to various atrial noise signals could be avoided as much as possible. In this study AHREs were detected in 34% of patients, which was within the reported range of incidence of such detections over a 2-year observation period (i.e., 20–60%).21–23
There are some reports regarding predictors of AHREs following CIED implantation. Prior heart failure and a large LAVI were reported to be major risk factors for the appearance of new-onset AHREs in CIED patients.2
The ASSERT study and the Canadian Trial of Physiologic Pacing also demonstrated that sinus node dysfunction may be correlated with an increased risk of AHRE.5,24
The clinical association of these diseases has been recognized for a long time, suggesting that these diseases are associated with atrial structural and electrical remodeling.25
In the present study, although SSS was more prevalent in the AHRE than non-AHRE group, other parameters, including prior heart failure and LAVI, did not differ significantly between the 2 groups, possibly because we excluded patients with serious structural heart disease, which may cause atrial structural remodeling as the substrate for AHRE. Sinus node dysfunction creates an electrophysiological substrate that facilitates AF initiation and perpetuation.25
Theoretically, prolonged PWD reflects the non-homogeneous propagation of atrial impulses and/or the prolongation of atrial conduction time, which may participate in the construction of an arrhythmogenic substrate of AF. Atrial conduction disturbances can also be revealed by realizing the conduction delay during sinus rhythm, which can be observed as prolongation of PWD and P-wave duration. Because such a prolongation in PWD was observed even just before CIED implantation, it is suspected that atrial electrical remodeling had already progressed in at least some patients before CIED implantation in the present study. Such electrical changes may be a precursor for the appearance of new-onset AHRE at least in patients with CIEDs.
In a recent study, a PWD value of 40 ms was considered to be prolonged and was correlated with physiological and/or pathological dysfunction.26
A PWD of >40 ms indicates the presence of heterogeneous electrical activity in different regions of the atrium that may cause atrial tachyarrhythmias. Yoshizawa et al suggested that new-onset AF could be predicted by a PWD of >50 ms, with a sensitivity of 69.1% and a specificity of 88.2%.8
Perzanowski et al contended that a PWD value of ≥80 ms was an independent predictor for AF recurrence after cardioversion.10
Similarly, high PWD values were observed in patients with recurrent transient ischemic attacks, suggesting that a PWD of >40 ms may be linked to an underlying silent paroxysmal AF as the possible cause of ischemia recurrence. Based on these reports, the prediction of new-onset AHRE using a PWD cut-off value of 48 mm in this study should be considered as reasonable.
In a recent review, Pérez-Riera et al listed some possible scenarios in which the PWD may be prolonged and concluded that PWD is an important and easy-to-measure parameter that indicates a greater tendency for the appearance of supraventricular arrhythmias, particularly paroxysmal AF.26
Notably, the results in the present study match well to one of the possible scenarios listed by Pérez-Riera et al.26
Of course, there should be some difference apparent between clinical AF and device-detected AHRE. However, because AHRE has been reported to be associated with increased risks of stroke, systemic embolism, and worsening heart failure, the prediction of new-onset AHRE through PWD evaluation should be useful in managing patients with CIED.2,5,27
Study Limitations
This study has several limitations. First, this was a single-center study and the number of patients analyzed was relatively small. Second, atrial undersensing can occur during AHREs, which can lead to either a failure to detect an AHRE or the truncation of a single AHRE into multiple shorter episodes. Moreover, we could not analyze the duration of AHREs in detail as a device parameter in this study because its extraction from the device record was difficult. Third, there was a slight configuration difference apparent in AHRE detection because of the different pacemaker manufacturers involved. Fourth, because the measurements of P-waves were based on morphological determinations of P-waves, some errors may have occurred. Finally, because we did not evaluate the correlation between PWD and the future detection of AF, further prospective studies are needed to evaluate the relationship between PWD values and clinical AF in patients with AHRE.
Conclusions
PWD was identified as an independent predictor for the appearance of new-onset AHRE in patients with CIEDs.
Sources of Funding
No financial support from any specific company was received for this study. There was no specific unapproved use of any compound or product.
Disclosures
J.A. is a member of
Circulation Reports’ Editorial Team. The authors declare there is no conflict of interest that could be perceived as prejudicing the impartiality of the research reported herein.
IRB Information
This study was approved by the institutional ethics review board of Kitasato University School of Medicine (Approval no. B18-195).
Data Availability
The deidentified participant data will not be shared.
References
- 1.
Israel CW, Grönefeld G, Ehrlich JR, Li YG, Hohnloser SH. Long-term risk of recurrent atrial fibrillation as documented by an implantable monitoring device: Implications for optimal patient care. J Am Coll Cardiol 2004; 43: 47–52.
- 2.
Kim BS, Chun KJ, Hwang JK, Park SJ, Park KM, Kim JS, et al. Predictors and long-term clinical outcomes of newly developed atrial fibrillation in patients with cardiac implantable electronic devices. Medicine (Baltimore) 2016; 95: e4181.
- 3.
Ogino Y, Ishikawa T, Ishigami T, Matsumoto K, Hosoda J, Iguchi K, et al. Characteristics and prognosis of pacemaker-identified new-onset atrial fibrillation in Japanese people. Circ J 2017; 81: 794–798.
- 4.
Glotzer TV, Daoud EG, Wyse DG, Singer DE, Ezekowitz MD, Hilker C, et al. The relationship between daily atrial tachyarrhythmia burden from implantable device diagnostics and stroke risk: The TRENDS study. Circ Arrhythm Electrophysiol 2009; 2: 474–481.
- 5.
Healey J, Connolly S, Gold M, Israel CW, Gelder IC, Capucci A, et al. Subclinical atrial fibrillation and the risk of stroke. N Engl J Med 2012; 366: 120–129.
- 6.
Dilaveris PE, Gialafos JE. P wave dispersion: A novel predictor of paroxysmal atrial fibrillation. Ann Noninvasive Electrocardiol 2001; 6: 159–165.
- 7.
Lazzeroni D, Parati G, Bini M, Piazza P, Ugolotti PT, Camaiora U, et al. P-wave dispersion predicts atrial fibrillation following cardiac surgery. Int J Cardiol 2016; 203: 131–133.
- 8.
Yoshizawa T, Niwano S, Niwano H, Igarashi T, Fujiishi T, Ishizue T, et al. Prediction of new onset atrial fibrillation through P wave analysis in 12 lead ECG. Int Heart J 2014; 55: 422–427.
- 9.
Dogan A, Avsar A, Ozturk M. P-wave dispersion for predicting maintenance of sinus rhythm after cardioversion of atrial fibrillation. Am J Cardiol 2004; 93: 368–371.
- 10.
Perzanowski C, Ho AT, Jacobson AK. Increased P-wave dispersion predicts recurrent atrial fibrillation after cardioversion. J Electrocardiol 2005; 38: 43–46.
- 11.
Epstein AE, Dimarco JP, Ellenbogen KA, Estes M, Freedman RA, Gettes NAM, et al. 2012 ACCF/AHA/HRS focused update incorporated into the ACCF/AHA/HRS 2008 guidelines for device-based therapy of cardiac rhythm abnormalities. Circulation 2013; 127: e283–e352.
- 12.
Nogami A, Kurita T, Abe H, Ando K, Ishikawa T, Imai K, et al; the JCS/JHRS Joint Working Group. JCS/JHRS 2019 guideline on non-pharmacotherapy of cardiac arrhythmias. Circ J 2021; 85: 1104–1244.
- 13.
Pollak WM, Simmons JD, Interian A, Atapattu SA, Castellanos A, Myerburg RJ, et al. Clinical utility of intraatrial pacemaker stored electrograms to diagnose atrial fibrillation and flutter. Pacing Clin Electrophysiol 2001; 24: 424–429.
- 14.
Aytemir K, Ozer N, Atalar E, Sade E, Aksoyek S, Ovunc K, et al. P wave dispersion on 12-lead electrocardiography in patients with paroxysmal atrial fibrillation. Pacing Clin Electrophysiol 2000; 23: 1109–1112.
- 15.
Andrikopoulos GK, Dilaveris PE, Richter DJ. Increased variance of P wave duration on the electrocardiogram distinguishes patient with idiopathic paroxysmal atrial fibrillation. Pacing Clin Electrophysiol 2000; 23: 1127–1132.
- 16.
Dilaveris PE, Gialafos E, Sideris S. Simple electrocardiographic markers for the prediction of paroxysmal idiopathic atrial fibrillation. Am Heart J 1998; 135: 73–78.
- 17.
Chang CM, Lee SH, Lu MJ, Lin CH, Chao HH, Cheng JJ, et al. The role of P wave in prediction of atrial fibrillation after coronary artery surgery. Int J Cardiol 1999; 68: 303–308.
- 18.
Yamada T, Fukunami M, Shimonagata T, Kumagai K, Sanada S, Ogita H, et al. Dispersion of signal-averaged P wave duration on precordial body surface in patients with paroxysmal atrial fibrillation. Eur Heart J 1999; 20: 211–220.
- 19.
Wang TJ, Larson MG, Levy D, Vansan RS, Leip EP, Wolf PA, et al. Temporal relations of atrial fibrillation and congestive heart failure and their joint influence on mortality: The Framingham Heart Study. Circulation 2003; 107: 2920–2925.
- 20.
Glotzer TV, Hellkamp AS, Zimmerman J, Sweeney MO, Yee R, Marinchak R, et al. Atrial high rate episodes detected by pacemaker diagnostics predict death and stroke: Report of the atrial diagnostics ancillary study of the MOde Selection Trial (MOST). Circulation 2003; 107: 1614–1619.
- 21.
Cheung JIMW, Keating RJ, Stein KM, Markowitz SM, Iwai S, Shan BK, et al. Newly detected atrial fibrillation following dual chamber pacemaker implantation. J Cardiovasc Electrophysiol 2006; 17: 1323–1328.
- 22.
Orlov MV, Ghali JK, Araghi-Niknam M, Sherfesee L, Sahr D, Hettrick DA, et al. Asymptomatic atrial fibrillation in pacemaker recipients: Incidence, progression, and determinants based on the atrial high rate trial. Pacing Clin Electrophysiol 2007; 30: 404–411.
- 23.
Radeljić V, Pavlović N, Manola Š, Delic-Brkljacic D, Pintaric H, Dubravko P. Incidence and predictors of asymptomatic atrial fibrillation in patients older than 70 years with complete atrioventricular block and dual chamber pacemaker implantation. Croat Med J 2011; 52: 61–67.
- 24.
Skanes AC, Krahn AD, Yee R, Klein GJ, Connolly SJ, Kerr CR, et al. Progression to chronic atrial fibrillation after pacing: The Canadian Trial of Physiologic Pacing. J Am Coll Cardiol 2001; 38: 167–172.
- 25.
Li G, Liu E, Liu T, Wang J, Dai J, Xu G, et al. Atrial electrical remodeling in a canine model of sinus node dysfunction. Int J Cardiol 2011; 146: 32–36.
- 26.
Pérez-Riera AR, de Abreu LC, Barbosa-Barros R, Grindler J, Fernandes-Cardoso A, Baranchuk A. P-wave dispersion: An update. Indian Pacing Electrophysiol J 2016; 16: 126–133.
- 27.
Nishinarita R, Niwano S, Fukaya H, Oikawa J, Nabeta T, Matsuura G, et al. Burden of implanted-device-detected atrial high-rate episode is associated with future heart failure events: Clinical significance of asymptomatic atrial fibrillation in patients with implantable cardiac electronic devices. Circ J 2019; 83: 736–742.