Abstract
Background:
Body mass index (BMI) and the waist-to-height ratio (WHtR) are widely used anthropometric indices of obesity to predict cardiovascular risks. However, the usefulness of combining WHtR and BMI values to predict hypertension risk by sex has not been well elucidated.
Methods and Results:
This cohort study enrolled 45,921 participants (mean [±SD] age 53.8±10.5 years; 47.0% men) without hypertension from among those undergoing annual health checkups. Participants were divided into 4 categories based on median BMI and WHtR values, and the 5-year incidence of hypertension was assessed for both sexes using logistic regression analysis. Mean (±SD) BMI and WHtR values were 23.5±3.1 kg/m2
and 0.50±0.05, respectively, in men and 22.4±3.3 kg/m2
and 0.53±0.06, respectively, in women. Among the women, those with high BMI and low WHtR had an increased risk of hypertension compared with those with low BMI and low WHtR (odds ratio [OR] 1.37, P<0.001); however, the same result was not found in men (OR 1.14, P=0.080). In both sexes, the incidence of hypertension was higher among participants with low BMI and high WHtR than among those with low BMI and low WHtR (men: OR 1.26, P<0.001; women: OR 1.15, P=0.048).
Conclusions:
Using WHtR and BMI together provides a better hypertension risk assessment. Among men, those with a high BMI had no increased hypertension risk when WHtR was low.
Hypertension is one of the main risk factors for cardiovascular diseases and has high global prevalence, morbidity, and mortality.1,2
Thus, it is important to explore methods for primary prevention to reduce incident hypertension in the general population. Epidemiological studies have shown that hypertension is strongly associated with obesity; risk estimates suggest that 75% of hypertension is attributable to obesity.3
Imaging modalities such as magnetic resonance imaging and computed tomography are the gold standard for assessing body fat composition; however, anthropometric measurements are an easy method for primary screening of obesity and the risk of hypertension in research and clinical settings.4
The World Health Organization (WHO) has used body mass index (BMI) and waist circumference (WC) values to evaluate obesity, even though the standards do not apply to all ethnic groups and may underestimate the magnitude of the obesity epidemic, specifically in Asians.4,5
BMI is unable to differentiate between fat-free mass and fat mass, and WC is limited by its isolation of height; there is strong evidence of an inverse relationship between height and health risks.6,7
In addition, WC has multiple ethnic and sex-specific thresholds.8,9
The waist-to-height ratio (WHtR) has been recommended in recent studies as a better tool for the evaluation of body fat distribution and the risk of cardiovascular disease than BMI and WC, with a universal boundary of 0.5.10,11
Studies and guidelines differ in recommendations regarding the best index to clinically measure adiposity; however, BMI, WC, and WHtR are all associated with a risk of hypertension and have shown similarities in strength across different sexes and races.12,13
Meanwhile, some studies have shown that WHtR is a better index for predicting future hypertension.14
Sex dimorphism in body fat distribution has been elaborated in previous studies15,16
using imaging techniques and obesity indices to indicate that the pattern of fat distribution is more crucial than the degree of fat in determining cardiometabolic risk.
Previous studies have relied predominantly on the separate association of obesity indices with the risk of hypertension, and very few have examined whether the combination of measurements for the general distribution of body fat, measured by BMI, and the central distribution of body fat, measured by the WHtR, can contribute to better prediction of hypertension. A few robust studies have suggested that among BMI groups, participants with a high WC have an overall increased risk of adverse health outcomes compared with those with a normal WC.17,18
Furthermore, Pischon et al investigated the association between BMI, WC, and the risk of death among 359,387 adults from 9 countries and demonstrated that a combination of WC and BMI provided improved predictions of a health risk than either anthropometric measure alone.19
However, the effect of screening BMI and WHtR in combination on the risk of hypertension by sex remains to be elucidated.
In the present study, we retrospectively analyzed the health checkup data for the general Japanese population with the aim of investigating whether the combination of BMI and WHtR can better assess the risk of hypertension among men and women in this population.
Methods
Study Population
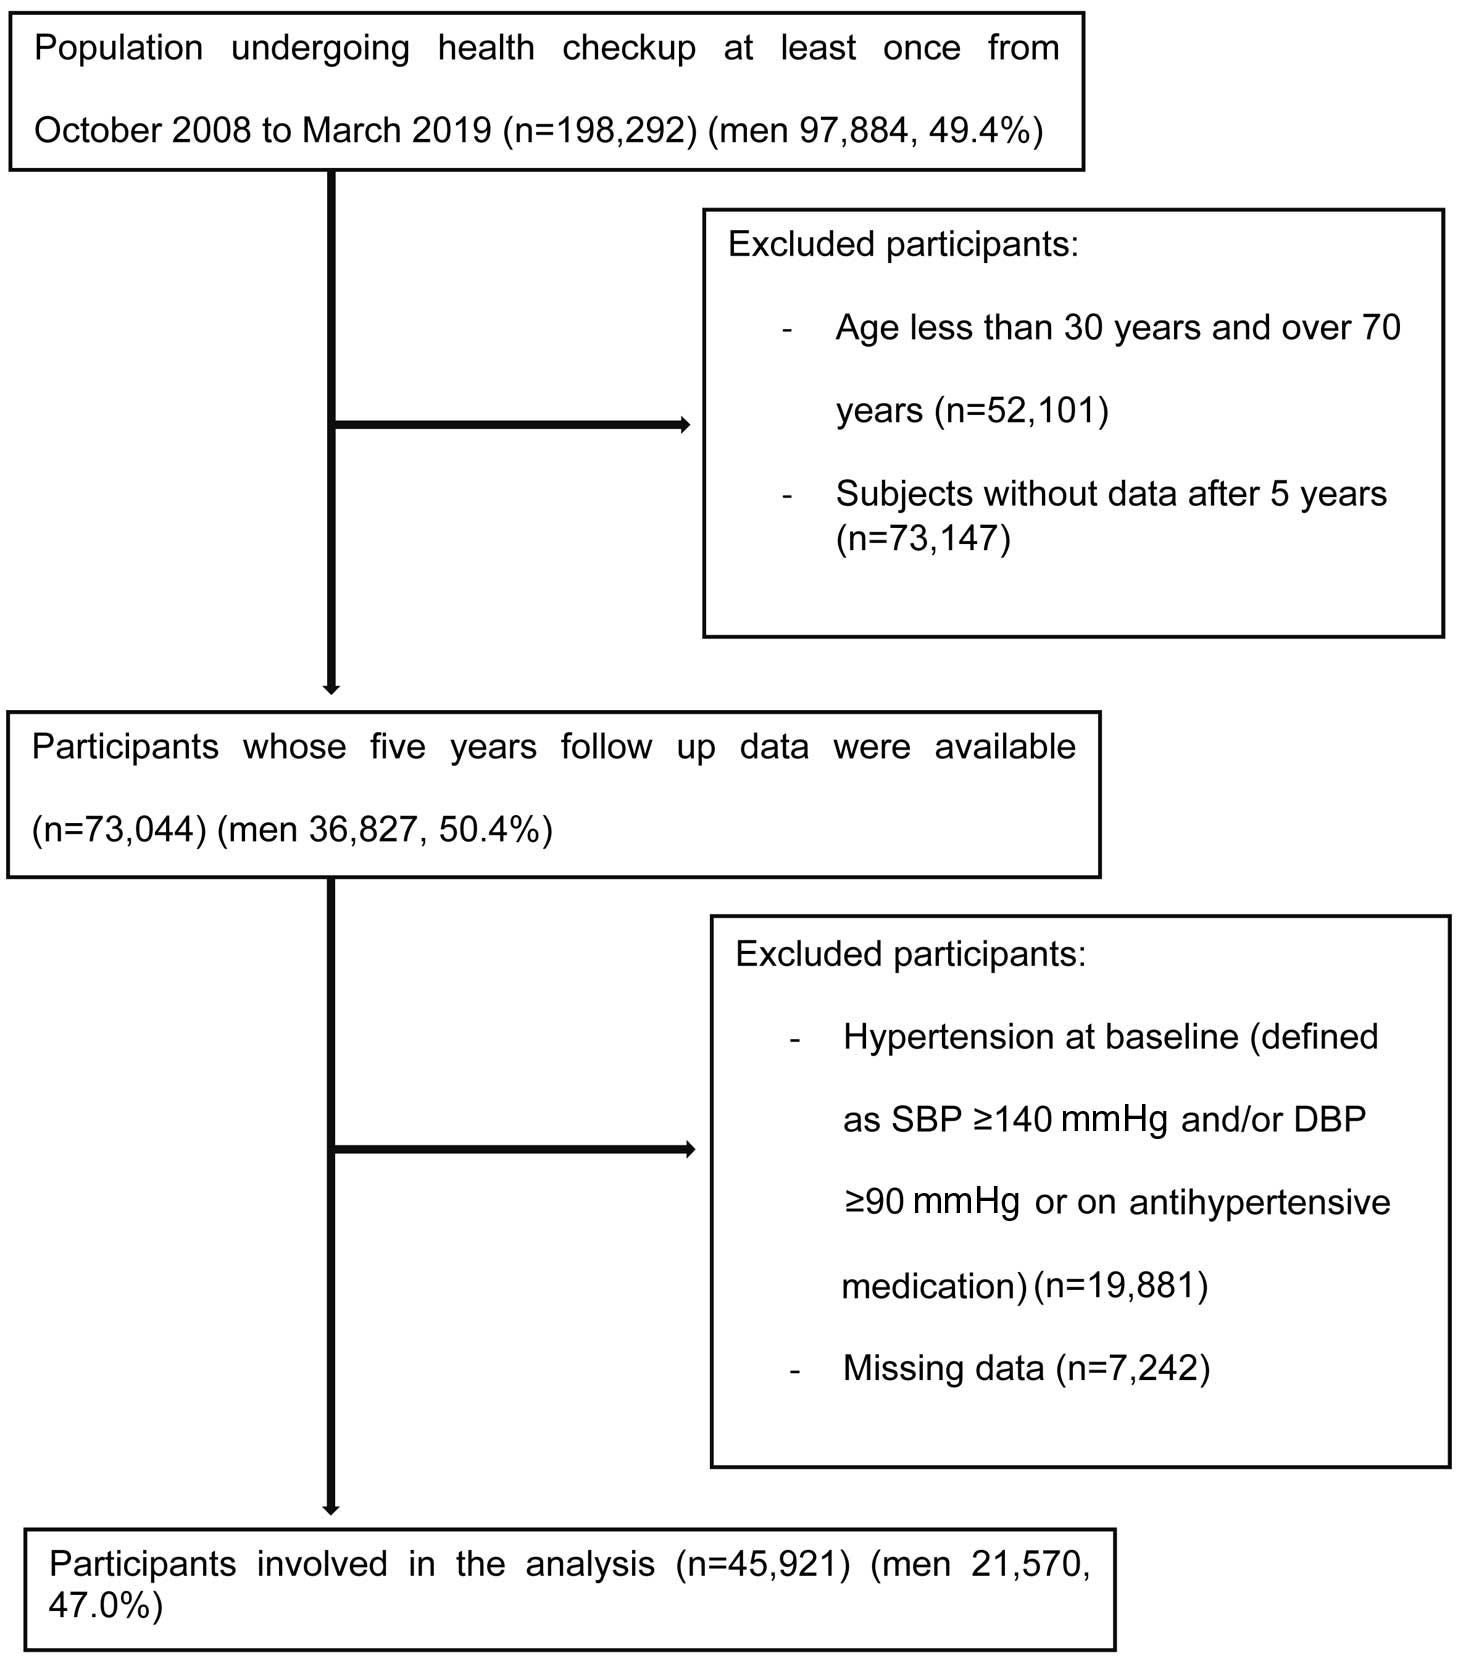
Data from Kagoshima Kouseiren Hospital for involving participants who underwent annual health checkups between October 1, 2008 and March 31, 2019 were used for analysis. Initially, participants aged 30–70 years who had a follow-up time of 5 years (range 3–7 years) and data regarding baseline characteristics were recruited to the study. All participants with missing data and those who were hypertensive were excluded from the study. Thus, 45,921 participants were included in the analysis. Because visits were not consecutive, we only used available baseline and follow-up data at Year 5 for our analysis. The data were anonymized and all participants were given an option to opt-out of the study.
This study complied with the Declaration of Helsinki and was approved by the Institutional Ethics Committee of the Graduate School of Medical and Dental Sciences, Kagoshima University.
Data Collection
Self-administered questionnaires were used to obtain information about current medications for hypertension, diabetes, and dyslipidemia, as well as details regarding smoking, alcohol consumption, and exercise. Participants were categorized as current (tobacco) smokers or non-smokers (those with no history of smoking or ex-smokers); alcohol consumption was categorized as habitual (i.e., daily alcohol intake) or occasional (i.e., participants who rarely or sometimes drank alcohol). An exercise habit was defined as an exercise regimen of ≥30 min once a week. Anthropometric measurements, including height, weight, and WC, were obtained using standard operating procedures established by the WHO.20
BMI was calculated as body weight (kg) divided by height squared (m2). WHtR was calculated by dividing the WC of the participant by their height.
Blood pressure (BP) measurements were taken during enrollment and at subsequent visits. Brachial BP was measured in subjects in a seated position after 3–5 min rest in a quiet room, with an appropriately sized cuff on the right arm; the elbow was rested on a desk with the mid-arm at heart level. A well-trained staff member recorded the readings using a calibrated automated BP machine. During the annual health checkup, the BP reading was recorded only once.
Blood samples were obtained from patients after an overnight fasting. Serum triglycerides (TG), low-density lipoprotein cholesterol (LDL-C), high-density lipoprotein cholesterol (HDL-C), fasting plasma glucose (FPG), and creatinine levels were measured using standard laboratory procedures. Diabetes was defined as FPG ≥110 mg/dL or the use of antidiabetic medication; dyslipidemia was defined as elevated serum LDL-C ≥140 mg/dL or serum HDL-C <40 mg/dL or elevated serum TG ≥150 mg/dL or the use of lipid-lowering medications. The estimated glomerular filtration rate (eGFR) was determined according to the new Japanese coefficient for the modified isotope dilution mass spectrometry-traceable Modification of Diet in Renal Disease study equation as follows:
eGFR = 194 × SCr−1.094 × Age−0.287
where SCr is serum creatinine. For women, eGFR was multiplied by a correction factor of 0.739.21
The incidence of hypertension during the 5-year follow-up was determined on the basis of the development of systolic BP (SBP) ≥140 mmHg and/or diastolic BP (DBP) ≥90 mmHg, or newly prescribed antihypertensive medication during the 5-year follow-up.
Anthropometric Measurement and Classification
BMI was used in the present study to define general obesity, whereas WHtR was used to define central obesity. Median BMI and WHtR values were used to classify participants into 4 groups based on whether they had low or high BMI and WHtR. Initially, BMI and WHtR were studied in the 4 separate groups (low BMI, high BMI, low WHtR, and high WHtR) in both sexes. Later, we classified all participants into 4 groups by combining their BMI and WHtR as follows: (1) low BMI+low WHtR; (2) high BMI+low WHtR; (3) low BMI+high WHtR; and (4) high BMI+high WHtR.
Statistical Analyses
All analyses were performed separately for men and women. The continuous variables age, height, weight, WC, BMI, WHtR, SBP, DBP, LDL-C, HDL-C, and eGFR are expressed as the mean±SD; TG and FPG are expressed as the median with interquartile range. Categorical variables (current tobacco smoking, habitual alcohol drinking, habitual exercise, and the use of medication) are presented as numbers and percentages.
The 5-year incidence of hypertension was also calculated. We initially analyzed BMI and WHtR separately to assess their association with the 5-year incidence of hypertension and determined their predictive ability using receiver operating characteristic (ROC) curves, comparing the area under the curve (AUC) between the two indices for each sex separately. The 5-year risk of hypertension was assessed separately in each low or high index (BMI and WHtR) group using univariate and multivariate logistic regression analysis, along with determination of odds ratios (OR) and 95% confidence intervals (CI). In multivariate logistic regression, we analyzed potential confounders using 3 different models: Model 1, age; Model 2, age and SBP; and Model 3, age, SBP, eGFR, current tobacco smoking, exercise habit, diabetes, and dyslipidemia. Furthermore, univariate and multivariate analyses were performed to assess 5-year risk of hypertension between the 4 BMI+WHtR combined categories by sex.
All statistical analyses were performed using the JMP Pro version 14 (SAS Institute, Cary, NC, USA) for Windows. Statistical significance was set at 2-tailed P<0.05.
Results
Baseline Characteristics
Of the 198,292 participants, 45,921 (21,570 [47.0%] men) were eligible for analysis (Figure 1).
Table 1
presents the baseline characteristics of the study population. Women were relatively older than men, but men had significantly higher baseline SBP, TG, and FPG, a higher proportion of current tobacco smokers and habitual alcohol drinkers, a lower proportion of participants with exercise habits, and a lower eGFR than women. After 5 years, the incidence of hypertension was higher in men than in women (19.2% vs. 14.2%, respectively; P<0.001).
Table 1.
Baseline Characteristics of the Study Population and the 5-Year Incidence of Hypertension
| |
All
(n=45,921) |
Men
(n=21,570) |
Women
(n=24,351) |
P value |
| Age (years) |
53.8±10.5 |
52.7±10.7 |
54.8±10.1 |
<0.001 |
| Height (cm) |
159.9±9.0 |
166.8±6.6 |
153.7±5.9 |
<0.001 |
| Weight (kg) |
58.8±11.2 |
65.4±10.3 |
53.0±8.4 |
<0.001 |
| WC (cm) |
82.3±9.0 |
83.8±8.4 |
81.0±9.3 |
<0.001 |
| BMI (kg/m2) |
22.9±3.3 |
23.5±3.1 |
22.4±3.3 |
<0.001 |
| WHtR |
0.52±0.06 |
0.50±0.05 |
0.53±0.06 |
<0.001 |
| SBP (mmHg) |
117.0±12.8 |
118.3±11.8 |
115.8±13.4 |
<0.001 |
| DBP (mmHg) |
72.8±8.7 |
74.4±8.4 |
71.3±8.8 |
<0.001 |
| Triglycerides (mg/dL) |
87 [62–27] |
102 [71–152] |
77 [57–107] |
<0.001 |
| HDL-C (mg/dL) |
60.4±14.9 |
55.9±14.2 |
64.4±14.4 |
<0.001 |
| LDL-C (mg/dL) |
121.7±30.6 |
119.5±30.5 |
123.6±30.5 |
<0.001 |
| FPG (mg/dL) |
94 [88–101] |
96 [90–105] |
92 [87–98] |
<0.001 |
| eGFR (mL/min/1.73 m2) |
107.0±19.4 |
105.8±18.9 |
108.0±19.7 |
<0.001 |
| Current tobacco smoking |
9,749 (21.2) |
8,338 (38.7) |
1,411 (5.8) |
<0.001 |
| Habitual alcohol drinking |
11,406 (24.8) |
9,548 (44.3) |
1,858 (7.6) |
<0.001 |
| Habitual exercise |
12,864 (28.0) |
6,324 (29.3) |
6,540 (26.9) |
<0.001 |
| Antidyslipidemic medication |
2,914 (6.3) |
998 (4.7) |
1,916 (7.8) |
<0.001 |
| Antidiabetic medication |
1,407 (3.1) |
909 (4.2) |
498 (2.0) |
<0.001 |
| 5-year hypertension incidence |
7,591 (16.5) |
4,130 (19.2) |
3,461 (14.2) |
<0.001 |
Unless indicated otherwise, data are given as the mean±SD, median [interquartile range], or n (%). BMI, body mass index; DBP, diastolic blood pressure; eGFR, estimated glomerular filtration rate; FPG, fasting plasma glucose; HDL-C, high-density lipoprotein cholesterol; LDL-C, low-density lipoprotein cholesterol; SBP, systolic blood pressure; WC, waist circumference; WHtR, waist to height ratio.
Predictive ability was based on the AUC in ROC analysis. The AUC of BMI was 0.57 in men and 0.62 in women; the AUC for WHtR was 0.60 in men and 0.64 in women. We observed a minimal difference in the predictive ability of BMI and WHtR individually in both sexes; generally, women had slightly higher AUC than men.
Figure 2
shows the incidence of hypertension according to high or low BMI and high or low WHtR separately. Participants were categorized as having high or low BMI and WHtR based on median values. In men, BMI ≥23.2 kg/m2
and WHtR ≥0.50 were considered high, whereas BMI <23.2 kg/m2
and WHtR <0.50 were considered low. In women, BMI ≥22.0 kg/m2
and WHtR ≥0.52 were considered high, whereas BMI <22.0 kg/m2
and WHtR <0.52 were considered low. The incidence of hypertension in men with a low BMI was 15.9%, and that in men with a low WHtR was 14.6%. These rates were lower than in men with a high BMI (22.2%) and a high WHtR (23.5%). In women, the incidence of hypertension was lower among those with a low BMI (9.8%) or a low WHtR (9.2%) than among those with a high BMI (18.4%) or a high WHtR (18.6%).

Table 2
shows the relationship of each of the obesity indices with the risk of hypertension among men and women after 5 years of follow-up. Both high BMI and high WHtR were separately associated with an increase in the risk of hypertension in both sexes, even after full adjustments in Model 3 (high BMI: OR 1.26 [P<0.001] and 1.46 [P<0.001] in men and women, respectively; high WHtR: OR 1.31 [P<0.001] and 1.39 [P<0.001] in men and women, respectively).
Table 2.
ORs for the 5-Year Incidence of Hypertension for BMI and WHtR Separately by Sex
| |
Univariate |
Multivariate |
| OR (95% CI) |
P value |
Model 1 |
Model 2 |
Model 3 |
| OR (95% CI) |
P value |
OR (95% CI) |
P value |
OR (95% CI) |
P value |
| Men |
| Low BMI |
Ref. |
|
Ref. |
|
Ref. |
|
Ref. |
|
| High BMI |
1.51
(1.41–1.62) |
<0.001 |
1.56
(1.45–1.67) |
<0.001 |
1.28
(1.19–1.38) |
<0.001 |
1.26
(1.17–1.36) |
<0.001 |
| Low WHtR |
Ref. |
|
Ref. |
|
Ref. |
|
Ref. |
|
| High WHtR |
1.80
(1.67–1.93) |
<0.001 |
1.63
(1.52–1.75) |
<0.001 |
1.33
(1.23–1.43) |
<0.001 |
1.31
(1.21–1.41) |
<0.001 |
| Women |
| Low BMI |
Ref. |
|
Ref. |
|
Ref. |
|
Ref. |
|
| High BMI |
2.07
(1.92–2.23) |
<0.001 |
1.89
(1.75–2.04) |
<0.001 |
1.47
(1.36–1.60) |
<0.001 |
1.46
(1.35–1.59) |
<0.001 |
| Low WHtR |
Ref. |
|
Ref. |
|
Ref. |
|
Ref. |
|
| High WHtR |
2.25
(2.08–2.43) |
<0.001 |
1.80
(1.65–1.94) |
<0.001 |
1.39
(1.28–1.52) |
<0.001 |
1.39
(1.27–1.51) |
<0.001 |
In men, low and high BMI were defined as <23.2 and ≥23.2 kg/m2, respectively, whereas low and high WHtR were defined as <0.50 and ≥0.50, respectively. In women, low and high BMI were defined as <22.0 and ≥22.0 kg/m2, respectively, whereas low and high WHtR were defined as <0.52 and ≥0.52, respectively. The univariate and multivariate analyses were adjusted in 3 different models: Model 1, age; Model 2, age and SBP; Model 3, age, SBP, eGFR, current tobacco smoking, exercise, diabetes, and dyslipidemia. CI, confidence interval; OR, odds ratio. Other abbreviations as in Table 1.
Figure 3
shows the 5-year incidence of hypertension among men and women in each of the 4 categories of BMI+WHtR combined. Participants in the low BMI+low WHtR group had the lowest incidence of hypertension in both sexes (men, 14.3%; women, 8.6%). Furthermore, in men, there was a similar incidence of hypertension in the high BMI+high WHtR (23.4%) and low BMI+high WHtR (23.9%) groups, but in women the incidence of hypertension was higher in the high BMI+high WHtR (19.5%) than low BMI+high WHtR (14.8%) group.
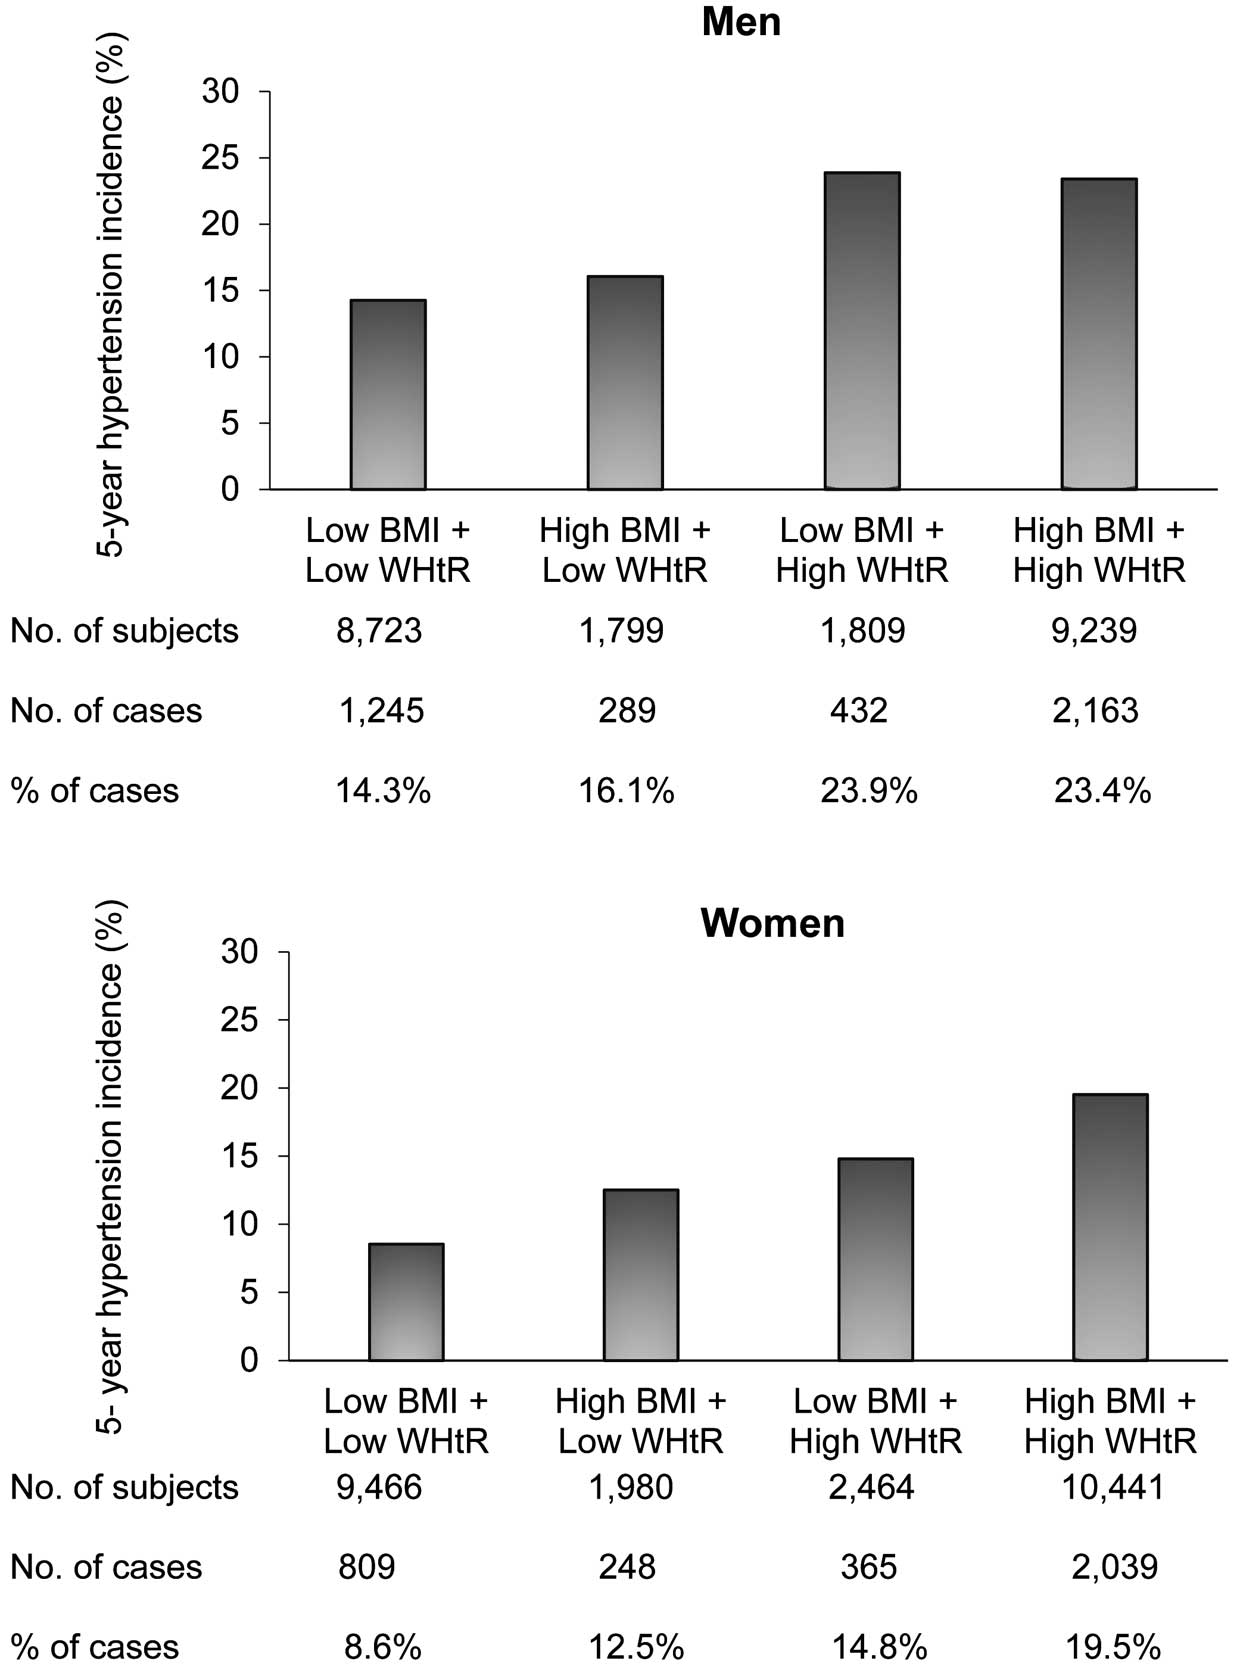
Table 3
presents results of univariate and multivariate logistic regression analyses to determine the effects of the 4 categories of BMI+WHtR combined on predicting the risk of hypertension by sex (using the low BMI+low WHtR group as a reference). In women, the OR for the non-adjusted analysis revealed an increase in the risk of developing hypertension in all categories with at least 1 elevated obesity index; nevertheless, the risk was highest among the high BMI+high WHtR group (OR 2.6; 95% CI 2.38–2.83; P<0.001). Among men, the risk of developing hypertension was not increased in participants with a high BMI+low WHtR, whereas the risk of developing hypertension was increased in participants with low BMI+high WHtR or high BMI+high WHtR. In multivariate Model 1, the categories for obesity in each sex appeared to be associated with the risk of developing hypertension; women with high BMI+high WHtR had the highest risk, followed by men with high BMI+high WHtR. In Model 2, women had an increased risk of developing hypertension in all categories; however, among men, those in the high BMI+low WHtR group showed no increased risk of developing hypertension. In addition, the OR for the combined effect of BMI and WHtR in the fully adjusted model (Model 3) showed a significant increase in the risk of hypertension in all categories among women. In contrast, we found that men with a high BMI+low WHtR did not have an increased risk of developing hypertension (OR 1.14; 95% CI 0.98–1.32; P=0.08).
Table 3.
ORs for the 5-Year Incidence of Hypertension Using the Combination of BMI and WHtR by Sex
| |
Univariate |
Multivariate |
| OR (95% CI) |
P value |
Model 1 |
Model 2 |
Model 3 |
| OR (95% CI) |
P value |
OR (95% CI) |
P value |
OR (95% CI) |
P value |
| Men |
Low BMI+
low WHtR |
Ref. |
|
Ref. |
|
Ref. |
|
Ref. |
|
High BMI+
low WHtR |
1.15
(1.00–1.32) |
0.050 |
1.35
(1.18–1.56) |
<0.001 |
1.15
(0.99–1.33) |
0.066 |
1.14
(0.98–1.32) |
0.080 |
Low BMI+
high WHtR |
1.88
(1.67–2.13) |
<0.001 |
1.50
(1.32–1.70) |
<0.001 |
1.27
(1.11–1.45) |
<0.001 |
1.26
(1.10–1.44) |
<0.001 |
High BMI+
high WHtR |
1.84
(1.70–1.98) |
<0.001 |
1.76
(1.62–1.90) |
<0.001 |
1.38
(1.27–1.50) |
<0.001 |
1.36
(1.25–1.48) |
<0.001 |
| Women |
Low BMI+
low WHtR |
Ref. |
|
Ref. |
|
Ref. |
|
Ref. |
|
High BMI+
low WHtR |
1.53
(1.32–1.78) |
<0.001 |
1.65
(1.42–1.93) |
<0.001 |
1.37
(1.17–1.61) |
<0.001 |
1.37
(1.17–1.61) |
<0.001 |
Low BMI+
high WHtR |
1.86
(1.63–2.12) |
<0.001 |
1.35
(1.18–1.55) |
<0.001 |
1.16
(1.00–1.33) |
0.043 |
1.15
(1.00–1.33) |
0.048 |
High BMI+
high WHtR |
2.60
(2.38–2.83) |
<0.001 |
2.13
(1.94–2.32) |
<0.001 |
1.56
(1.42–1.71) |
<0.001 |
1.55
(1.41–1.71) |
<0.001 |
In men, low and high BMI were defined as <23.2 and ≥23.2 kg/m2, respectively, whereas low and high WHtR were defined as <0.50 and ≥0.50, respectively. In women, low and high BMI were defined as <22.0 and ≥22.0 kg/m2, respectively, whereas low and high WHtR were defined as <0.52 and ≥0.52, respectively. The univariate and multivariate analyses were adjusted in 3 different models: Model 1, age; Model 2, age and SBP; Model 3, age, SBP, eGFR, current tobacco smoking, exercise, diabetes, and dyslipidemia. Abbreviations as in Tables 1,2.
Discussion
This study examined the clinical significance of the combination of WHtR and BMI as a composite index for the assessment of the risk of hypertension for each sex. We observed an improvement in the prediction of the incidence of hypertension when BMI and WHtR were simultaneously accounted for compared with the use of a single index. In addition, regardless of BMI, a high WHtR, which reflects an increase in the proportion of abdominal fat, was observed to be associated with an increased risk of hypertension in both sexes. After adjusting for confounding factors, we found differences in the risk of hypertension between the 2 sexes. A high BMI determined the risk of hypertension in all women who participated in the study, but not in men who had a low WHtR.
Hypertension and obesity have a complex association. Understanding the distribution of excess adipose tissue using anthropometric tools is an elementary method that provides useful information for screening participants for cardiovascular risk. BMI has been used worldwide because of its relatively simple approach, and obesity evaluated by BMI is a well-recognized risk factor for cardiometabolic morbidity and mortality. However, BMI cannot measure body fat distribution and cannot distinguish between fat-free mass and fat mass.22
The different BMI cut-off points for the overweight and obesity categories can be misleading when it comes to the classification of the risk of hypertension in different ethnicities. For example, Asians are prone to developing metabolic disorders, including diabetes, dyslipidemia, and hypertension, within the normal weights and BMI values that are set according to Western standards.23
It has been suggested that indices such as WC, waist to hip ratio, and WHtR may predict the distribution of adiposity, cardiometabolic risk, and mortality better than BMI.14
However, our focus was on WHtR because some systematic reviews and meta-analyses across ethnic groups using the AUC from ROC analysis found WHtR was better and more useful for risk assessment than BMI and WC.13,24
These previous findings indicate a slightly superior ability of WHtR over BMI in predicting the risk of hypertension. Furthermore, considering the advantages of each anthropometric tool in assessing fat distribution, combining BMI and WHtR may reduce the limitations associated with the single index. In lean or healthy individuals, adipose tissue is distributed and confined to specific areas in the subcutaneous and visceral tissues for excess lipid storage. This is achieved by the adaptive mechanisms of the adipocytes to hyperplasia and hypertrophy. However, under conditions of overwhelmed capacity, excess fat begins to accumulate ectopically as visceral fat,14
which better predicts the risk of cardiometabolic sequelae associated with obesity than does peripheral or subcutaneous fat.25
In the present study, among the groups of men and women, those with the lowest BMI and lowest WHtR were least likely to develop hypertension over the next 5 years. The study found that the combination of high BMI and low WHtR was associated with an increased risk of hypertension in women and that BMI individually contributed to the risk of hypertension. In contrast, men with a high BMI and low WHtR did not have an increased risk of developing hypertension, whereas the risk was increased in those with a high WHtR even if the BMI was low. A man with a low BMI and high WHtR would likely have an “apple-shaped body”; this would be associated with a lower BMI but a larger WC and an increase in abdominal visceral fat deposits. In this context, the findings of the present study demonstrate the value of WHtR in establishing the association between abdominal fat accumulation and an increased risk of hypertension in men, whereas in women both general and abdominal fat accumulation is associated with the risk of hypertension. Men with a high WHtR would likely be missed in the screening of hypertension incidence if BMI was the only tool used for evaluation and WHtR was not accounted for.
To the best of our knowledge, no longitudinal studies have evaluated the predictive ability of the combination of BMI and WHtR for assessing the risk of hypertension in each of the sexes in the general Japanese population. In a cross-sectional study that assessed cardiometabolic risk among middle-aged adults in Ireland, tertiles of the combination of BMI and WHtR identified consistent metabolic differences relative to those characterized based on one index, suggesting that risk stratification using a composite index is a better method to identify individuals at risk than using a single index.26
The results of a study examining a combination of BMI and WC were similar to those of the present study in terms of a stronger association and improved assessment of the risk of hypertension when both indices were evaluated together.27
That study found that men with a high BMI but normal WC had an increased risk of developing hypertension;27
however, in the present study, men had no increased risk of hypertension when BMI was high and WHtR was low.
The observed differences between the sexes can be explained by the fact that adipose tissue is an active endocrine organ that produces hormones, cytokines, chemokines, and growth factors; any dysregulation may lead to obesity-related metabolic disorders. This depends on the amount of extra fat accumulated and its anatomical location, which is greatly affected by sex.28,29
Regardless of ethnicity, age, or an increase in BMI, the body fat percentage in women remains higher than in men, whereas men have an increased muscle mass percentage than women. Furthermore, it has been reported that women accumulate more adipose tissue in the peripheral and lower body areas, including subcutaneous fat and gluteal–femoral fat, whereas men accumulate a great amount of visceral adipose tissue in the upper body regions.29,30
Our findings also suggest there is visceral fat accumulation among men in this population that is a determinant of hypertension risk. Men are also more prone to multiple risk factors, including tobacco smoking and stress, that may lead to dysfunctional subcutaneous adipose tissue and a gradual accumulation of visceral adipose tissue, an increase cell size, and poor buffering capacity.
The assessment of overweight and obesity using BMI alone could be insufficient because excess visceral adiposity can be found not only in obese patients, but also in those who are overweight or even have normal weight. The combination of BMI and WHtR to gauge the risk of hypertension would assist in the screening of obesity phenotypes, such as metabolically unhealthy non-obese individuals. Furthermore, when weight loss is considered for obesity control, maintaining a lower WHtR in men could be beneficial; however, in women, obesity control by maintaining a lower BMI and WHtR could be beneficial to reduce the risk of developing hypertension.
The present study has several limitations. First, we only included participants who were involved in the health checkups at a single facility in Japan and so it may not be possible to extrapolate the findings to other ethnic groups. Second, the data were not collected prospectively; we could not assess time to event because our statistical analysis was limited by most participants missing their annual checkups, leading to non-consecutive visits, and so the findings should be verified in further prospective observational studies. Third, we did not take BP readings on several occasions to assess sustained elevated BP and the reproducibility of the diagnosis of hypertension; therefore, the results need to be confirmed in other studies using multiple BP measurements. Finally, we had no information on salt intake, vegetable and fruit consumption, stress, sleep time, menopause, and sex hormones, all of which may affect BP.
In conclusion, we found that the combination of BMI and WHtR improved the prediction of the incidence of hypertension in the general Japanese population and that a high BMI determined the risk of hypertension in all women who participated in the study, but not in men who had a low WHtR. WHtR should be used simultaneously with BMI to evaluate the risk of hypertension to overcome sex differences and the limitations of using a single index in predicting the incidence of hypertension.
Acknowledgments
The authors thank the medical staff at Kagoshima Kouseiren Medical Health Care Centre for their support with data collection.
Sources of Funding
This study did not receive any specific funding.
Disclosures
M.O. is a member of
Circulation Reports’ Editorial Team. The remaining authors have no conflicts of interest to disclose.
IRB Information
This study was approved by the Institutional Ethics Committee of the Graduate School of Medical and Dental Sciences, Kagoshima University (No. 520).
Data Availability
The deidentified participant data will not be shared.
References
- 1.
Mills KT, Bundy JD, Kelly TN, Reed JE, Kearney PM, Reynolds K, et al. Global disparities of hypertension prevalence and control: A systematic analysis of population-based studies from 90 countries. Circulation 2016; 134: 441–450.
- 2.
Murray CJL, Aravkin AY, Zheng P, Abbafati C, Abbas KM, Abbas-kangevari M, et al. Global burden of 87 risk factors in 204 countries and territories, 1990–2019: A systematic analysis for the Global Burden of Disease Study 2019. Lancet 2020; 396: 1223–1249.
- 3.
Krauss RM, Winston M, Fletcher BJ, Grundy SM. Obesity: Impact on cardiovascular disease. Circulation 1998; 98: 1472–1476.
- 4.
Rao G, Powell-Wiley TM, Ancheta I, Hairston K, Kirley K, Lear SA, et al. Identification of obesity and cardiovascular risk in ethnically and racially diverse populations: A scientific statement from the American Heart Association [published correction appears in Circulation 2015; 132: e130]. Circulation 2015; 132: 457–472.
- 5.
Decoda Study Group; Nyamdorj R, Qiao Q, Lam TH, Tuomilehto J, Ho SY, Pitkäniemi J, et al. BMI compared with central obesity indicators in relation to diabetes and hypertension in Asians. Obesity (Silver Spring) 2008; 16: 1622–1635.
- 6.
Paajanen TA, Oksala NK, Kuukasjärvi P, Karhunen PJ. Short stature is associated with coronary heart disease: A systematic review of the literature and a meta-analysis. Eur Heart J 2010; 31: 1802–1809.
- 7.
Schmidt M, Bøtker HE, Pedersen L, Sørensen HT. Adult height and risk of ischemic heart disease, atrial fibrillation, stroke, venous thromboembolism, and premature death: A population based 36-year follow-up study. Eur J Epidemiol 2014; 29: 111–118.
- 8.
Rezende AC, Souza LG, Jardim TV, Perillo NB, Araújo YCL, de Souza SG, et al. Is waist-to-height ratio the best predictive indicator of hypertension incidence?: A cohort study. BMC Public Health 2018; 18: 281.
- 9.
Misra A, Wasir JS, Vikram NK. Waist circumference criteria for the diagnosis of abdominal obesity are not applicable uniformly to all populations and ethnic groups. Nutrition 2005; 21: 969–976.
- 10.
Hsieh SD, Yoshinaga H, Muto T. Waist-to-height ratio, a simple and practical index for assessing central fat distribution and metabolic risk in Japanese men and women. Int J Obes Relat Metab Disord 2003; 27: 610–616.
- 11.
Browning LM, Hsieh SD, Ashwell M. A systematic review of waist-to-height ratio as a screening tool for the prediction of cardiovascular disease and diabetes: 0.5 could be a suitable global boundary value. Nutr Res Rev 2010; 23: 247–269.
- 12.
Battie CA, Borja-Hart N, Ancheta IB, Flores R, Rao G, Palaniappan L. Comparison of body mass index, waist circumference, and waist to height ratio in the prediction of hypertension and diabetes mellitus: Filipino-American women cardiovascular study. Prev Med Rep 2016; 4: 608–613.
- 13.
Obesity in Asia Collaboration. Is central obesity a better discriminator of the risk of hypertension than body mass index in ethnically diverse populations? J Hypertens 2008; 26: 169–177.
- 14.
Lee CM, Huxley RR, Wildman RP, Woodward M. Indices of abdominal obesity are better discriminators of cardiovascular risk factors than BMI: A meta-analysis. J Clin Epidemiol 2008; 61: 646–653.
- 15.
Kotani K, Tokunaga K, Fujioka S, Kobatake T, Keno Y, Yoshida S, et al. Sexual dimorphism of age-related changes in whole-body fat distribution in the obese. Int J Obes Relat Metab Disord 1994; 18: 207–212.
- 16.
Schorr M, Dichtel LE, Gerweck AV, Valera RD, Torriani M, Miller KK, et al. Sex differences in body composition and association with cardiometabolic risk. Biol Sex Differ 2018; 9: 28.
- 17.
Bigaard J, Spanggaard I, Thomsen BL, Overvad K, Tjønneland A. Self-reported and technician-measured waist circumferences differ in middle-aged men and women. J Nutr 2005; 135: 2263–2270.
- 18.
Ross R, Neeland IJ, Yamashita S, Shai I, Seidell J, Magni P, et al. Waist circumference as a vital sign in clinical practice: A consensus statement from the IAS and ICCR Working Group on Visceral Obesity. Nat Rev Endocrinol 2020; 16: 177–189.
- 19.
Pischon T, Boeing H, Hoffmann K, Bergmann M, Schulze MB, Overvad K, et al. General and abdominal adiposity and risk of death in Europe [published correction appears N Engl J Med 2010; 362: 2433]. N Engl J Med 2008; 359: 2105–2120.
- 20.
World Health Organization (WHO). Waist circumference and waist-hip ratio: Report of a WHO expert consultation, Geneva, 8–11 December 2008. https://www.who.int/publications/i/item/9789241501491 (accessed November 3, 2021).
- 21.
Matsuo S, Imai E, Horio M, Yasuda Y, Tomita K, Nitta K, et al. Revised equations for estimated GFR from serum creatinine in Japan. Am J Kidney Dis 2009; 53: 982–992.
- 22.
Adab P, Pallan M, Whincup PH. Is BMI the best measure of obesity? BMJ 2018; 360: k1274.
- 23.
Chait A, den Hartigh LJ. Adipose tissue distribution, inflammation and its metabolic consequences, including diabetes and cardiovascular disease. Front Cardiovasc Med 2020; 7: 22.
- 24.
Ashwell M, Gunn P, Gibson S. Waist-to-height ratio is a better screening tool than waist circumference and BMI for adult cardiometabolic risk factors: Systematic review and meta-analysis. Obes Rev 2012; 13: 275–286.
- 25.
Fox CS, Massaro JM, Hoffmann U, Pou KM, Maurovich-Horvat P, Liu CY, et al. Abdominal visceral and subcutaneous adipose tissue compartments: Association with metabolic risk factors in the Framingham Heart Study. Circulation 2007; 116: 39–48.
- 26.
Millar SR, Perry IJ, Phillips CM. Assessing cardiometabolic risk in middle-aged adults using body mass index and waist-height ratio: Are two indices better than one? A cross-sectional study. Diabetol Metab Syndr 2015; 7: 73.
- 27.
Zhang M, Zhao Y, Wang G, Zhang H, Ren Y, Wang B, et al. Body mass index and waist circumference combined predicts obesity-related hypertension better than either alone in a rural Chinese population. Sci Rep 2016; 6: 31935.
- 28.
Nauli AM, Matin S. Why do men accumulate abdominal visceral fat? Front Physiol 2019; 10: 1486.
- 29.
Bloor ID, Symonds ME. Sexual dimorphism in white and brown adipose tissue with obesity and inflammation. Horm Behav 2014; 66: 95–103.
- 30.
Lumish HS, O’Reilly M, Reilly MP. Sex differences in genomic drivers of adipose distribution and related cardiometabolic disorders: Opportunities for precision medicine. Arterioscler Thromb Vasc Biol 2020; 40: 45–60.