Abstract
Background: In patients with aortic stenosis (AS), measurement of aortic valve calcification (AVC) using computed tomography (CT) is recommended in cases where echocardiographic measurements are inconclusive. However, sex-specific AVC thresholds proposed in the guidelines for predicting severe AS (women: 1,200 arbitrary units [AU]; men: 2,000 AU) are based on studies from Western countries.
Methods and Results: We retrospectively included 512 Japanese patients with at least moderate AS who underwent transthoracic echocardiography and CT. AVC was quantified using the Agatston method. AVC was positively correlated with peak aortic jet velocity and mean transvalvular gradient (mPG), and negatively correlated with aortic valve area (AVA) and the AVA index (AVAi). In 257 patients with concordant AS grading (152 severe AS [AVAi ≤0.6 cm2/m2, mPG ≥40 mmHg], 105 moderate AS [AVAi >0.6 cm2/m2, mPG <40 mmHg]), receiver operating characteristic curve analysis of AVC predicting severe AS yielded an area under the curve of 0.91 (95% confidence interval [CI] 0.87–0.95; P<0.001) in women and 0.86 (95% CI 0.75–0.98; P<0.001) in men. The optimal thresholds (women: 1,379 AU; men: 1,802 AU) were close to those proposed in the guidelines. The diagnostic accuracy of the thresholds in the guidelines was similar to that of the optimal thresholds.
Conclusions: The sex-specific AVC thresholds proposed in international guidelines can be applied to Japanese AS patients, yielding similar diagnostic accuracy as the optimal cut-off derived from the study patients.
Aortic valve replacement (AVR) has long been regarded as the only effective therapy for severe aortic stenosis (AS);1 transcatheter aortic valve implantation (TAVI) has been developed as a less invasive therapy.2 Since its introduction to the clinical arena, the indications for TAVI have been broadened from high-risk3,4 to low-risk patients5,6 with severe AS. Considering the widespread use of these treatments, assessment of the severity of AS is increasingly crucial. Echocardiography is regarded as the first-line gold standard assessment of AS severity. Typically, AS is considered severe if the patient has a mean transvalvular pressure gradient (mPG) ≥40 mmHg, a peak aortic jet velocity (Vmax) ≥4.0 m/s, an aortic valve area (AVA) ≤1.0 cm2, and an indexed AVA (AVAi) ≤0.6 cm2/m2. However, in up to 50% of patients, such assessments are discordant, with the most common being the presence of a small AVA (≤1.0 cm2), suggesting severe AS, but a low gradient (mPG <40 mmHg), suggesting non-severe AS, which leads to uncertainty regarding the true severity of the disease.7
Computed tomography (CT) assessment of aortic valve calcification (AVC) is recommended in cases where echocardiographic measurements are discordant and inconclusive (e.g., low-flow, low-gradient [LF-LG] AS), as proposed in the latest guidelines for the management of patients with valvular heart diseases.8–10 The use of cardiac CT to screen patients with AS and for procedural planning before AVR/TAVI offers an opportunity to obtain CT-AVC data by acquiring electrocardiogram-gated non-contrast images as an add-on to the routine imaging protocol. AVC accurately reflects the total amount of calcium in the aortic valve in patients with AS.11,12 Subsequent studies revealed sex differences in AVC.13 Clavel et al first proposed sex-specific AVC thresholds to diagnose severe AS (1,274 and 2,065 arbitrary units [AU] in women and men, respectively), analyzing a cohort of patients with concordant grading (CG) with preserved left ventricular ejection fraction (LVEF) and normal flow.14 Later studies showed that AVC independently predicts mortality after AS diagnosis.15,16 Thus, AVC is regarded as valuable not only for diagnosis, but also for risk stratification. The specific AVC thresholds recommended in the international guidelines to predict severe AS (1,200 and 2,000 AU for women and men, respectively) were based on studies from Western countries.8–10
Conversely, there have been few reports on the diagnostic value of AVC in the Japanese AS population.17 To the best of our knowledge, sex-specific thresholds of AVC have never been investigated in Japanese patients with AS. These factors preclude drawing a conclusion as to whether the thresholds proposed from Western countries can be directly used in Japan. To apply specific thresholds for diagnostic guidance, these thresholds need to be appropriately validated in the Japanese population.
Thus, the aims of the present study were to: (1) correlate AVC and echocardiographic measures in Japanese AS patients; (2) evaluate the diagnostic ability of AVC in Japanese AS patients according to sex; and (3) explore the diagnostic and clinical implications of AVC in subgroups of patients with low LVEF, low flow, or LF-LG AS.
Methods
Study Design
This was a retrospective single-center observational study. The study included 512 AS patients with at least moderate AS (defined as mPG ≥25 mmHg, Vmax
≥2.5 m/s, or AVA ≤1.5 cm2) who underwent transthoracic echocardiography and multidetector CT (MDCT) within the same episode of care (<1 month between evaluations) at Sapporo Higashi Tokushukai Hospital. Children <18 years old, patients with identified sequelae of rheumatic disease or endocarditis, those with moderate or severe mitral valve disease, and those with previous valve repair or replacement were excluded.
Demographic and clinical data were collected from electronic medical records. The study protocol complied with the Declaration of Helsinki and was approved by the Institutional Review Board of Sapporo Higashi Tokushukai Hospital. The need for informed consent was waived due to the retrospective nature of the study.
Doppler Echocardiography Measurements
Doppler echocardiography was performed by experienced echocardiographers according to the recommendations of echocardiographic societies.18 Vmax, mPG, and AVA using the continuity equation were measured in each patient. The AVA was then indexed to body surface area (BSA), providing AVAi. LVEF was calculated using the modified Simpson method. The velocity time integral in the left ventricular outflow tract (LVOT) was multiplied by the LVOT area (derived from LVOT diameter), providing stroke volume (SV), which was then indexed to BSA (i.e., SV index [SVi]).
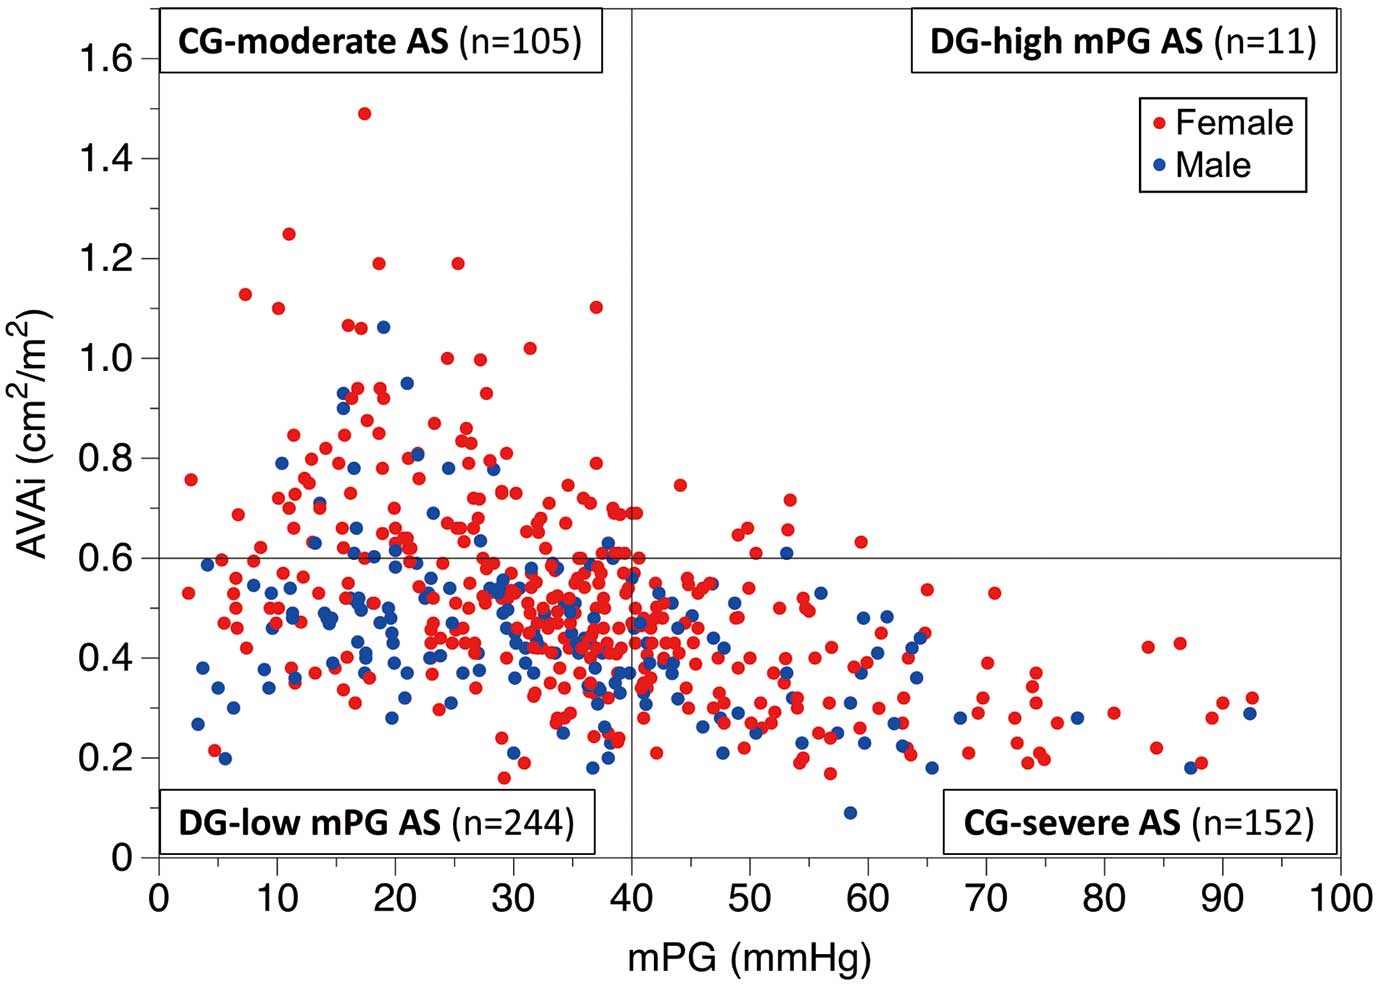
On the basis of AVAi and mPG, patients were categorized into 4 groups (Supplementary Figure 1): CG with severe AS (AVAi ≤0.6 cm2/m2, mPG ≥40 mmHg); CG with moderate AS (AVAi >0.6 cm2/m2, mPG <40 mmHg); discordant grading (DG) with low mPG (AVAi ≤0.6 cm2/m2, mPG <40 mmHg); and DG with high mPG (AVAi >0.6 cm2/m2, mPG ≥40 mmHg).14
CT Data Acquisition
CT examinations were performed using Brilliance iCT Elite scanners (Philips Medical Systems, Cleveland, OH, USA). A scan run consisted of 2.5-mm contiguous transverse slices triggered at end-diastole, performed with a tube current of 250 mA and a tube voltage of 120 kV. No contrast enhancement was needed, nor were β-blockers administered for the purpose of the examination. Measurements of AVC (i.e., AVC score) were performed offline on a dedicated workstation with validated software (Heartbeat Calcium Scoring; Philips Medical Systems, Andover, MA, USA) according to the Agatston method and are expressed in arbitrary units (AU).19 A representative example of an AVC analysis is shown in Supplementary Figure 2. The aortic valve was visualized in multiple planes, with careful section-by-section measurements aiming to accurately exclude contiguous calcium in the LVOT, aortic sinus, coronary arteries, or mitral annulus. To account for interindividual variability in cardiac or body size, AVC density (where AVC is indexed to the cross-sectional area of the aortic annulus calculated from LVOT diameter measured by echocardiography) and AVC index (AVCi; where AVC is indexed to BSA) were calculated.14
Prediction of Disease Progression and Adverse Outcomes in DG AS
The outcome of interest was defined as a composite of death, TAVI, and AVR after the initial AVC measurement by CT. Decisions regarding whether to proceed to TAVI or AVR were made according to international clinical guidelines after multidisciplinary discussion. Patients for whom a decision to proceed to TAVI or AVR had already been made at the time of the initial CT-AVC measurement or patients who had CT imaging performed as part of the workup before TAVI or AVR were excluded from the analysis.16
Statistical Analysis
Categorical variables are expressed as numbers and percentages. Continuous variables are presented as the mean±SD or median with interquartile range (IQR), as appropriate. Categorical variables were compared using the Chi-squared test or Fisher’s exact test, as appropriate. For continuous variables, differences among groups were analyzed using 1-way analysis of variance (ANOVA). Because AVC, AVC density, and AVCi were not normally distributed, differences among groups were analyzed using the Kruskal-Wallis test followed by Bonferroni correction for intergroup comparisons.
Correlations between log-transformed AVC and echocardiographic parameters (Vmax, mPG, AVA, and AVAi) were assessed using the Pearson correlation test. Linear regression analysis with log-transformed AVC was performed, and the equation providing the best fit was retained. In patients in the CG AS groups (i.e., CG-severe AS and CG-moderate AS), receiver operating characteristic (ROC) curves of AVC, AVC density, and AVCi predicting severe AS were constructed, and the optimal thresholds were determined based on Youden’s index. The sensitivity, specificity, positive predictive value (PPV), negative predictive value (NPV), and accuracy of the optimal cut-off values were compared with those of the thresholds recommended in the guidelines (1,200 AU in women and 2,000 AU in men). McNemar’s test was performed to compare the accuracy of these thresholds. Multivariate logistic regression analysis was used to identify the independent predictors of severe AS in the CG population. Clinically relevant variables with P<0.05 on univariate analysis were retained in the multivariate model. The clinical endpoint in the DG population was evaluated by the Kaplan-Meier method and log-rank test.
P<0.05 was considered statistically significant. Statistical analyses were performed using R version 4.1.2 (R Foundation for Statistical Computing, Vienna, Austria) and SPSS Statistics version 28.0.1.0 (IBM Corp., Armonk, NY, USA).
Results
AS Grading
Among the 512 patients included in the study, 257 had a concordant AS grading: 152 (29.7%) were classified as CG-severe AS (AVAi ≤0.6 cm2/m2, mPG ≥40 mmHg) and 105 (20.5%) were classified as CG-moderate AS (AVAi >0.6 cm2/m2, mPG <40 mmHg). The remaining 255 patients were classified as DG: 244 (47.7%) as DG-low mPG (AVAi ≤0.6 cm2/m2, mPG <40 mmHg) and 11 (2.1%) as DG-high mPG (AVAi >0.6 cm2/m2, mPG ≥40 mmHg) (Figure 1).
Clinical, Echocardiographic, and MDCT Characteristics According to AS Grading
Baseline characteristics of the study population are presented in Table 1. Overall, the patients were predominantly female (67.2%); mean patient age was 85.7±7.4 years, 31.2% had diabetes, and 67.6% had chronic kidney disease (CKD). Patients with CG-moderate AS and high-mPG AS were smaller in terms of body size (BMI and BSA), which is in line with female prevalence. Atrial fibrillation was more frequently observed in the DG-low mPG AS than other groups. Presentation with chronic heart failure was less common in the CG-moderate AS group, which is consistent with the disease severity.
Table 1. Clinical, Echocardiographic, and CT AVC Data According to AS Group Stratification
| |
Overall (n=512) |
CG-AS |
DG-AS |
P value |
| Severe AS (n=152) |
Moderate AS (n=105) |
High mPG (n=11) |
Low mPG (n=244) |
| Clinical characteristics |
| Age (years) |
85.7±7.4 |
85.0±7.7 |
87.5±7.4 |
86.3±4.7 |
85.4±7.3 |
0.045 |
| Female sex |
344/512 (67.2) |
106/152 (69.7) |
87/105 (82.9) |
10/11 (90.9) |
141/244 (57.8) |
<0.001 |
| Height (cm) |
152.3±9.7 |
152.5±9.7 |
148.0±8.1 |
146.9±6.1 |
154.2±9.9 |
<0.001 |
| Weight (kg) |
50.6±11.0 |
52.9±12.1 |
44.7±8.8 |
45.7±5.9 |
51.9±10.5 |
<0.001 |
| BMI (kg/m2) |
21.8±4.0 |
22.6±4.2 |
20.4±3.9 |
21.3±3.1 |
21.8±3.7 |
<0.001 |
| BSA (m2) |
1.45±0.18 |
1.48±0.20 |
1.36±0.14 |
1.36±0.09 |
1.48±0.18 |
<0.001 |
| SBP (mmHg) |
122.5±15.7 |
122.1±16.3 |
124.3±15.4 |
124.8±13.0 |
121.8±15.6 |
0.534 |
| DBP (mmHg) |
63.0±10.5 |
62.7±11.9 |
63.2±10.2 |
59.5±9.6 |
63.3±9.7 |
0.666 |
| Diabetes |
160/512 (31.2) |
45/152 (29.6) |
23/105 (21.9) |
5/11 (45.5) |
87/244 (35.7) |
0.053 |
| Hypertension |
415/512 (81.1) |
120/152 (78.9) |
89/105 (84.8) |
11/11 (100.0) |
195/244 (79.9) |
0.245 |
| Dyslipidemia |
219/512 (42.8) |
75/152 (49.3) |
37/105 (35.2) |
4/11 (36.4) |
103/244 (42.2) |
0.149 |
| CKD |
346/512 (67.6) |
98/152 (64.5) |
69/105 (65.7) |
6/11 (54.5) |
173/244 (70.9) |
0.404 |
| Cr (mg/dL) |
1.41±1.59 |
1.35±1.47 |
1.29±1.44 |
1.57±3.01 |
1.49±1.65 |
0.664 |
| eGFR (mL/min/1.73 m2) |
53.6±41.9 |
53.3±25.2 |
50.9±22.2 |
64.8±26.3 |
54.4±55.2 |
0.722 |
| Hemodialysis |
42/512 (8.2) |
12/152 (7.9) |
6/105 (5.7) |
1/11 (9.1) |
23/244 (9.4) |
0.710 |
| Atrial fibrillation |
140/512 (27.3) |
33/152 (21.7) |
23/105 (21.9) |
0/11 (0.0) |
84/244 (34.4) |
0.003 |
| Ever smoked |
38/512 (7.4) |
9/152 (5.9) |
6/105 (5.7) |
0/11 (0.0) |
23/244 (9.4) |
0.354 |
| COPD |
30/512 (5.9) |
10/152 (6.6) |
6/105 (5.7) |
0/11 (0.0) |
14/244 (5.7) |
0.840 |
| History of MI |
26/512 (5.1) |
4/152 (2.6) |
6/105 (5.7) |
0/11 (0.0) |
16/244 (6.6) |
0.299 |
| History of PCI |
108/512 (21.1) |
24/152 (15.8) |
21/105 (20.0) |
1/11 (9.1) |
62/244 (25.4) |
0.097 |
| History of CABG |
10/512 (2.0) |
3/152 (2.0) |
1/105 (1.0) |
0/11 (0.0) |
6/244 (2.5) |
0.778 |
| Symptoms |
| Angina |
12/512 (2.3) |
3/152 (2.0) |
6/105 (5.7) |
0/11 (0.0) |
3/244 (1.2) |
0.075 |
| Syncope |
20/512 (3.9) |
2/152 (1.3) |
7/105 (6.7) |
0/11 (0.0) |
11/244 (4.5) |
0.137 |
| Chronic heart failure |
486/512 (94.9) |
150/152 (98.7) |
93/105 (88.6) |
11/11 (100.0) |
232/244 (95.1) |
0.003 |
| NYHA classification |
|
|
|
|
|
0.110 |
| I |
8/486 (1.6) |
1/150 (0.7) |
4/93 (4.3) |
0/11 (0.0) |
3/232 (1.3) |
|
| II |
385/486 (79.2) |
124/150 (82.7) |
71/93 (76.3) |
11/11 (100.0) |
179/232 (77.2) |
|
| III |
32/486 (6.6) |
6/150 (4.0) |
10/93 (10.8) |
0/11 (0.0) |
16/232 (6.9) |
|
| IV |
61/486 (12.6) |
19/150 (12.7) |
8/93 (8.6) |
0/11 (0.0) |
34/232 (14.7) |
|
| Echocardiographic data |
| Vmax (m/s) |
3.98±0.86 |
4.81±0.54 |
3.35±0.68 |
4.68±0.37 |
3.70±0.68 |
<0.001 |
| pPG (mmHg) |
65.9±27.3 |
93.8±21.8 |
46.5±17.1 |
88.2±13.8 |
55.9±19.1 |
<0.001 |
| mPG (mmHg) |
34.5±17.5 |
54.8±13.2 |
22.4±8.8 |
48.5±6.4 |
26.4±10.2 |
<0.001 |
| AVA (cm2) |
0.71±0.25 |
0.54±0.17 |
1.04±0.22 |
0.90±0.05 |
0.66±0.16 |
<0.001 |
| AVAi (cm2/m2) |
0.49±0.19 |
0.37±0.11 |
0.78±0.16 |
0.66±0.05 |
0.44±0.10 |
<0.001 |
| LVEF (%) |
61.7±13.9 |
61.9±12.7 |
64.9±13.1 |
69.0±5.0 |
59.8±14.8 |
0.004 |
| Low LVEF (<50%) |
89/512 (17.4) |
27/152 (17.8) |
12/105 (11.4) |
0/11 (0.0) |
50/244 (20.5) |
0.087 |
| SV (mL) |
57.9±19.3 |
60.4±19.1 |
65.6±18.8 |
94.6±9.8 |
51.4±16.3 |
<0.001 |
| SVi (mL/m2) |
40.2±13.7 |
40.9±11.8 |
49.0±14.2 |
69.7±6.8 |
34.7±10.7 |
<0.001 |
| Low flow (SVi ≤35 mL/m2) |
197/512 (38.5) |
54/152 (35.5) |
19/105 (18.1) |
0/11 (0.0) |
124/244 (50.8) |
<0.001 |
| LVOT diameter (cm) |
1.97±0.21 |
1.95±0.24 |
1.99±0.16 |
2.08±0.20 |
1.96±0.20 |
0.100 |
| LVOT area (cm2) |
3.07±0.64 |
3.02±0.74 |
3.13±0.49 |
3.43±0.65 |
3.06±0.62 |
0.141 |
| MDCT data |
| AVC (AU) |
1,745.6 [1,118.1–2,618.7] |
2,613.3 [2,049.5–3,534.1] |
1,045.2 [757.4–1,486.8] |
1,854.0 [1,235.2–2,880.1] |
1,584.6 [1,052.7–2,202.5] |
<0.001 |
| AVC density (AU/cm2) |
577.2 [375.1–836.5] |
884.1 [687.5–1,228.8] |
345.1 [253.6–474.0] |
591.7 [393.9–807.7] |
511.0 [372.8–724.4] |
<0.001 |
| AVCi (AU/m2) |
1,198.2 [784.8–1,822.0] |
1,840.5 [1,378.5–2,394.7] |
794.4 [565.7–1,088.2] |
1,379.3 [958.0–2,219.8] |
1,061.3 [748.3–1,479.0] |
<0.001 |
Unless indicated otherwise, data are given as the mean±SD, n/N (%), or median [interquartile range]. Chronic kidney disease (CKD) was defined as estimated glomerular filtration rate (eGFR) <60 mL/min/1.73 m2. AS, aortic stenosis; AU, arbitrary unit; AVA, aortic valve area; AVC, aortic valve calcification; AVCi, AVC indexed to body surface area (BSA); BMI, body mass index; CABG, coronary artery bypass grafting; CG, concordant grading; COPD, chronic obstructive pulmonary disease; Cr, serum creatinine; CT, computed tomography; DBP, diastolic blood pressure; DG, discordant grading; eGFR, estimated glomerular filtration rate; LVEF, left ventricular ejection fraction; LVOT, left ventricular outflow tract; MDCT, multidetector computed tomography; MI, myocardial infarction; mPG, mean pressure gradient; NYHA, New York Heart Association; PCI, percutaneous coronary intervention; pPG, peak pressure gradient; SBP, systolic blood pressure; SV, stroke volume; SVi, SV index; Vmax, peak aortic jet velocity.
For Doppler echocardiographic measurements in the entire cohort, Vmax
was 3.98±0.86 m/s, peak pressure gradient (pPG) was 65.9±27.3 m/s, mPG was 34.5±17.5 mmHg, AVA was 0.71±0.25 cm2, AVAi was 0.49±0.19 cm2/m2, and LVEF was 61.7±13.9%. Patients with CG-severe AS had the highest Vmax, pPG, and mPG, whereas those with CG-moderate AS or DG-low PG had lower Vmax, pPG, and mPG, as expected. Similarly, patients with CG-severe AS had the smallest AVA and AVAi. The DG-low mPG group was characterized by a relatively low-flow state, as shown by the lowest LVEF and SVi among the 4 groups, whereas the DG-high mPG group had the highest LVEF and SVi.
Overall, median AVC was 1,745.6 (IQR 1,118.1–2,618.7) AU, ranging from 253.5 to 7,581.2 AU; median AVC density was 577.2 (IQR 375.1–836.5) AU/cm2, ranging from 96.4 to 2,401.9 AU/cm2; and median AVCi was 1,198.2 (IQR 784.8–1,822.0) AU/m2, ranging from 181.2 to 4,629.4 AU/m2. AVC, AVC density, and AVCi were significantly higher in patients with CG-severe AS than in patients with CG-moderate AS and DG-low mPG AS (Figure 2). Patients with CG-moderate AS had the lowest AVC, AVC density, and AVCi among the 4 groups, although the difference in AVC density between the CG-moderate AS and DG-high mPG AS groups was not significant. The DG-low mPG and DG-high mPG groups had similar AVC, AVC density, and AVCi. The differences among the AS grading groups were similar regardless of sex, although statistically significant differences were more evident in women due to the smaller number of men included in the study (Supplementary Figure 3).
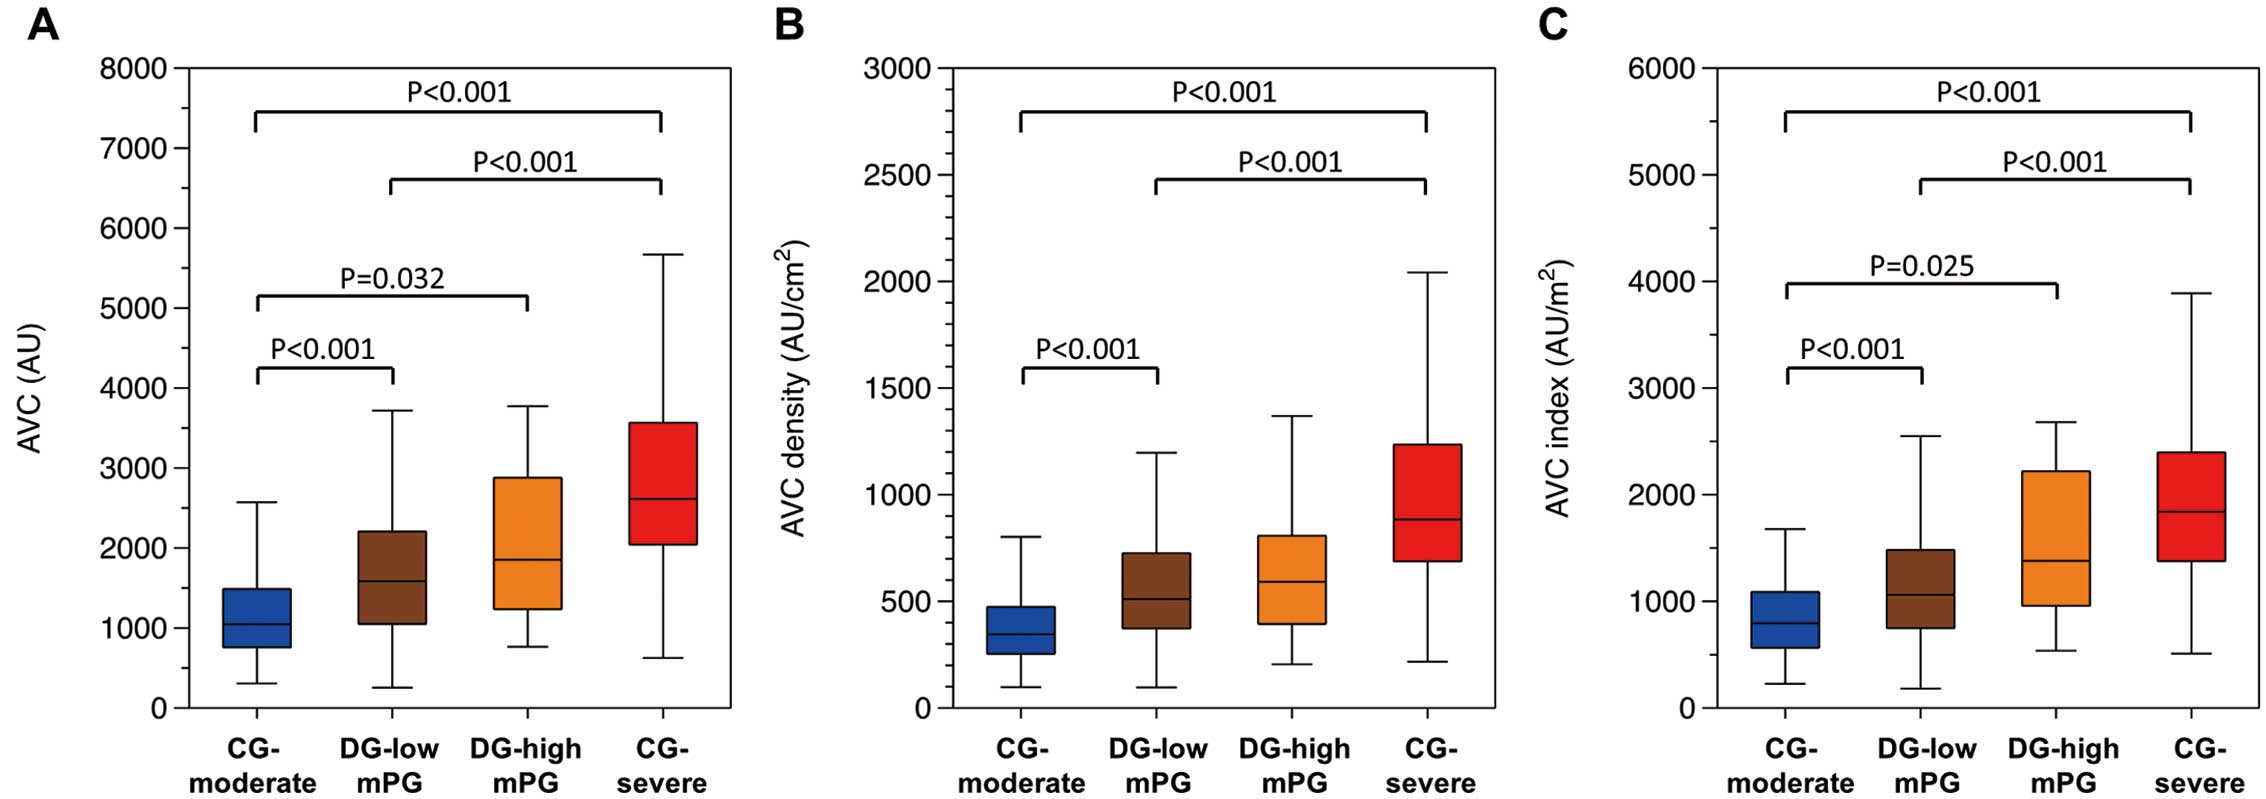
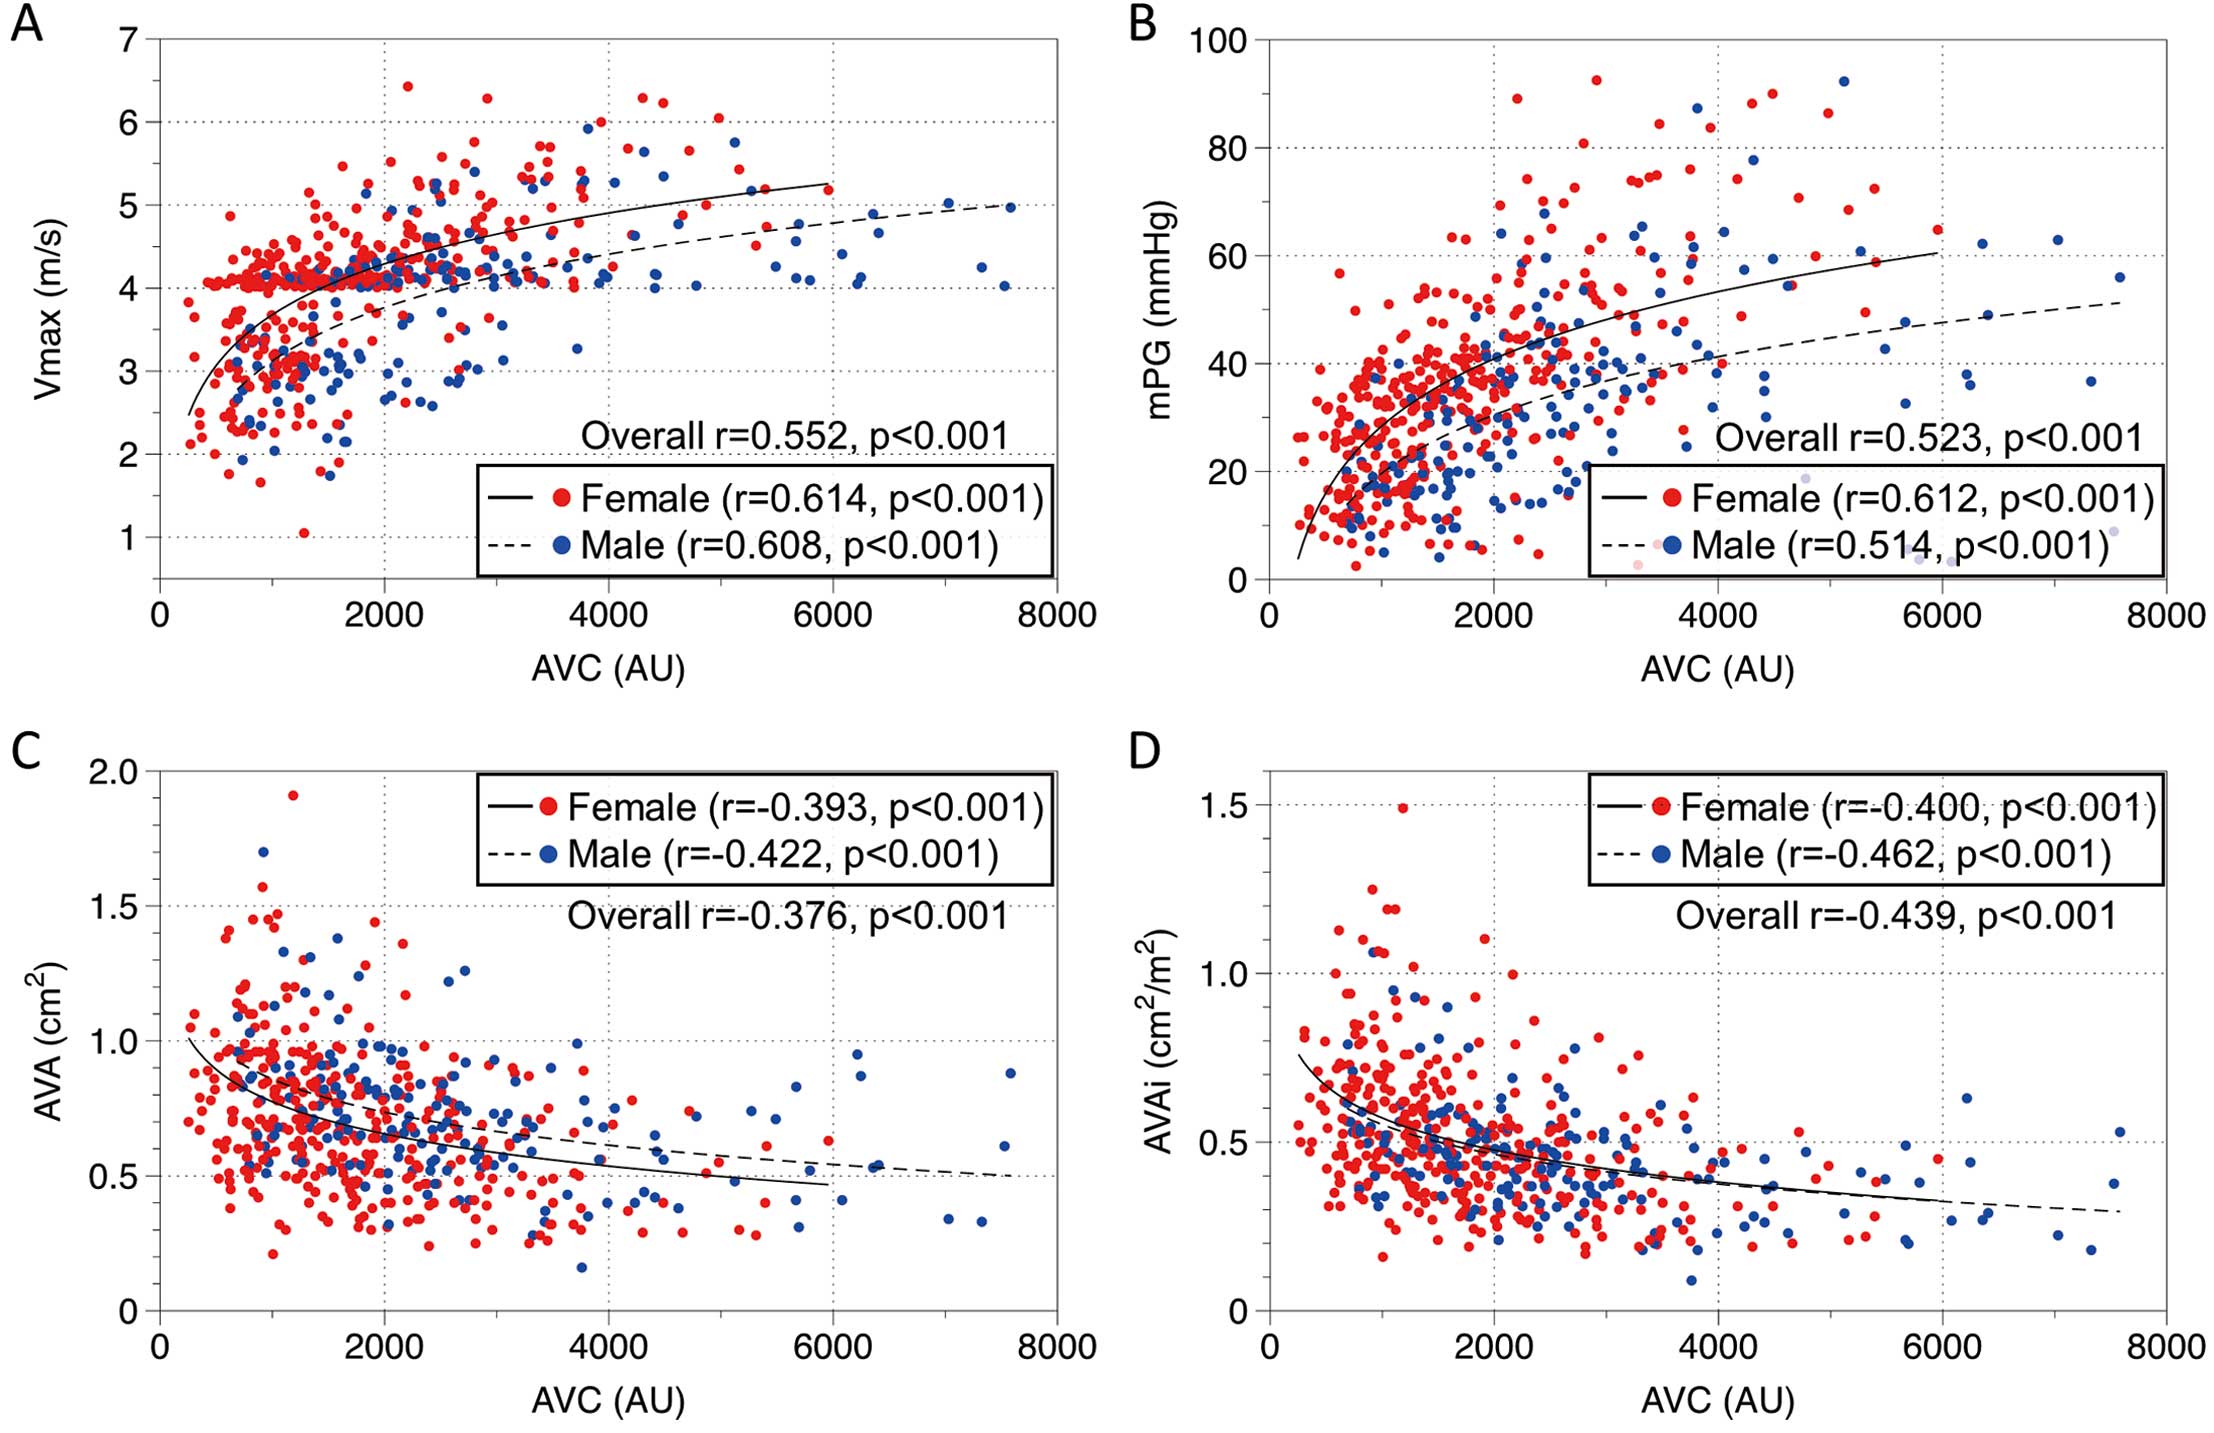
Figure 3 shows the relationship between AVC and hemodynamic measures by Doppler echocardiography. Overall, AVC was positively correlated with Vmax
(r=0.552, P<0.001) and mPG (r=0.523, P<0.001) and negatively correlated with AVA (r=−0.376, P<0.001) and AVAi (r=−0.439, P<0.001), which remained similarly significant when stratified by sex.
AVC, AVC Density, and AVCi for Predicting Severe AS
In the 257 patients with CG AS, ROC curve analyses of AVC, AVC density, and AVCi predicting severe AS were performed separately by sex (Figure 4; Table 2). Overall, in women, AVC (area under the curve [AUC] 0.91; 95% CI 0.87–0.95; P<0.001), AVC density (AUC 0.93; 95% CI 0.90–0.97; P<0.001), and AVCi (AUC 0.90; 95% CI 0.85–0.94; P<0.001) similarly showed excellent discrimination. In men, AVC (AUC 0.86; 95% CI 0.75–0.98; P<0.001), AVC density (AUC 0.88; 95% CI 0.77–0.99; P<0.001), and AVCi (AUC 0.85; 95% CI 0.73–0.97; P<0.001) similarly showed good discrimination. In the subgroup of patients with low LVEF (<50%) or those with low flow (SVi ≤35 mL/m2), AVC, AVC density, and AVCi were similarly discriminative in both sexes.
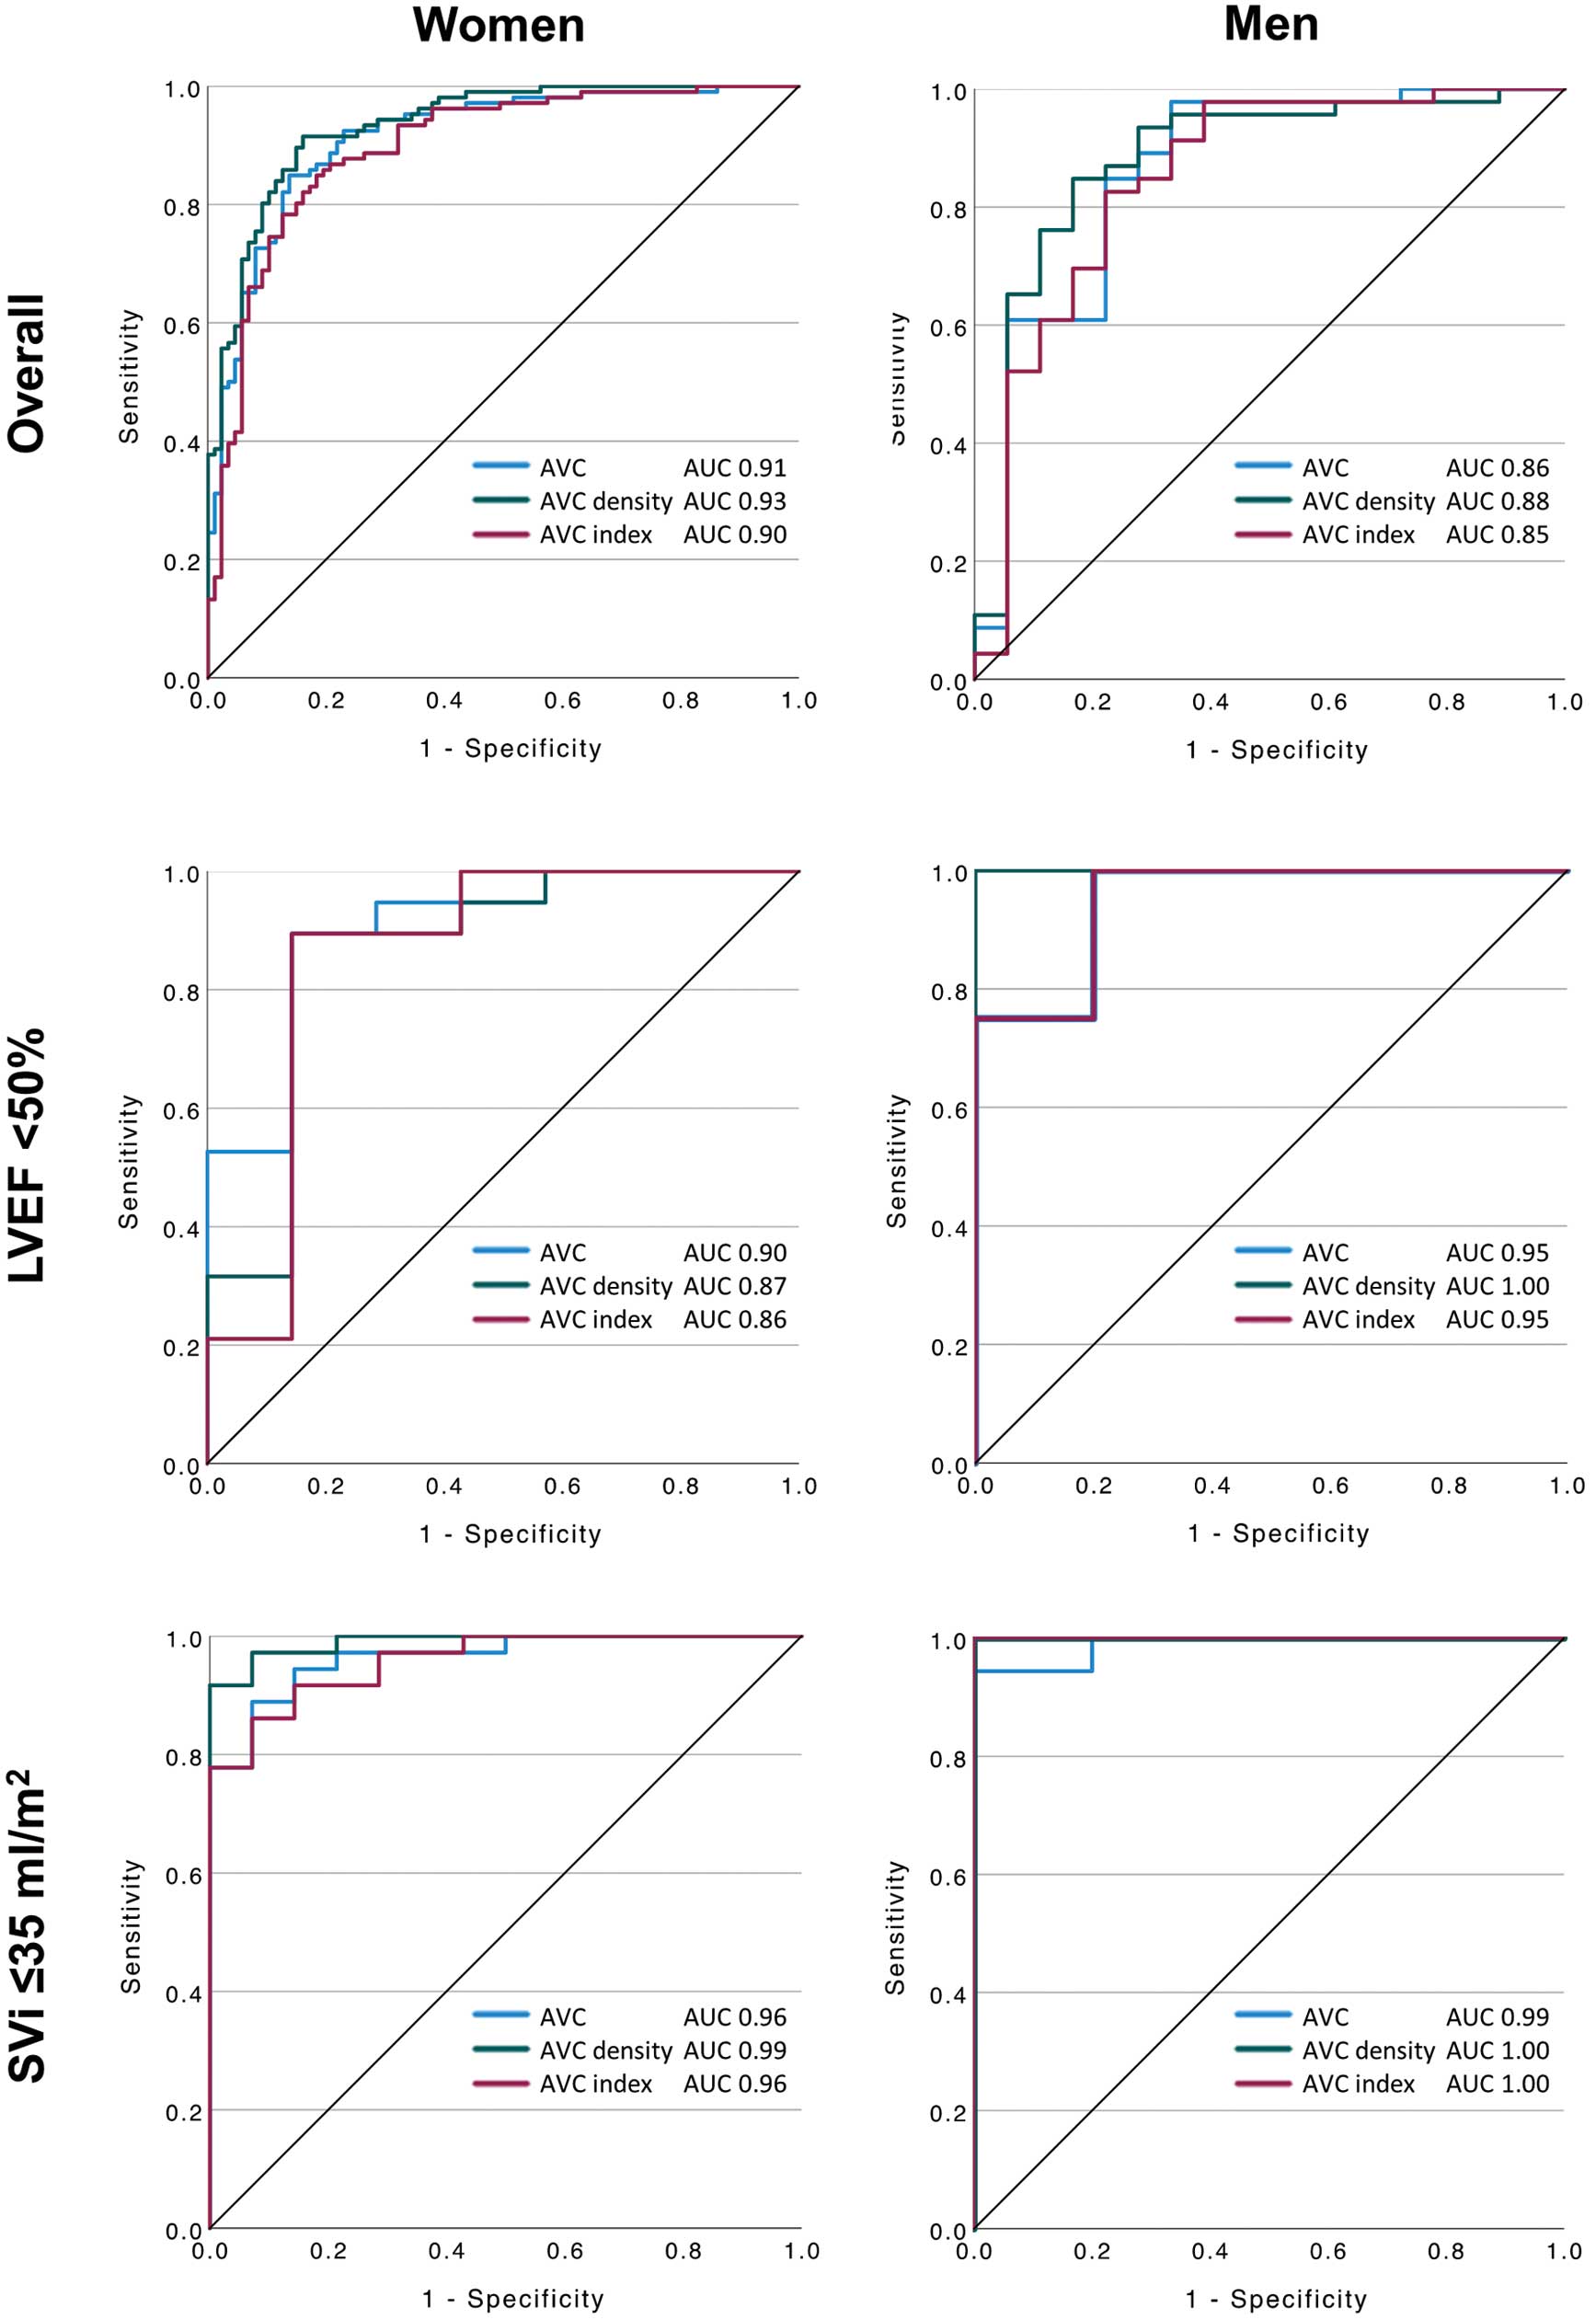
Table 2. AVC Thresholds for Severe AS in Patients With a Concordant AS Grading
| |
Threshold
(AU) |
Sensitivity
(%) |
Specificity
(%) |
PPV
(%) |
NPV
(%) |
Accuracy
(%) |
| Women |
| Overall (n=193; AUC 0.91 [95% CI 0.87–0.95]; P<0.001) |
| Optimal cut-off |
1,379 |
92.5 |
77.0 |
83.1 |
89.4 |
85.5 |
| Guidelines |
1,200 |
95.3 |
65.5 |
77.1 |
92.0 |
81.9 |
| LVEF <50% (n=26; AUC 0.90 [95% CI 0.77–1.00]; P=0.002) |
| Optimal cut-off |
1,723 |
89.5 |
85.7 |
94.4 |
75.0 |
88.5 |
| Guidelines |
1,200 |
100.0 |
42.9 |
82.6 |
100.0 |
84.6 |
| Low flow (SVi ≤35 mL/m2) (n=50; AUC 0.96 [95% CI 0.92–1.00]; P<0.001) |
| Optimal cut-off |
1,401 |
94.4 |
85.7 |
94.4 |
85.6 |
92.0 |
| Guidelines |
1,200 |
97.2 |
57.1 |
85.4 |
88.8 |
86.0 |
| Men |
| Overall (n=64; AUC 0.86 [95% CI 0.75–0.98]; P<0.001) |
| Optimal cut-off |
1,802 |
97.8 |
66.7 |
88.2 |
92.2 |
89.1 |
| Guidelines |
2,000 |
91.3 |
66.7 |
87.5 |
75.0 |
84.4 |
| LVEF <50% (n=13; AUC 0.95 [95% CI 0.83–1.00]; P=0.008) |
| Optimal cut-off |
1,806 |
100.0 |
80.0 |
88.9 |
100.0 |
92.3 |
| Guidelines |
2,000 |
100.0 |
80.0 |
88.9 |
100.0 |
92.3 |
| Low flow (SVi ≤35 mL/m2) (n=23; AUC 0.99 [95% CI 0.95–1.00]; P=0.001) |
| Optimal cut-off |
2,197 |
94.4 |
100.0 |
100.0 |
83.2 |
95.7 |
| Guidelines |
2,000 |
100.0 |
80.0 |
94.7 |
100.0 |
95.7 |
The difference in accuracy between the optimal cut-off and the cut-off proposed in the guidelines was not significant in all the groups tabulated (P>0.05, McNemar’s test). AUC, area under the curve; CI, confidence interval; NPV, negative predictive value; PPV, positive predictive value. Other abbreviations as in Table 1.
Overall, the optimal thresholds (women: 1,379 AU; men: 1,802 AU) were close to those recommended in the guidelines (women: 1,200 AU; men: 2,000 AU), and the diagnostic accuracy was similarly high (P=NS) between the optimal thresholds and the thresholds recommended in the guidelines (Table 2). The optimal thresholds separately analyzed in patients with low LVEF or those with low flow were also close to the thresholds in the guidelines, except for the optimal cut-off of 1,723 AU in female patients with low LVEF.
Optimal thresholds and the diagnostic accuracy of AVC density and AVCi are tabulated in Supplementary Tables 1,2, respectively. In both sexes, when AVC density or AVCi was used, the optimal cut-off for predicting severe AS was higher than the cut-off proposed in the literature14 for the overall CG patients, as well as for CG patients with LVEF <50%, or for those with low flow.
Predictors for Severe AS
In the univariate logistic regression analysis performed in CG AS patients, age, male sex, BSA, dyslipidemia, presentation of syncope, chronic heart failure, SVi, and severe AVC (defined as AVC ≥1,200 AU in women or ≥2,000 AU in men) were significantly associated with severe AS (AVAi ≤0.6 cm/m2
and mPG ≥40 mmHg) (Table 3). Subsequent multivariate analysis revealed that BSA (odds ratio [OR] 40.55; 95% CI 2.36–696.52; P=0.011), SVi (OR 0.96; 95% CI 0.93–0.99; P=0.003), and severe AVC (OR 24.83; 95% CI 10.46–58.91; P<0.001) were significant independent predictors of severe AS.
Table 3. Results of Univariate and Multivariate Logistic Regression Analyses Predicting Severe AS in Patients With a Concordant AS Grading
| |
Univariate analysis |
Multivariate analysis |
| OR |
95% CI |
P value |
OR |
95% CI |
P value |
| Age (per year) |
0.96 |
0.92–0.99 |
0.011 |
0.96 |
0.91–1.01 |
0.136 |
| Male sex |
2.10 |
1.13–3.88 |
0.018 |
0.87 |
0.28–2.68 |
0.806 |
| BSA (per m2) |
74.30 |
14.05–393.05 |
<0.001 |
40.55 |
2.36–696.52 |
0.011 |
| Dyslipidemia |
1.79 |
1.07–2.98 |
0.026 |
1.38 |
0.67–2.84 |
0.383 |
| Presentation |
| Syncope |
0.19 |
0.04–0.92 |
0.039 |
0.59 |
0.09–4.11 |
0.597 |
| Chronic heart failure |
9.68 |
2.12–44.21 |
0.003 |
9.91 |
0.96–102.43 |
0.054 |
| SVi (per mL/m2) |
0.95 |
0.93–0.97 |
<0.001 |
0.96 |
0.93–0.99 |
0.003 |
Severe AVC (≥1,200 AU in women,
≥2,000 AU in men) |
30.45 |
13.89–66.76 |
<0.001 |
24.83 |
10.46–58.91 |
<0.001 |
OR, odds ratio. Other abbreviations as in Table 1.
In patients with DG AS (n=255), median AVC was 1,585.8 (IQR 1,051.2–2,215.6) AU, ranging from 253.51 to 7,527.90 AU. Of these patients, 148 (58.0%) had severe AVC (defined as AVC ≥1,200 AU in women and ≥2,000 AU in men). Of the 50 DG patients with an ejection fraction <50% (i.e., classical LF-LG), 22 underwent dobutamine stress echocardiography (DSE). As a result, 16 patients were diagnosed as having severe AS (9 patients by achieving Vmax
≥4.0 m/s and 7 by projected AVA <1.0 cm2). Severe AVC classified these patients correctly with a sensitivity of 31.3%, specificity of 100.0%, PPV of 100.0%, NPV of 31.3%, and accuracy of 47.6%.
Clinical Implication of AVC in the DG Groups
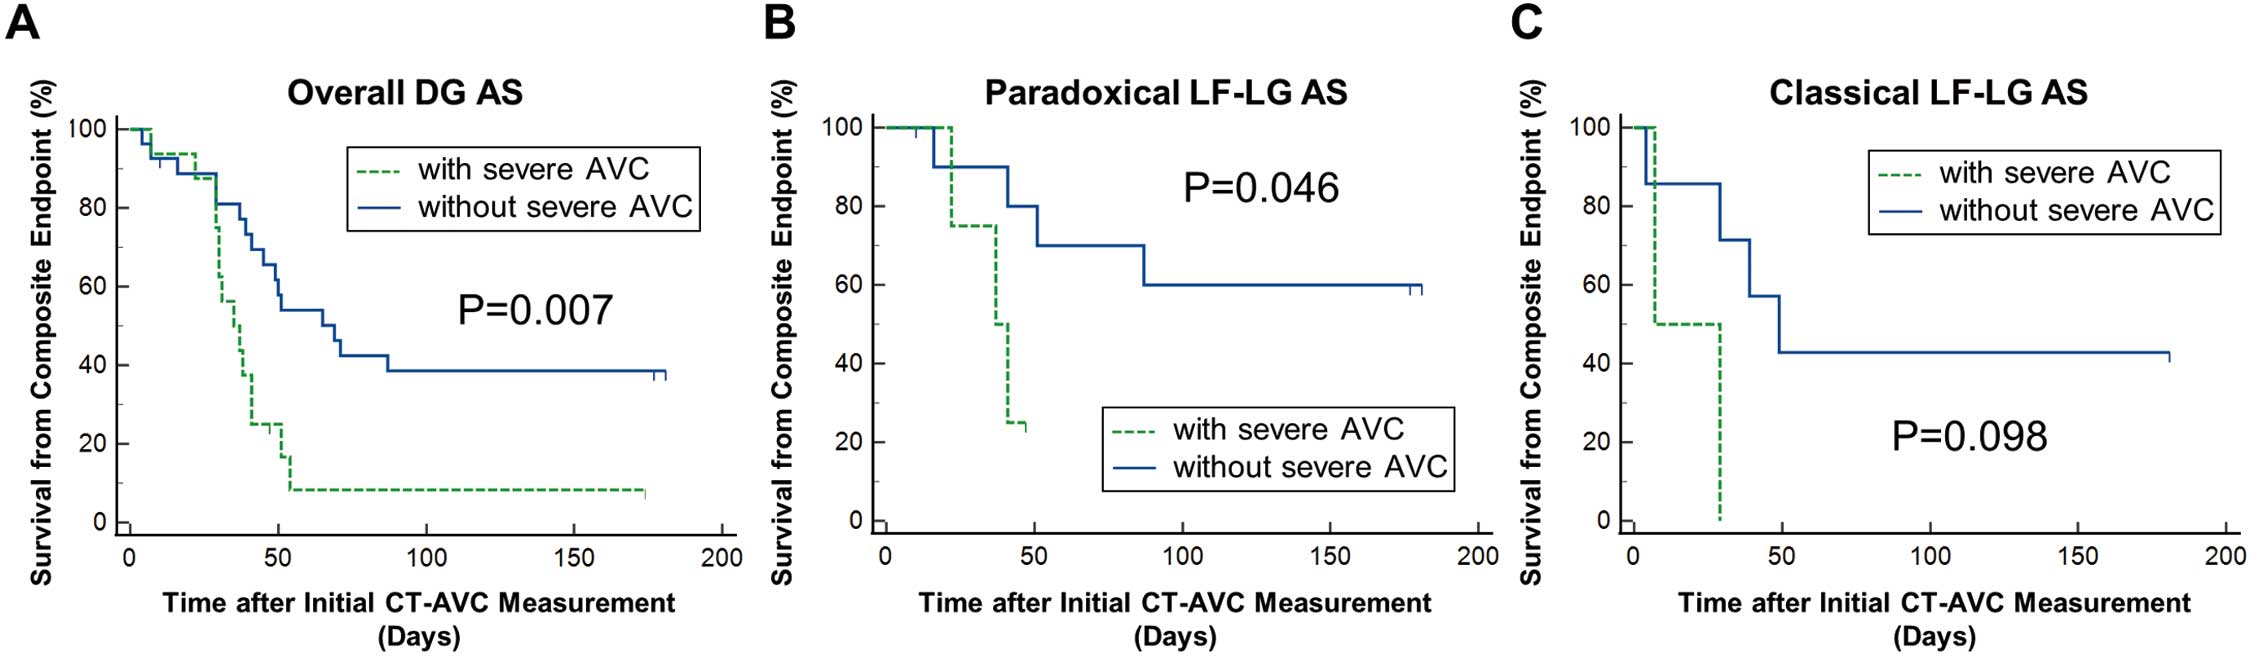
Kaplan-Meier analysis revealed that the cumulative 6-month event-free rate was lower in patients with than without severe AVC (11.1% vs. 37.2%, respectively), and that the risk of the composite endpoint was significantly greater in those with severe AVC (log-rank, P=0.007) (Figure 5). Stratified analyses in paradoxical LF-LG AS (LVEF ≥50%, SVi ≤35 mL/min) similarly showed a significantly greater risk with severe AVC (log-rank, P=0.046), whereas in patients with classical LF-LG AS (LVEF <50%, SVi ≤35 mL/min), the difference between severe and non-severe AVC did not reach statistical significance (log-rank, P=0.098).
Discussion
The salient findings of this study are as follows: (1) AVC, AVC density, and AVCi had excellent diagnostic ability in Japanese AS patients; (2) the optimal AVC thresholds predicting severe AS in women and men were similar to those proposed in the guidelines and previous literature in Caucasian patients; (3) our analysis reconfirmed that AVC was an independent predictor of severe AS; (4) AVC in DG groups was heterogeneous and may be helpful in grading severity in classical LF-LG patients with high specificity and PPV; and (5) severe AVC was associated with clinical adverse outcomes in DG patients.
Analysis in Patients With Concordant AS Grading: Foundation of the AVC Thresholds in the Guidelines
All the international guidelines adopt AVC thresholds of 1,200 AU in women and 2,000 AU in men for predicting severe AS.8–10 These thresholds are based on previous reports mainly from the same group.14–16 In 2013, Clavel et al first proposed sex-specific AVC thresholds (1,274 AU in women and 2,065 AU in men), separating severe and non-severe AS, derived from CG AS patients.14 The strength of the present study is that the ROC curve analysis was performed in the same manner as the analysis of Clavel et al in CG AS patients in order to validate the guideline-recommended thresholds, and thus confirmed their validity in Japanese AS patients. Although the derivation population in the previous study14 consisted of CG AS patients with normal LVEF and normal flow (SVi ≥35 mL/m2), these thresholds were extrapolated to classical/paradoxical LF-LG AS patients in the guidelines, rounded to 1,200 AU in women and 2,000 AU in men for clinical usefulness. This assumption may be valid, considering that AVC above these thresholds has been shown to predict clinical events in patients with low LVEF.16 However, no studies have investigated AVC thresholds specifically in patients with low LVEF or in those with low flow (SVi <35 mL/m2). In the present analysis in these subsets of patients, the thresholds recommended in the guidelines showed similar accuracy to the optimal cut-off derived from the studied patients (Table 2).
A comprehensive subgroup analysis in the CG patients with regard to the optimal cut-offs with 95% CI by the bootstrap method (2,000 resamples with replacement) further confirmed the generalizability of the thresholds (Supplementary Figure 4). Overall, the analysis showed no significant interaction by age, diabetes, hypertension, dyslipidemia, CKD, history of PCI, LVEF, or SVi; however, in patients without hypertension, optimal thresholds were significantly higher than the guideline recommendations for females and lower than those for males. This may be a reflection of the impact of hypertension on AS,20 with different pathophysiology by sex (high prevalence of fibrosis in women and high prevalence of calcification in men),21 but the argument remains speculative due to the limited number of patients without hypertension.
Implication of AVC on Diagnosis and Clinical Outcome in DG AS Patients
In the DG-low mPG patients with low LVEF, AVC showed high specificity and PPV, but had low sensitivity and NPV when DSE was set as a reference. Still, in classical LF-LG patients, DSE is the gold standard and AVC should be used as a complementary test or substitute for DSE when stress testing is inappropriate (e.g., in patients with hemodynamic instability or in whom the use of dobutamine is contraindicated).
Furthermore, severe AVC was associated with a clinical adverse outcome, defined as a composite of death, TAVI, and AVR in DG patients. The statistical relationship between severe AVC and the clinical endpoint was retained when the analysis was further stratified into paradoxical LF-LG AS; however, in the case of classical LF-LG AS, the number of patients included in the analysis was limited because DSE-positive patients were directly referred to TAVI or AVR, resulting in their exclusion from the outcome analysis. In the present retrospective observational study, the decision to proceed with TAVI or AVR was made according to the current guidelines. Indeed, 97.3% (144/148) of patients with severe AVC were referred to TAVI or AVR, whereas 85.0% (91/107) of patients without severe AVC were also referred to TAVI or AVR within 6 months after the initial CT scan due to follow-up echocardiography being compatible with severe AS (integrated interpretation including not only AVAi and mPG, but also AVA and Vmax) or a positive DSE test. Thus, due to the small number of patients followed up conservatively, it was not feasible to derive an optimal AVC threshold for treatment guidance directly from DG patients. Although TAVI or AVR in DG patients with non-severe AVC is not supported by the available evidence, an eventual occurrence of TAVI or AVR suggests that close follow-up is of importance even if the patient is initially diagnosed as DG with non-severe AVC. Well-designed prospective interventional studies are needed to elucidate whether treatment guidance by AVC confers clinical benefit in DG patients.
Previous Evidence From Japan
To date, clinical evidence showing the diagnostic and prognostic value of AVC in AS patients was derived mainly from Caucasian patients. In the Japanese population, Shimizu et al reported a correlation between AVC and Doppler echocardiographic measures (i.e., Vmax, mPG, AVA, and AVAi).17 However, the studied patients were not limited to those with AS, resulting in a low prevalence rate (none–mild AS, 91.3%; moderate AS, 3.5%; and severe AS, 5.2%). Furthermore, the cut-off value of AVC to predict severe AS (1,596.5 AU) was derived from the overall population, not stratified by sex.17 Although that study already showed the relevance of AVC in predicting severe AS in the Japanese population, it is likely inappropriate to use their single threshold regardless of sex in the severity grading of AS. Regarding clinical implications, Utsunomiya et al have shown that AVC, AVA, and multivessel coronary artery disease are independently associated with cardiac events in Japanese AS patients (n=64).22 Together with these data, we believe that the present study will be part of the basis of guideline recommendations in Japan.
Advantage of AVC Measured by MDCT
AVC, rather than AVC density or AVCi, should remain the standard method to evaluate the degree of calcification in Japanese AS patients for several reasons. In our analyses, the optimal thresholds of AVC were similar to the thresholds in the guidelines. In contrast, the optimal thresholds of AVC density and AVCi tended to be higher than those in a previous study.14 This may be explained by the smaller cardiac or body size in Japanese patients compared with Caucasian patients. However, the diagnostic ability of these 3 indices was not different, as shown in the ROC analyses. Recently, Guzzetti et al compared AVC thresholds in Asian and Caucasian populations and concluded that AVC density performed better than AVC in terms of diagnostic accuracy.23 This is in contrast to the results of the present study; however, Japanese patients were not included in that study. We believe that the adoption of AVC throughout the international guidelines with the same thresholds would be more comprehensive. Another reason is that although AVC density and AVCi need to be calculated using the LVOT area and BSA, respectively, absolute AVC is easy to interpret, which is of importance in daily clinical practice.
The crucial advantages of AVC analysis include its independence from hemodynamic status, the fact that it does not require any stress or the administration of contrast or cardiovascular agents (i.e., nitroglycerine or β-blockers), and that it can be performed in a relatively quick and reproducible manner.24 Conversely, Doppler echocardiography is inconclusive in a substantial population (~50%) and can be challenging in patients with poor echographic windows due to obesity or chronic obstructive pulmonary disease. AVC has diagnostic implications, especially in those with DG, and is complementary to Doppler echocardiography. Moreover, AS patients who are potential candidates for TAVI usually undergo MDCT screening to determine the type and size of the valve to be implanted and to evaluate the access route. Thus, measuring AVC can be implemented in streamlined care. In addition, AVC may be of interest in other ways, such as its relationships with paravalvular regurgitation and prosthetic valve distortion after TAVI.25,26
Study Limitations
This study has certain limitations. The ROC analyses focused on the CG population, the purest set of patients, leaving little room to doubt the severity of AS. The method for estimating ROC curves and subsequent analysis of the optimal cut-off rely on the existence of a gold standard that dichotomizes patients into disease-present or -absent groups. Conversely, from a clinical perspective, it is challenging to define the presence of severe AS, especially in a paradoxical LF-LG population. Therefore, we had to extrapolate the thresholds derived from CG patients to DG patients. The ROC analysis in the low LVEF and low flow subgroups needs to be interpreted with caution. Although both were statistically discriminative, the analysis included a limited number of patients, resulting in a wide range of CIs in the bootstrap analysis of the optimal threshold. Nevertheless, no interaction between LVEF/SVi and AVC was evident.
This study was conducted retrospectively and did not focus on long-term prognosis. Further investigations are warranted in longitudinal studies to correlate sex-specific AVC thresholds and clinical outcome data in the Japanese population. This study included more women (67.2%) than men, reflecting the general AS population in Japan.27,28 In some patients with continuity of calcification between the aortic valve and adjacent structures (e.g., LVOT, coronary artery ostium, or mitral valve), it is difficult to decide where exactly the aortic valve stops and the adjacent structures begin. Another limitation of MDCT is that it only measures valvular calcification and not valvular fibrosis, which may yield false-negative results in younger patients with bicuspid AS. However, the patients included in this study were relatively old.
Conclusions
The same sex-specific AVC thresholds (1,200 AU in women and 2,000 AU in men) as proposed in the international guidelines can be applied in Japanese AS patients, yielding similar diagnostic accuracy as the optimal cut-off value directly derived from the study patients. Severe AVC was associated with clinical adverse outcome in paradoxical LF-LG AS patients. These findings strengthen the basis of the recommendations in the Japanese guidelines.
Acknowledgments
The authors thank all the staff in the Radiology and Echography departments of Sapporo Higashi Tokushukai Hospital and Miki Tamura for data extraction of echocardiographic measurements.
Sources of Funding
This study did not receive any specific funding.
Disclosures
K.Y. serves as a TAVI proctor for Edwards Lifesciences and Medtronic. All other authors declare that they have no conflicts of interest.
IRB Information
This study was approved by the Tokushukai Group Ethics Committee (Reference no. TGE1702-012).
Data Availability
The deidentified participant data will not be shared.
Supplementary Files
Please find supplementary file(s);
http://dx.doi.org/10.1253/circrep.CR-22-0035
References
- 1.
Schwarz F, Baumann P, Manthey J, Hoffmann M, Schuler G, Mehmel HC, et al. The effect of aortic valve replacement on survival. Circulation 1982; 66: 1105–1110.
- 2.
Cribier A, Eltchaninoff H, Bash A, Borenstein N, Tron C, Bauer F, et al. Percutaneous transcatheter implantation of an aortic valve prosthesis for calcific aortic stenosis: First human case description. Circulation 2002; 106: 3006–3008.
- 3.
Smith CR, Leon MB, Mack MJ, Miller DC, Moses JW, Svensson LG, et al. Transcatheter versus surgical aortic-valve replacement in high-risk patients. N Engl J Med 2011; 364: 2187–2198.
- 4.
Popma JJ, Adams DH, Reardon MJ, Yakubov SJ, Kleiman NS, Heimansohn D, et al. Transcatheter aortic valve replacement using a self-expanding bioprosthesis in patients with severe aortic stenosis at extreme risk for surgery. J Am Coll Cardiol 2014; 63: 1972–1981.
- 5.
Mack MJ, Leon MB, Thourani VH, Makkar R, Kodali SK, Russo M, et al. Transcatheter aortic-valve replacement with a balloon-expandable valve in low-risk patients. N Engl J Med 2019; 380: 1695–1705.
- 6.
Popma JJ, Deeb GM, Yakubov SJ, Mumtaz M, Gada H, O’Hair D, et al. Transcatheter aortic-valve replacement with a self-expanding valve in low-risk patients. N Engl J Med 2019; 380: 1706–1715.
- 7.
Clavel MA, Magne J, Pibarot P. Low-gradient aortic stenosis. Eur Heart J 2016; 37: 2645–2657.
- 8.
Izumi C, Eishi K, Ashihara K, Arita T, Otsuji Y, Kunihara T, et al. JCS/JSCS/JATS/JSVS 2020 guidelines on the management of valvular heart disease. Circ J 2020; 84: 2037–2119.
- 9.
Baumgartner H, Falk V, Bax JJ, De Bonis M, Hamm C, Holm PJ, et al. 2017 ESC/EACTS guidelines for the management of valvular heart disease. Eur Heart J 2017; 38: 2739–2791.
- 10.
Otto CM, Nishimura RA, Bonow RO, Carabello BA, Erwin JP 3rd, Gentile F, et al. 2020 ACC/AHA guideline for the management of patients with valvular heart disease: A report of the American College of Cardiology/American Heart Association Joint Committee on Clinical Practice Guidelines. Circulation 2021; 143: e72–e227.
- 11.
Messika-Zeitoun D, Aubry MC, Detaint D, Bielak LF, Peyser PA, Sheedy PF, et al. Evaluation and clinical implications of aortic valve calcification measured by electron-beam computed tomography. Circulation 2004; 110: 356–362.
- 12.
Linde L, Carter-Storch R, Christensen NL, Øvrehus KA, Diederichsen ACP, Laursen K, et al. Sex differences in aortic valve calcification in severe aortic valve stenosis: Association between computer tomography assessed calcification and valvular calcium concentrations. Eur Heart J Cardiovasc Imaging 2021; 22: 581–588.
- 13.
Aggarwal SR, Clavel MA, Messika-Zeitoun D, Cueff C, Malouf J, Araoz PA, et al. Sex differences in aortic valve calcification measured by multidetector computed tomography in aortic stenosis. Circ Cardiovasc Imaging 2013; 6: 40–47.
- 14.
Clavel MA, Messika-Zeitoun D, Pibarot P, Aggarwal SR, Malouf J, Araoz PA, et al. The complex nature of discordant severe calcified aortic valve disease grading: New insights from combined Doppler echocardiographic and computed tomographic study. J Am Coll Cardiol 2013; 62: 2329–2338.
- 15.
Clavel MA, Pibarot P, Messika-Zeitoun D, Capoulade R, Malouf J, Aggarval S, et al. Impact of aortic valve calcification, as measured by MDCT, on survival in patients with aortic stenosis: Results of an international registry study. J Am Coll Cardiol 2014; 64: 1202–1213.
- 16.
Pawade T, Clavel MA, Tribouilloy C, Dreyfus J, Mathieu T, Tastet L, et al. Computed tomography aortic valve calcium scoring in patients with aortic stenosis. Circ Cardiovasc Imaging 2018; 11: e007146.
- 17.
Shimizu K, Yamamoto M, Koyama Y, Kodama A, Sato H, Kano S, et al. Usefulness of routine aortic valve calcium score measurement for risk stratification of aortic stenosis and coronary artery disease in patients scheduled cardiac multislice computed tomography. Int J Cardiol Heart Vasc 2015; 9: 95–99.
- 18.
Baumgartner HC, Hung JC-C, Bermejo J, Chambers JB, Edvardsen T, Goldstein S, et al. Recommendations on the echocardiographic assessment of aortic valve stenosis: A focused update from the European Association of Cardiovascular Imaging and the American Society of Echocardiography. Cardiovasc Imaging 2017; 18: 254–275.
- 19.
Agatston AS, Janowitz WR, Hildner FJ, Zusmer NR, Viamonte M Jr, Detrano R. Quantification of coronary artery calcium using ultrafast computed tomography. J Am Coll Cardiol 1990; 15: 827–832.
- 20.
Chu Y, Lund DD, Doshi H, Keen HL, Knudtson KL, Funk ND, et al. Fibrotic aortic valve stenosis in hypercholesterolemic/hypertensive mice. Arterioscler Thromb Vasc Biol 2016; 36: 466–474.
- 21.
Simard L, Côté N, Dagenais F, Mathieu P, Couture C, Trahan S, et al. Sex-related discordance between aortic valve calcification and hemodynamic severity of aortic stenosis: Is valvular fibrosis the explanation? Circ Res 2017; 120: 681–691.
- 22.
Utsunomiya H, Yamamoto H, Kitagawa T, Kunita E, Urabe Y, Tsushima H, et al. Incremental prognostic value of cardiac computed tomography angiography in asymptomatic aortic stenosis: Significance of aortic valve calcium score. Int J Cardiol 2013; 168: 5205–5211.
- 23.
Guzzetti E, Oh JK, Shen M, Dweck MR, Poh KK, Abbas AE, et al. Validation of aortic valve calcium quantification thresholds measured by computed tomography in Asian patients with calcific aortic stenosis. Eur Heart J Cardiovasc Imaging 2022; 23: 717–726.
- 24.
Cueff C, Serfaty JM, Cimadevilla C, Laissy JP, Himbert D, Tubach F, et al. Measurement of aortic valve calcification using multislice computed tomography: Correlation with haemodynamic severity of aortic stenosis and clinical implication for patients with low ejection fraction. Heart 2011; 97: 721–726.
- 25.
Haensig M, Lehmkuhl L, Rastan AJ, Kempfert J, Mukherjee C, Gutberlet M, et al. Aortic valve calcium scoring is a predictor of significant paravalvular aortic insufficiency in transapical-aortic valve implantation. Eur J Cardiothorac Surg 2012; 41: 1234–1240; discussion 1240–1241.
- 26.
Nakajima A, Naganuma T, Yuki H, Onishi H, Amano T, Yabushita H, et al. The impact of aortic valvular calcium on transcatheter heart valve distortion. J Interv Cardiol 2021; 2021: 8829906.
- 27.
Toyofuku M, Taniguchi T, Morimoto T, Yamaji K, Furukawa Y, Takahashi K, et al. Sex differences in severe aortic stenosis: Clinical presentation and mortality. Circ J 2017; 81: 1213–1221.
- 28.
Yamamoto M, Watanabe Y, Tada N, Naganuma T, Araki M, Yamanaka F, et al. Transcatheter aortic valve replacement outcomes in Japan: Optimized CathEter vAlvular iNtervention (OCEAN) Japanese multicenter registry. Cardiovasc Revasc Med 2019; 20: 843–851.