Pediatric Cardiology and Adult Congenital Heart Disease
Echocardiographic Reference Ranges of Non-Invasive Myocardial Work Indices in Newborns
2022 年 4 巻 9 号 p. 429-438

詳細
2022 年 4 巻 9 号 p. 429-438
Background: Myocardial work (MCW), estimated using non-invasive pressure-strain loops, is a novel approach for assessing left ventricular function. MCW offers potential advantages over left ventricular ejection fraction and global longitudinal strain (GLS). This study aimed to establish a reference range for MCW in newborns.
Methods and Results: Overall, 113 healthy newborns (mean [±SD] birth weight 3,120±378 g) were included in the study. After entering peripheral systolic and diastolic blood pressure (BP) values, global constructive work (GCW), global work index (GWI), global work efficiency (GWE), and global wasted work (GWW) were calculated using EchoPAC software (version 204). Considering a mean [±SD] GLS of −16.3±2.8%, the mean [±SD] GWI, GCW, GWW, and GWE was 698.7±147.9 mmHg%, 1,008.5±200.1 mmHg%, 58.1±28.1 mmHg%, and 93.1±2.9%, respectively. All MCW parameters in newborns were lower than those previously reported in children and adults. However, GWI and GCW were more closely correlated with BP and GLS, as in adulthood and children. Estimation of the correlation between MCW and the frame rate index revealed no significant correlations among MCW parameters.
Conclusions: Cardiac function in newborns was evaluated by assessing MCW. With the establishment of reference ranges and normative MCW data for newborns, routine clinical use and rotational mechanics are likely to become increasingly common. Future studies are needed to determine whether MCW is useful in screening for cardiac illness among newborns.
Characterization of myocardial adaptation during the critical period of transition from fetal to neonatal circulation is important for the recognition and management of circulatory disturbances.1 Weight, gestational age, and chronological age are major determinants of cardiac function on echocardiography during the newborn period and in early infancy, for which normative values have been published.2 Nonetheless, myocardial structure and function differ significantly among newborns, children, and adults.3 Advances in newborn cardiac imaging have enabled more comprehensive assessments of myocardial function in newborns, which could not be achieved previously using conventional imaging. Myocardial deformation analysis is an emerging quantitative echocardiographic technique for characterizing global and regional ventricular function in newborns.4–6
Myocardial deformation analysis is influenced by several factors that should be considered when using echocardiography in clinical practice. Specifically, the preload and afterload (which increase and decrease the wall strain, respectively) affect the global and regional strains.7 Myocardial work (MCW), estimated using non-invasive pressure-strain loops, is a novel approach for assessing cardiac function.8 MCW overcomes the load dependency of the left ventricular (LV) ejection fraction (LVEF) and LV global longitudinal strain (GLS) by integrating the afterload into an LV function parameter. An increased afterload may lead to a decreased GLS, which does not necessarily signify impaired contraction. In a preclinical model, an increasing afterload induced a decrease in GLS, whereas no change was observed in the non-invasive pressure-strain loops.9 The rapidly growing interest in MCW in adulthood may be partly attributable to its ability to compensate for loading conditions, thereby providing a more realistic assessment of myocardial function. The incorporation of afterload and GLS in myocardial mechanics enables a more refined quantification of myocardial performance than that achieved with GLS alone. In addition, MCW assessment is not confined to systole, providing an important assessment of myocardial relaxation.10 Edwards et al showed that MCW was superior to and more sensitive than GLS in predicting significant coronary artery disease in patients with no regional wall motion abnormality and preserved LVEF.11 This new sensitive indicator is highly effective in detecting cardiac dysfunction in various childhood and newborn cardiac diseases, including Kawasaki disease12 and preterm birth.13 The reference range for MCW data has been reported to vary with age.14–16 Routine application of MCW requires knowledge of normal reference values; however, MCW data in newborns are limited. Therefore, the present study aimed to establish a reference range for MCW in newborns.
This study was an observational retrospective cohort study. The study population comprised newborns admitted in the Department of Pediatrics at Chutoen Medical Center between June 2017 and December 2021. The exclusion criteria were as follows: admission to the neonatal intensive care unit for disease treatment; low birth weight (LBW; <2,500 g); preterm birth with a gestational age <37 weeks (preterm); low blood glucose levels (<40 mg/dL) after birth; congenital heart disease (CHD); a diagnosis of small for gestational age or large for gestational age, defined as a birth weight <10th or >90th percentile for gestational age, respectively;17 a 5-min Apgar score <7 (neonatal asphyxia); and other neonatal pathological disorders.
The study protocol conformed to the principles of the Declaration of Helsinki and was approved by the Ethics Committee of Chutoen Medical Center (approval date January 25, 2022; Approval no. 117). Using the opt-out approach, informed consent was obtained from the guardians of all subjects in accordance with the Japanese Ethical Guidelines for Medical and Health Research Involving Human Subjects. The explanation for this study was posted on our web homepage, and data for subjects whose guardians opted out of the study were excluded from analysis.
Data CollectionBaseline demographic and clinical data were collected from the medical records of all participants. At the Department of Pediatrics at Chutoen Medical Center, newborn screening is performed using 2-dimensional (2D) and color Doppler echocardiography.18 With subjects at rest, echocardiography was performed using a Vivid S5 or Vivid S60N cardiac ultrasound system (GE Healthcare Japan, Tokyo, Japan) with a 6S or 12S sector array transducer. All newborns underwent routine echocardiography at a mean age of 1.4 days after birth. The stored digital scans were analyzed using a commercially available software package (automated functional imaging; EchoPAC version 204; GE Healthcare) by an expert blinded to the subjects’ details.
Global MCW AnalysisFigure 1 shows the process of determining MCW. GLS values were obtained from apical 2-, 3-, and 4-chamber images. Because changes in the heart rate (HR) during the examination may affect loop area, we visually verified these time points in the apical 3-chamber view and manually adjusted them, as necessary. After entering peripheral systolic (SBP) and diastolic blood pressure (DBP) values, the software calculated the constructive and wasted work. By aggregating the segmental values for the constructive and wasted work, the software calculated the global constructive work (GCW; mmHg%) and global wasted work (GWW; mmHg%) as the mean of the respective segmental values. In addition, the software provided the global work index (GWI; mmHg%) and global work efficiency (GWE; %), calculated as follows:10

Myocardial work (MCW) indices derived from 2-dimensional echocardiography. (A) Left ventricular pressure (LVP)–strain loop. (B) Bar graph showing global constructive work (GCW) and global wasted work (GWW). (C) Bull’s eye of global work efficiency (GWE). ANT, anterior; INF, inferior; LAT, lateral; POST, posterior; SEPT, septal. (D) MCW analysis. BP, blood pressure; GLS, global longitudinal strain; GWI, global work index.
GWE = GCW / (GCW + GWW)
GWI is defined as the total work performed by the LV during mechanical systole (mitral valve closure after mitral valve opening), isovolumetric contraction, and isovolumetric relaxation (IVR) and is reflected by the area within the pressure-strain loop. Given that “work” is defined as force times length, the use of pressure and strain does not allow a direct measure of work; instead, an index is derived. GCW refers to the productive work performed by the LV during systole and includes both shortening of the muscle during systole and lengthening of the muscle in IVR. In contrast, GWW refers to the non-productive work performed by the LV during systole and includes both lengthening of the muscle during systole and shortening of the muscle in IVR. Wasted work occurs during dyssynchronous contractions, which may occur during bundle branch block, myocardial ischemia, and some other myocardial diseases. Wasted work adds a metabolic burden to the ventricle that may contribute to adverse remodeling.
Other MeasurementsCharacterizing myocardial adaptation with echocardiography is important for the identification and management of circulatory disturbances during the critical periods of development in newborns.1 In the present study we investigated the association of MCW with as many standard systolic and diastolic functions that can possibly be assessed using echocardiography, including new cardiac functions, such as layer-specific 2D speckle-tracking echocardiography (STE) strain, intraventricular pressure differences (IVPD), and intraventricular pressure gradients (IVPG) using color M-mode images, to establish and interpret normal values of MCW in the neonatal period. Measurements from basic 2D echocardiograms were obtained using standard procedures.19 The 2D STE was performed retrospectively using blinded patient data. Manual tracing of the endocardial border during end-systole was performed in 3 apical views and at 3 levels of the short-axis views to measure the longitudinal and circumferential strains. The software performed speckle tracking over the entire myocardium included in the region of interest, allowing for assessment of the relationship between layer-specific strain parameters and fundamental anthropometric variables. Subsequently, the software determined the strain values in the transmural and endocardial locations, epicardial strain, and the ratio of endocardial longitudinal (circumferential) strain at end-systole GL(C)S to epicardial GL(C)S. This recently introduced STE technology enables non-invasive bedside assessment of layer-specific myocardial deformations.20,21
End-diastolic (EDV) and end-systolic (ESV) volume were estimated using Simpson’s biplane method by tracing the endocardial border in apical 4- and 2-chamber views of the LV at end-diastole and end-systole, respectively. Stroke volume (SV) was obtained using Simpson’s biplane method by subtracting ESV from EDV. End-systolic pressure (ESP) was calculated as follows: ESP = SBP × 0.9.22 Furthermore, arterial elastance (Ea) and end-systolic elastance (Ees) were calculated.23 Subsequently, the Ea/Ees ratio was obtained and used as an index of ventricular–arterial coupling (VAC).
IVPD and IVPG were estimated using color M-mode images to integrate the 1-dimensional Euler equation, as described previously.24 The images were obtained in the same apical 4-chamber view that was used to assess LVEF and mitral motion. Flow velocity color M-mode images were acquired by aligning the Doppler cursor in parallel with the diastolic inflow and were analyzed using MATLAB (MathWorks, Natick, MA, USA) and an image processing algorithm. This method has been previously validated against direct micromanometer measurements.25,26 IVPD showed excellent correlation with the tau index, which is the gold-standard (albeit invasive) technique for evaluating diastolic function.27 Furthermore, IVPD and IVPG could be determined using color M-mode images for the non-invasive estimation of active suction during the neonatal period.6 IVPD and IVPG measurements using color M-mode images are reported to be accurate and reproducible.24
Baseline BP and Cord Blood ExaminationsBP measurements in newborns were performed in the left or right leg, with subjects in a relaxed supine position, at the time of echocardiographic evaluation. Data from umbilical cord blood sampling immediately after birth could be useful from medical and medicolegal perspectives, because they could provide insight into intrapartum fetal physiology. Cord blood was collected from a double-clamped cord and analyzed within 15 min after collection.28 Instrumentation laboratory blood gas analysis was performed using RAPIDPoint 500 (Siemens Healthineers, Tokyo, Japan).
OutcomesThe primary outcome of this study was the assessment of MCW in newborns. Secondary outcomes were estimates the correlations between non-invasive MCW and other hemodynamic parameters, including the frame per second (FPS) and FPS/HR ratio.
Reproducibility of MeasurementsBecause this was an observational retrospective cohort study, the results required validation by a prospective evaluation in a small patient cohort. To test for intra- and interobserver variability, measurements in 20 randomly selected newborns were recorded by 2 independent observers (Y.Y. and S.I.) and by 1 observer on 2 different occasions.
Data AnalysisResults are expressed as the mean±SD and 95% confidence intervals (CIs). Pearson’s correlation coefficient was used to evaluate the relationship between MCW and other findings. Variables that were deemed to be significant in the univariate analysis were used in multivariate analysis. Multivariable linear regression analyses were performed to examine the independent correlation of MCW parameters with standard and advanced echocardiographic parameters. Intraobserver reliability was tested using intraclass correlation coefficients (ICCs). Intraobserver variability was assessed using 1-way analysis of variance (ANOVA), whereas interobserver reliability was examined using 2-way ANOVA. All statistical analyses were performed using IBM SPSS Statistics software version 28 (IBM Corp., Armonk, NY, USA). Significance was set at 2-tailed P<0.05.
Figure 2 shows the flowchart for the study. In all, 2,804 newborns underwent echocardiographic screening for CHD during the study period. Due to the limited time spent on screening, cardiac function could not be measured in all newborns. We retrospectively estimated the cardiac function of newborns who had stable HR variability for approximately 20 min and made no physical movements for approximately 10 min during the screening test. Consequently, the present study recruited 249 newborns. Initially, 16 newborns with CHD (including 14 with ventricular septal defects and 2 with other CHDs) and 92 with a normal heart structure who had any pathological disease (39 with LBW, 28 with low blood glucose levels after birth, 9 with transient tachypnea of the newborn, 7 with neonatal asphyxia, 4 with maternal thyroid disease, 2 preterm infants, and 3 with other newborn pathological disorders) were excluded from the study. In addition, 25 newborns in whom either image quality was insufficient such that the 4-, 2-, or 3-chamber views required for fundamental evaluation were not obtained or in whom HR changed during the examination and another 3 newborns with outlier values due to inappropriate tracking were excluded. Baseline characteristics and echocardiographic parameters are summarized in Tables 1 and 2 and in Supplementary Table 1.
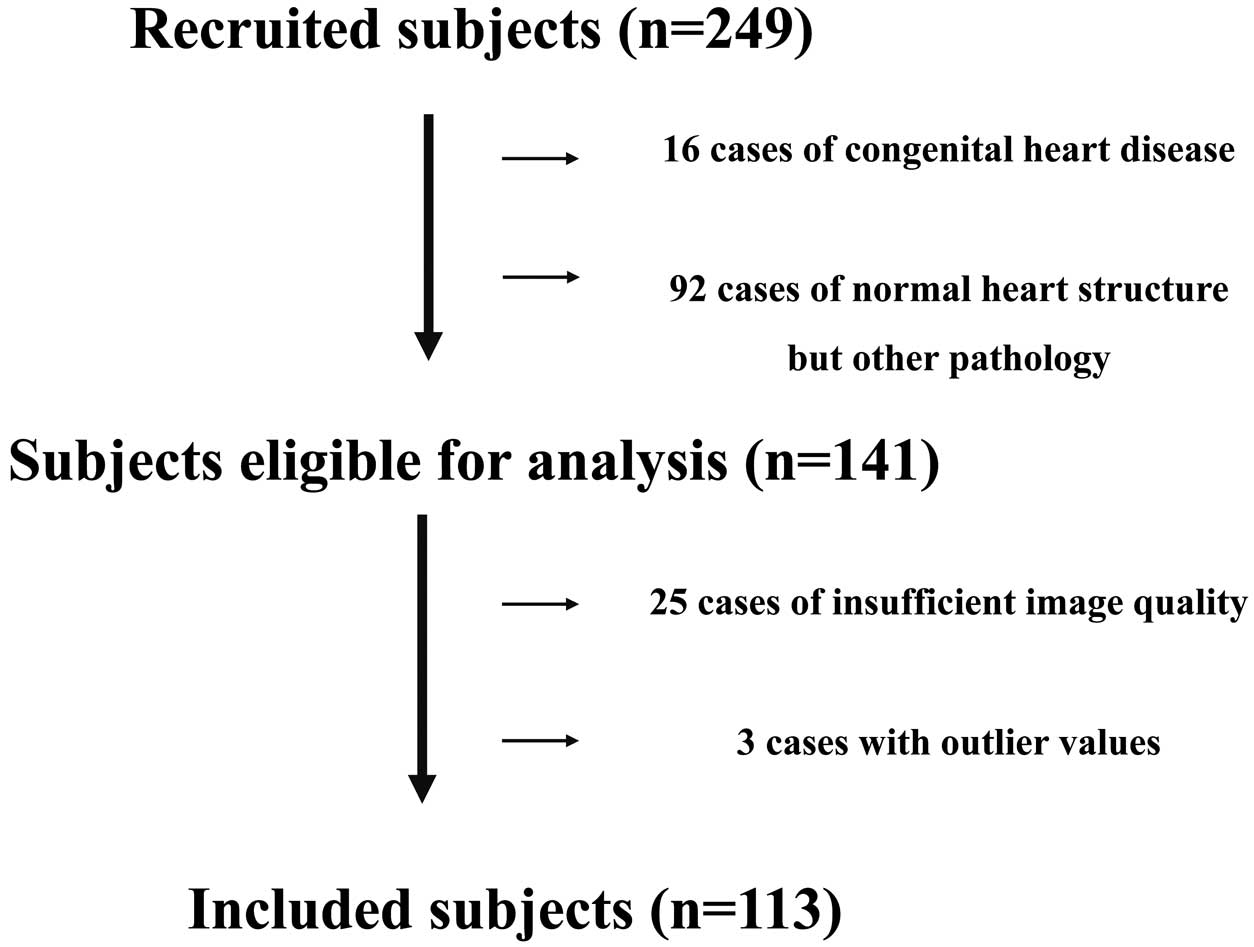
Study flowchart. The study recruited 249 newborns and initially excluded 16 newborns with congenital heart disease (CHD; 14 with ventricular septal defects and 2 with other CHDs) and 92 with a normal heart structure who had any pathological disease (39 with low birth weight, 28 with low blood glucose level after birth, 9 with transient tachypnea of the newborn, 7 with neonatal asphyxia, 4 with maternal thyroid disease, 2 preterm infants, and 3 with other newborn pathological disorders). Another 25 newborns with images of insufficient quality and 3 newborns with outlier values were excluded.
| Cesarean section delivery | 24 (21.2) |
| Male sex | 53 (46.9) |
| Gestational age (weeks) | 39±1 (38, 39) |
| Apgar score at 5 min | 9.1±0.4 (9.0, 9.2) |
| Length (cm) | 50.4±1.6 (50.1, 50.7) |
| Weight (g) | 3,120±378 (3,050, 3,190) |
| BSA (m2) | 0.21±0.02 (0.21, 0.21) |
| Age at echo examination (days) | 1.4±0.9 (1.2, 1.6) |
| HR (beats/min) | 126±17 (123, 129) |
| SBP (mmHg) | 67±9 (65, 69) |
| DBP (mmHg) | 38±6 (37, 39) |
| Analysis of umbilical cord blood (n=109) | |
| pH | 7.303±0.058 (7.292, 7.314) |
| PCO2 (mmHg) | 46.3±7.8 (44.8, 47.8) |
| Na (mEq/L) | 137.5±1.8 (137.2, 137.8) |
| K (mEq/L) | 4.5±0.7 (4.4, 4.6) |
| Ca2+ (mmol/L) | 1.42±0.06 (1.41, 1.43) |
| Blood sugar (mg/dL) | 87.2±27.2 (82.0, 92.4) |
| Lactase | 3.5±1.4 (3.2, 3.8) |
| Base excess (mmol/L) | −4.2±2.8 (−4.7, −3.7) |
Data are presented as n (%) or as the mean±SD (95% confidence interval). BSA, body surface area, pregnancy; DBP, diastolic blood pressure; echo, echocardiography; HR, heart rate; SBP, systolic blood pressure.
| Mean±SD | 95% CI | |
|---|---|---|
| Standard 2D echocardiography | ||
| LVEDV (mL) | 7.6±1.9 | 7.3, 8.0 |
| LVEDV (mL/m2) | 35.0±9.1 | 33.3, 36.7 |
| LVESV (mL) | 2.5±0.6 | 2.4, 2.6 |
| LVESV (mL/m2) | 11.5±3.2 | 10.9, 12.1 |
| LVEF (%) | 67.2±5.0 | 66.3, 68.1 |
| SV (mL) | 5.2±1.4 | 4.9, 5.5 |
| MAPSE (mm) | 6.1±1.0 | 5.9, 6.3 |
| Mitral E wave (cm/s) | 54.1±10.1 | 52.2, 56.0 |
| Mitral E/A ratio | 1.09±0.26 | 1.04, 1.14 |
| Tricuspid E wave (cm/s) | 50.0±13.5 | 47.5, 52.5 |
| Tricuspid E/A ratio | 0.82±0.13 | 0.80, 0.84 |
| LV-TDI e’ (cm/s) | 6.66±1.53 | 6.38, 6.95 |
| LV-TDI s’ (cm/s) | 4.59±0.95 | 4.41, 4.77 |
| LV-TDI MPI | 0.48±0.16 | 0.30, 0.66 |
| LV-TDI E/e’ | 8.50±2.46 | 8.04, 9.00 |
| IVS-TDI e’ (cm/s) | 5.08±1.21 | 4.85, 5.31 |
| IVS-TDI s’ (cm/s) | 4.03±0.71 | 3.90, 4.16 |
| IVS-TDI MPI | 0.44±0.17 | 0.31, 0.57 |
| IVS-TDI E/e’ | 11.06±2.78 | 10.54, 11.58 |
| T-TDI e’ (cm/s) | 7.02±1.99 | 6.65, 7.39 |
| T-TDI s’ (cm/s) | 5.52±1.03 | 5.33, 5.71 |
| T-TDI MPI | 0.39±0.16 | 0.36, 0.42 |
| T-TDI E/e’ | 7.42±2.12 | 7.03, 7.82 |
| 2D speckle strain | ||
| GLS | ||
| Endocardial GLS (%) | −19.3±3.1 | −19.9, −18.7 |
| Transmural GLS (%) | −16.3±2.8 | −16.8, −15.8 |
| Epicardial GLS (%) | −13.9±2.6 | −14.4, −13.4 |
| GCS | ||
| Base endocardial GCS (%) | −19.2±8.3 | −20.7, −17.7 |
| Base transmural GCS (%) | −9.9±4.5 | −10.7, −9.1 |
| Base epicardial GCS (%) | −6.0±3.3 | −6.6, −5.4 |
| Middle endocardial GCS (%) | −23.0±9.1 | −24.7, −21.3 |
| Middle transmural GCS (%) | −11.9±4.9 | −12.8, −11.0 |
| Middle epicardial GCS (%) | −5.9±3.5 | −6.5, −5.2 |
| Apex endocardial GCS (%) | −29.2±10.1 | −31.1, −27.3 |
| Apex transmural GCS (%) | −15.1±6.0 | −16.2, −14.0 |
| Apex epicardial GCS (%) | −7.0±4.4 | −7.8, −6.2 |
| Ea (mmHg/mL) | 12.4±3.4 | 11.8, 13.0 |
| Others | ||
| Ees (mmHg/mL) | 25.8±7.6 | 24.4, 27.2 |
| Ea/Ees | 0.49±0.11 | 0.47, 0.51 |
| IVPD | 0.93±0.34 | 0.87, 0.99 |
| IVPG | 0.33±0.13 | 0.31, 0.35 |
| FPS | 79.4±18.2 | 76.0, 82.8 |
| FPS/HR ratio | 0.63±0.15 | 0.60, 0.66 |
2D, 2-dimensional; CI, confidence interval; e’, e’ wave; E/e’, Doppler E wave/e’ ratio; Ea, arterial elastance; Ees, end-systolic elastance; FPS, frames per second; GCS, global circumferential strain; GLS, global longitudinal strain; HR, heart rate; IVPD, intraventricular pressure difference; IVPG, intraventricular pressure gradients; IVS-TDI, tissue Doppler imaging of the interventricular septum; LV, left ventricle; LV-TDI, tissue Doppler imaging of the lateral mitral annulus; LVEDV, LV end-diastolic volume using modified Simpson method; LVEF, LV ejection fraction using modified Simpson method; LVSV, LV end-systolic volume using modified Simpson method; MAPSE, mitral annular plane systolic excursion; MPI, myocardial performance index; s’, s’ wave; SV, stroke volume using modified Simpson method; T-TDI, tissue Doppler imaging of the lateral tricuspid annulus.
The normal MCW parameters in newborns are presented in Table 3. Considering a transmural GLS of −16.3±2.8%, the GWI, GCW, GWW, and GWE were 698.7±147.9 mmHg%, 1,008.5±200.1 mmHg%, 58.1±28.1 mmHg%, and 93.1±2.9%, respectively.
| Mean±SD | 95% CI | |
|---|---|---|
| GWI (mmHg%) | 698.7±147.9 | 671.1–726.3 |
| GCW (mmHg%) | 1,008.5±200.1 | 971.2–1,045.8 |
| GWW (mmHg%) | 58.1±28.1 | 52.9–63.3 |
| GWE (%) | 93.1±2.9 | 92.6–93.7 |
CI, confidence interval; GCW, global constructive work; GWE, global work efficiency; GWI, global work index; GWW, global wasted work.
Correlations between MCW and various parameters are presented in Table 4 and Supplementary Table 2. GWI showed a good correlation with SBP, DBP, and endocardial, transmural, and epicardial GLS and a moderate correlation with a mitral annular plane systolic excursion (MAPSE), tricuspid annular plane systolic excursion (TAPSE), tissue Doppler imaging (TDI) of the lateral mitral annulus (LV-TDI) E/e’, TDI of the lateral tricuspid annulus (T-TDI) E/e’, and Ees. GCW showed a good correlation with SBP, DBP, and endocardial, transmural, and epicardial GLS and a moderate correlation with MAPSE, TAPSE, SV, and T-TDI E/e. GWW showed a moderate correlation with IVS-TDI e’, endocardial and transmural GLS, IVPD, and apex endocardial and transmural GCS. GWE showed a good correlation with endocardial, truncal, and epicardial GLS and a moderate correlation with mitral E, TDI of the interventricular septum (IVS-TDI) e’, T-TDI e’, T-TDI s’, T-TDI myocardial performance index (MPI), IVPD, and base transmural GCS.
| GWI | GCW | GWW | GWE | |
|---|---|---|---|---|
| HR | −0.216* | −0.033 | −0.220* | 0.195* |
| SBP | 0.616** | 0.679** | 0.108 | 0.117 |
| DBP | 0.554** | 0.630** | 0.064 | 0.162 |
| Endocardial GLS | −0.466** | −0.540** | 0.258** | −0.467** |
| Transmural GLS | −0.492** | −0.534** | 0.215* | −0.437** |
| Epicardial GLS | −0.511** | −0.528** | 0.183 | −0.409** |
| FPS | −0.001 | 0.018 | −0.124 | 0.106 |
| HR/FPS ratio | 0.093 | 0.034 | −0.017 | 0.015 |
| LVEDV | 0.128 | 0.157 | 0.024 | 0.107 |
| LVSV | 0.030 | 0.112 | 0.048 | 0.114 |
| LVEF | 0.126 | 0.167 | −0.009 | 0.014 |
| SV | 0.140 | 0.250** | 0.079 | 0.092 |
| MAPSE | 0.234* | 0.256** | 0.002 | 0.096 |
| Mitral E | −0.111 | 0.032 | −0.175 | 0.195* |
| IVS-TDI e’ | 0.053 | 0.173 | −0.281** | 0.336** |
| IVS-TDI s’ | 0.099 | 0.179 | −0.080 | 0.153 |
| IVS-TDI MPI | −0.091 | −0.147 | 0.095 | −0.137 |
| IVS-TDI E/e’ | −0.127 | −0.121 | 0.094 | −0.119 |
| LV-TDI e’ | 0.099 | 0.155 | −0.079 | 0.177 |
| LV-TDI s’ | −0.012 | 0.085 | −0.110 | 0.128 |
| LV-TDI MPI | −0.059 | −0.117 | 0.059 | −0.116 |
| LV-TDI E/e’ | −0.194* | −0.125 | −0.117 | 0.025 |
| Ea | 0.143 | 0.067 | 0.019 | −0.089 |
| Ees | 0.223* | 0.184 | −0.023 | −0.049 |
| Ea/Ees | −0.133 | −0.174 | 0.010 | −0.015 |
| IVPD | −0.098 | 0.144 | −0.227* | 0.205* |
| IVPG | −0.109 | 0.097 | −0.171 | 0.168 |
*P<0.05, **P<0.01. DBP, diastolic blood pressure; Ees, end-systolic elastance; GCW, global constructive work; GWE, global work efficiency; GWI, global work index; GWW, global wasted work; SBP, systolic blood pressure. Other abbreviations as in Tbale 2.
Multivariate analysis revealed that GWI was significantly correlated with HR and SBP; that GCW was significantly correlated with SBP, DBP, and endocardial, transmural, and epicardial GLS; and that GWW and GWE were not significantly correlated (Table 5). Figure 3 shows the main relationship of the MCW index. GWI showed a good correlation with SBP (Figure 3A). Conversely, GCW showed a good correlation with SBP and DBP (Figure 3B), as well as endocardial, transmural, and epicardial GLS (Figure 3C). We estimated correlations of MCW with FPS and the FPS/HR ratio; however, none of the correlations was significant.
| Univariate | Multivariable | |||
|---|---|---|---|---|
| Coefficient | 95% CI | Standardized β coefficient |
95% CI | |
| GWI | ||||
| HR | −0.216* | −0.385, −0.030 | −2.261** | −3.184, −1.338 |
| SBP | 0.616** | 0.486, 0.719 | 9.636** | 6.877, 12.394 |
| DBP | 0.554** | 0.411, 0.670 | ||
| MAPSE | 0.234* | 0.051, 0.402 | ||
| TAPSE | 0.273** | 0.091, 0.437 | ||
| LV-TDI E/ e’ | −0.194* | −0.365, −0.009 | ||
| T-TDI E/e’ | −0.189* | −0.364, −0.002 | ||
| Endocardial GLS | −0.466** | −0.599, −0.307 | ||
| Transmural GLS | −0.492** | −0.620, −0.338 | ||
| Epicardial GLS | −0.511** | −0.636, −0.360 | ||
| Ees | 0.223* | 0.037, 0.393 | ||
| GCW | ||||
| SBP | 0.679** | 0.565, 0.786 | 12.187** | 9.290, 15.085 |
| DBP | 0.630** | 0.505, 0.730 | 5.417** | 1.403, 9.431 |
| MAPSE | 0.256* | 0.074, 0.422 | ||
| SV | 0.250** | 0.066, 0.417 | ||
| TAPSE | 0.222* | 0.037, 0.392 | ||
| T-TDI s’ | 0.219* | 0.035, 0.389 | ||
| Endocardial GLS | −0.540** | −0.659, −0.395 | 98.678* | 15.044, 182.312 |
| Transmural GLS | −0.534** | −0.654, −0.387 | −274.544* | −479.945, −69.144 |
| Epicardial GLS | −0.528** | −0.649, −0.380 | 134.376* | 15.044, 182.312 |
| GWW | ||||
| HR | −0.220* | −0.39, −0.036 | ||
| IVS-TDI e’ | −0.281** | −0.444, −0.101 | – | |
| Endocardial GLS | 0.258** | 0.077, 0.422 | ||
| Transmural GLS | 0.215* | 0.031, 0.384 | ||
| IVPD | −0.227* | −0.412, −0.025 | ||
| Apex endocardial GCS | 0.219* | 0.034, 0.390 | ||
| Apex transmural GCS | 0.219* | 0.034, 0.389 | ||
| GWE | ||||
| HR | 0.195* | 0.010, 0.368 | ||
| Mitral E | 0.196* | 0.011, 0.366 | ||
| IVS-TDI e’ | 0.336** | 0.161, 0.491 | ||
| T-TDI e’ | 0.196* | 0.011, 0.369 | – | |
| T-TDI s’ | 0.201* | 0.016, 0.373 | ||
| T-TDI MPI | −0.201* | −0.373, −0.016 | ||
| Endocardial GLS | −0.467** | −0.600, −0.309 | ||
| Transmural GLS | −0.437** | −0.575, −0.275 | ||
| Epicardial GLS | −0.409** | −0.552, −0.242 | ||
| IVPD | 0.205* | 0.002, 0.393 | ||
| Base transmural GCS | −0.190* | −0.367, −0.001 | ||
*P<0.05, **P<0.01. TAPSE, tricuspid annular plane systolic excursion. Other abbreviations as in Tbales 2,4.
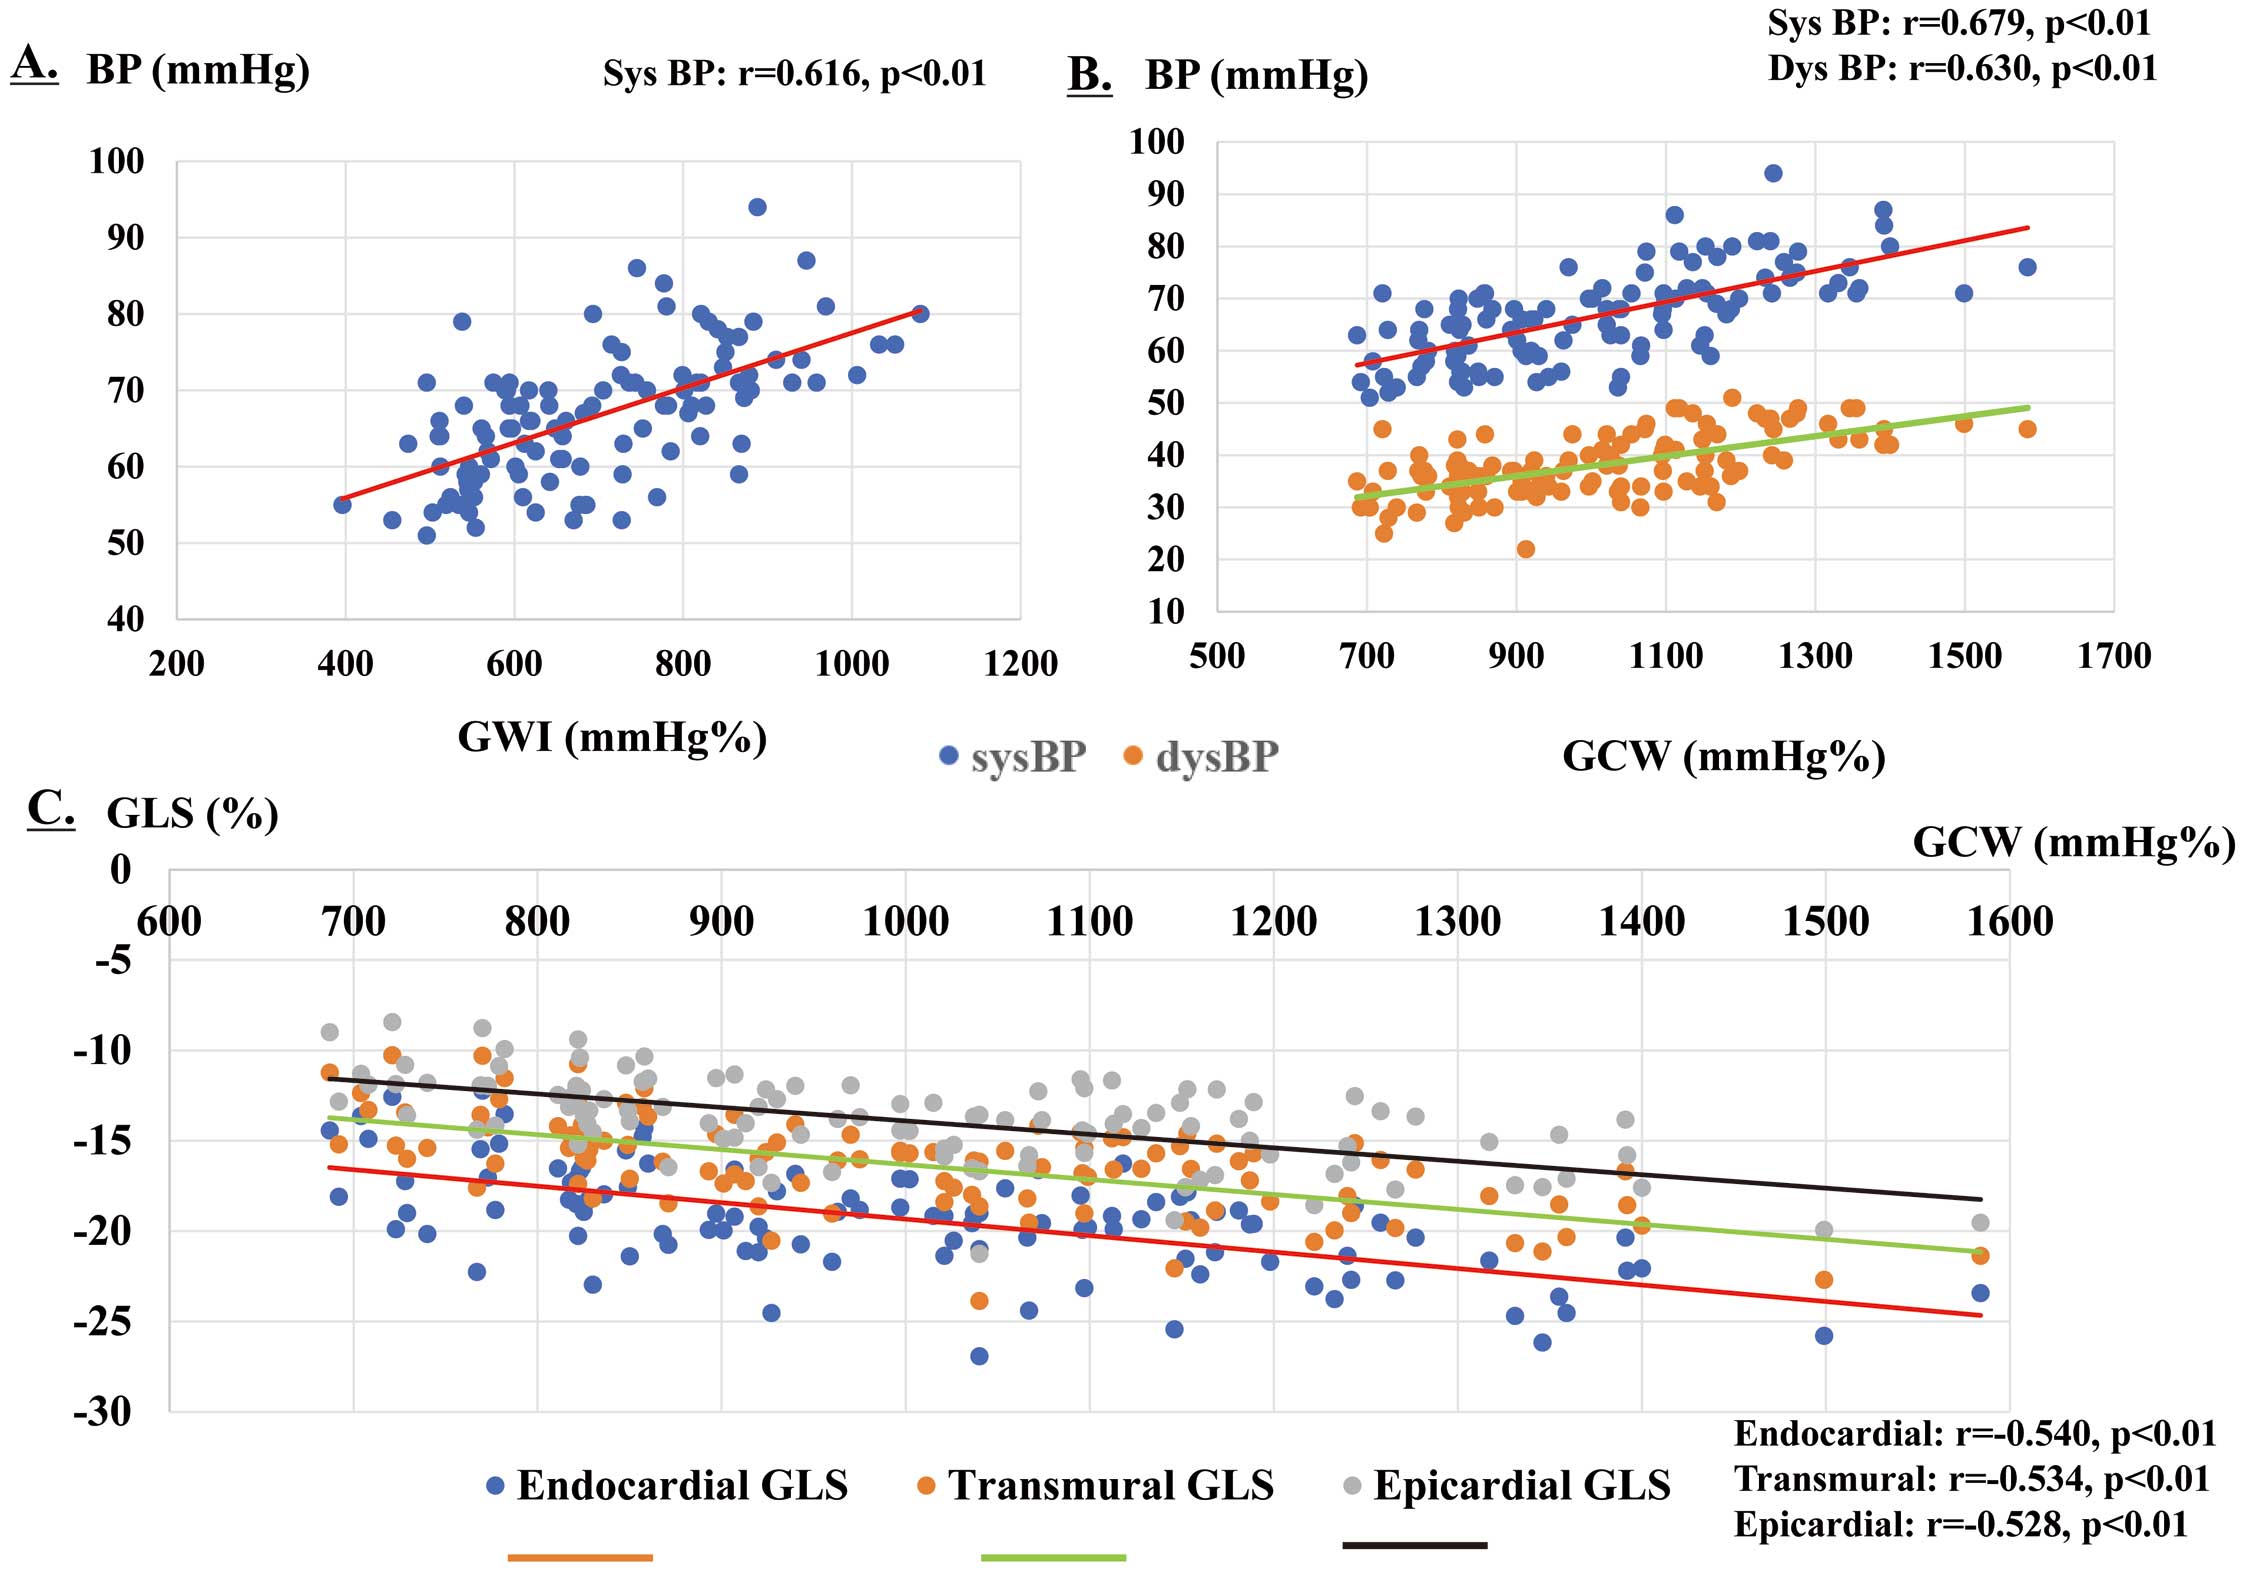
Main relationships of the myocardial work (MCW) indices. (A) The global work index (GWI) was correlated with systolic blood pressure (SBP; r=0.616; P<0.01). (B) Global constructive work (GCW) was correlated with SBP (r=0.679; P<0.01), diastolic blood pressure (DBP; r=0.630; P<0.01), (C) endocardial global longitudinal strain (GLS; r=−0.540; P<0.01), transmural GLS (r=−0.534; P<0.01), and epicardial GLS (r=−0.528; P<0.01). BP, blood pressure.
With respect to the assessment of intraobserver reliability, the ICC was 0.885 (95% CI 0.715–0.954) for GWI, 0.799 (95% CI 0.501–0.920) for GCW, 0.809 (95% CI 0.527–0.9204) for GWW, and 0.953 (95% CI 0.882–0.981) for GWE. With respect to the determination of interobserver reliability, the ICC was 0.948 (95% CI 0.868–0.979) for GWI, 0.937 (95% CI 0.842–0.975) for GCW, 0.856 (95% CI 0.637–0.943) for GWW, and 0.950 (95% CI 0.874–0.980) for GWE. Intra- and interobserver variations in GWI, GCW, GWW, and GWE were within acceptable ranges.
In the present study, we established the reference range for MCW parameters in healthy newborns. All MCW parameters in newborns were lower than those in both children16 and adults.14,15 Adaptation of the newborn myocardium to extrauterine life is a complex process. The increasing work requirement and high growth rate of the myocardium necessitate an increase in energy production. Energy in the form of ATP is supplied by the oxidation of fatty acids and glucose in the adult myocardium; however, as the newborn matures, the contribution of fatty acid oxidation to overall energy production increases, and the mechanisms responsible for this switch in energy substrate preference in the myocardium are complicated.29 The myocardium in newborns is confronted by the need to increase cardiac output to both the pulmonary and systemic circulation and to operate against increased vascular resistance. We believe that the difference in energy production during the neonatal period is attributable to the difference in MCW.
During the newborn period, GWI and GCW are more closely correlated with BP and layer-specific GLS, as seen in adulthood30 and in children.16 For newborns, 2D STE strain imaging including GLS is feasible, with over 85% of acquisitions deemed to be of adequate quality for the analysis of term and preterm infants.4,6,31–33 A recent report indicated that MCW in adulthood was affected by BP,34 which is a component of the afterload index. This finding cannot be ignored during clinical research or diagnosis. Moreover, afterload-related reference values are required to make a reasonable judgment regarding myocardial function even during the newborn period because serial echocardiographic changes in BP occur among neonates.2 Notably, it is important to set a reference range for MCW values in newborns with physiologically low BP. The serial change in BP with age in the newborn period suggests that MCW may also be affected by age. This study is the first to provide a working reference for MCW in newborns during the short period immediately after birth. Future studies need to establish reference values of MCW due to serial changes in BP at different ages within in the neonatal period.
With respect to the correlation between new indices of MCW and standard and advanced 2D echocardiographic parameters of LV/right ventricular (RV) systolic and diastolic functions, a few parameters showed moderate correlations. Interestingly, in newborns, MCW was moderately correlated with RV systolic and diastolic function, GWI was moderately correlated with TAPSE and T-TDI E/e’, GCW was moderately correlated with TAPSE and T-TDI E/e, and GWE was moderately correlated with T-TDI e’, T-TDI s’, and T-TDI MPI. During the early newborn period, a state of physiological pulmonary hypertension occurs when the pulmonary circulation is established in the intrauterine environment.35 We speculate that these newborn-specific hemodynamic changes affected the relationship between newborn MCW and RV function. Furthermore, LV systolic function and GWI were moderately correlated with MAPSE and Ees; GCW was moderately correlated with MAPSE; GWW was moderately correlated with endocardial GLS, transmural GLS, and apex endocardial and transmural GCS; and GWE was moderately correlated with base transmural GCS. In addition, LV diastolic function and GWI showed a moderate correlation with LV-TDI E/e’, GWW showed a moderate correlation with IVS-TDI e’ and IVPD, and GWE showed a moderate correlation with mitral E, LIVS-TDI e’, and IVPD. A moderate correlation between MCW and some LV systolic and diastolic functions has been reported in adults.30 These moderate correlations were due to the complex architecture of myocardial fibers. The LV systolic motion is the result of 3 principal components: base-to-apex longitudinal shortening, radial thickening of the epicardium towards the endocardium, and circumferential rotation and shortening.7 All components of myocardial deformation contribute to the generation of MCW and could globally reflect LV mechanics and performance.30 We need to comprehensively evaluate MCW during the newborn period, as it is also affected by the evaluation of cardiac systolic and diastolic functions in adulthood. Further research is needed to interpret the results of MCW analysis during the newborn period.
In a clinical study investigating MCW during the newborn period, newborns with illness experienced cardiovascular dysfunction. In preterm newborns, surgical ligation of the patent ductus arteriosus (PDA) results in a sudden increase in the LV afterload and a decrease in the LV preload. Several echocardiographic studies have investigated the changes in LV function associated with an increased afterload following PDA closure.13,22,31,36,37 Reports on serial changes in MCW parameters before and after percutaneous PDA closure in premature infants indicated that GWI, GCW, and GWE in preterm infants were significantly reduced after percutaneous PDA closure.13 In that study, whether MCW was a sensitive indicator of VAC in newborns remained unclear because both LVEF and GLS decreased after treatment.
Another clinical implication of investigating MCW during the newborn period is assessment of the current practices for circulatory management of extremely low-birth-weight infants (ELBWIs). According to national surveys in Japan, the use of echocardiography and cardiovascular agents, including catecholamines and vasodilators, are part of the current practices for the circulatory management of ELBWIs.38,39 This concept consists of tailored circulatory management based on the stress-velocity relationship in preterm infants.40 That study showed that serious complications of intraventricular and/or pulmonary hemorrhages in ELBWIs were higher in infants with an excessive afterload, which resulted in a decrease in the function of the LV. In addition, echocardiographic afterload assessment of the stress-velocity relationship (rate-corrected mean fiber shortening velocity and end-systolic wall stress relationship) using M-mode showed that these serious complications could be reduced or prevented by afterload reduction to an acceptable level by the administration of vasodilator therapy and sedation.40 The preterm LV has limited ability to respond to such an increase in afterload. This results in depressed cardiac function and a deterioration in hemodynamics. Although evaluation by MCV may be useful for preventing the onset of such serious complications during the neonatal period, the coupling between the arterial and ventricular systems is complex. Future studies should determine whether MCW is a sensitive index considering VAC, even during the newborn period.
FPS has traditionally been considered as the most important aspect of image acquisition.41 Because the resting HR in newborns is high and normally ranges from 120 to 180 beats/min, it is important to maintain a high FPS. In addition, 2D STE is based on the recognition of speckles between frames. We estimated the correlation between MCW and both FPS and the FPS/HR ratio; however, there were no significant correlations. Sanchez et al42 reported that infant strain measurements were most robust when cine loops were acquired at an FPS/HR ratio of >0.7, resulting in optimal strain reproducibility. Although the FPS/HR ratio in the present study was 0.63 (0.15), which slightly underestimated the appropriate setting, we considered it to be acceptable for the reference range for MCW assessment in newborns. Further studies are needed to establish an appropriate FPS/HR setting to estimate MCW in newborns.
The present study has some limitations. First, this study involved a relatively small number of subjects and was a retrospective study. Second, no studies have evaluated normative data for MCW in newborns. Third, because the echocardiography was performed under natural sedation in this study, 28 newborns were excluded because images with appropriate quality could not be obtained for MCW evaluation. When evaluating MCW, it is necessary to match the HRs with measurements in the 4-, 3-, and 2-chamber views. However, the HR fluctuates easily during the neonatal period. Therefore, MCW must be evaluated with caution during this period. In addition, GWW was overestimated because the 3 outliers were not tracked appropriately, suggesting that more accurate tracking was needed to correctly assess GWW. Finally, estimation by 2D STE during the newborn period is not always accurate because it is affected by natural breathing and spontaneous breath holding is not possible. Despite these limitations, this study provides some new substantial insights. Additional studies involving a larger number of individuals are required to confirm the correlations observed in this study.
With the establishment of reference ranges and normative MCW data for newborns, routine clinical use and rotational mechanics are likely to become increasingly common. As the clinical applicability of these measures is further elucidated in newborns, we will begin to understand how these measures can help direct management, monitor treatment responses, and predict outcomes to optimize the care delivered to newborns. Future studies should focus on the ability of these measures to distinguish myocardial dysfunction secondary to adverse loading conditions from dysfunction due to an impairment in intrinsic contractility (or a mixture of both). Using MCW to evaluate VAC will help tailor therapeutic interventions to more accurately target the underlying pathophysiological consequences of disease states.
The authors are grateful for the valuable assistance of staff at the Department of Pediatric Cardiology, Chutoen General Medical Center in treating the admitted infants.
This research did not receive any specific grant from any funding agency in the public, commercial, or not-for-profit sectors. Equipment of the Chutoen General Medical Center was used.
The authors declare that there are no conflicts of interest.
The study protocol conformed to the principles of the Declaration of Helsinki and was approved by the Ethics Committee of Chutoen Medical Center (approval date January 25, 2022; Approval no. 117).
Please find supplementary file(s);
http://dx.doi.org/10.1253/circrep.CR-22-0045