Abstract
Background: Subclinical leaflet thrombosis occasionally occurs after transcatheter aortic valve implantation (TAVI), but its exact etiology and relationship with thrombogenicity remain unknown.
Methods and Results: This study enrolled 35 patients who underwent TAVI. Thrombogenicity was evaluated using a total thrombus-formation analysis system (T-TAS) to compute the thrombus-formation area under the curve (PL18-AUC10
and AR10-AUC30). Periprocedural thrombogenic parameters including T-TAS were investigated at pre-TAVI, 2 days, 7 days, and 3 months post-TAVI. Hypoattenuated leaflet thickening (HALT) and maximum leaflet thickness (MLT) were evaluated using contrast-enhanced computed tomography 7 days and 3 months post-TAVI. The associations between thrombogenicity and HALT or MLT were assessed. T-TAS parameters consistently decreased at 2 and 7 days post-TAVI, followed by improvement at 3 months. HALT was detected in 20% and 17% of patients at 7 days and 3 months, respectively, post-TAVI. The median MLT value was 1.60 mm at 7 days and 3 months post-TAVI. A significant positive correlation was observed between the decrease in the AR10-AUC30
and MLT at 7 days post-TAVI. Univariate linear regression analysis revealed a decrease in the AR10-AUC30
and an increase in the D-dimer level as a significant predictor of MLT deterioration.
Conclusions: The findings suggested that a transient decrease in thrombogenicity following TAVI predicts leaflet thrombosis, implying that monitoring thrombogenicity may be useful for predicting progression of leaflet thrombosis.
Over the past decade, transcatheter aortic valve implantation (TAVI) has become the predominant treatment for patients with severe aortic stenosis (AS),1 because of the development of catheter devices and prostheses with proof of better clinical outcomes. Recently, subclinical leaflet thrombosis, characterized by hypoattenuated leaflet thickening (HALT), has been well described using contrast-enhanced computed tomography (CT), and proved to manifest in approximately 10–13% of patients undergoing TAVI.2,3 Although the clinical impact of HALT on the occurrence of ischemic stroke and valvular dysfunction has been demonstrated,2,4,5 the underlying pathological mechanisms and predictive factors associated with leaflet thrombosis remains unclear.
Recent studies have revealed periprocedural alterations in thrombogenicity following TAVI, exemplified by acquired thrombocytopenia. These changes have been linked to increased bleeding susceptibility and poor short- and long-term outcomes.6,7 Thrombosis is attributed to an imbalance in blood coagulation activity, prompting speculation that fluctuation in periprocedural thrombogenicity might be associated with leaflet thrombosis progression post-TAVI. However, a lack of pertinent in vivo evidence exists, underscoring the need for information about the relationship between periprocedural thrombogenicity and leaflet thrombosis.
Use of a total thrombus-formation analysis system (T-TAS), an automated microchip-based flow chamber system that analyzed thrombus formation under different flow conditions,8–11 is well established in Europe and the USA. The 2 microchips have thrombogenic surfaces that enable analysis of different thrombotic processes. The platelet chip (PL chip) indicates platelet activation, while the atheroma chip (AR chip) evaluates platelet activation and subsequent coagulation cascade.8 In this study we aimed to clarify the association between perioperative thrombogenicity and leaflet thrombosis development using a T-TAS (Fujimori Kogyo Co., Tokyo, Japan).
Methods
Study Population
In this single-center prospective observational study, 36 consecutive patients with severe AS who underwent TAVI at Kumamoto University Hospital between January 2021 and December 2022 were enrolled; 1 patient was excluded due to missing follow-up T-TAS data, resulting in 35 patients for analysis. The study protocol conformed to the ethical guidelines of the Declaration of Helsinki and its amendments. The Human Ethics Committee of Kumamoto University approved the study protocol (No. 2155). Written informed consent was given by all patients before they participated in the study.
TAVI Procedure and Follow-up Protocol
All TAVI procedures were performed with a transfemoral approach under local anesthesia. The following commercially available transcatheter aortic valves were implanted: Sapien 3 (Edwards Life Sciences, Irvine, CA, USA) and Evolut PRO+ (Medtronic, Minneapolis, MN, USA). Baseline clinical data were obtained, and blood samples were collected from the peripheral vein to evaluate T-TAS parameters and laboratory data before TAVI, or on the day of TAVI, and at 2 days, 7 days, and 3 months post-TAVI. The choice of approach site, prosthesis type, and postprocedural management, including antithrombotic regimens, were at the discretion of the individual physician. Clinical follow-up assessed the incidence of adverse events after TAVI, including all-cause death, cardiac death, heart failure, and stroke.
T-TAS Measurement
Thrombogenicity was evaluated using the chosen T-TAS. The PL chip that is specifically designed to enable quantitative analysis of platelet-related thrombus formation is coated with type I collagen, which activates platelet thrombus formation. Under arterial flow conditions, this activation includes platelet adhesion and aggregation, granule secretion, and the ensuing thrombus growth. The AR chip is meticulously designed for quantifying the white thrombus formation process mediated by the combined activation of platelets and the coagulation cascade under venous flow conditions. The AR chip is coated with type I collagen and tissue thromboplastin, enabling simultaneous activation of platelets and the coagulation system within the microchips. This coactivation facilitates fibrin-rich thrombus formation. The process of thrombus formation inside the two chips is analyzed by monitoring the changes in flow pressure. The area under the curve (AUC) for flow pressure is computed to assess thrombogenicity, because thrombus formation occludes the microchip capillaries, consequently causing an elevation in the flow pressure inside the microchip. The PL18-AUC10
parameter represents the AUC during the first 10 min for the PL chip at a flow rate of 18 μL/min, which simulates arterial flow conditions. Conversely, the AR10-AUC30
parameter denotes the AUC within the initial 30 min for the AR chip at a flow rate of 10 μL/min to replicate venous flow conditions.
CT Acquisition for Evaluation of Subclinical Leaflet Thrombosis
Contrast-enhanced CT scans were performed 7 days and 3 months post-TAVI to evaluate subclinical leaflet thrombosis. All CT examinations were ECG-gated, ensuring data acquisition of the aortic root in both the end-systolic and end-diastolic phases. HALT was defined as a visually observed increase in leaflet thickness, characterized by a typical presentation on the long-axis view during mid-diastole.3 The location of the affected cusp was determined from the native cusp position. The maximal leaflet thickness (MLT) for the most affected leaflet was evaluated by measuring the distance on the long-axis view during mid-diastole.3 An independent, experienced cardiac radiologist (S.O) who was unaware of the clinical data of the patients measured these parameters, which were confirmed on a minimum of 2 distinct multiplanar reconstruction images.
Statistical Analysis
Continuous variables are expressed as the mean±standard deviation and were compared using the t-test in cases where the data exhibited a normal distribution. Non-normally distributed continuous data are presented as median (interquartile range [IQR]) and were compared using the Wilcoxon signed-rank test. Categorical data are expressed as frequencies and percentages, and were compared using the chi-square test. Furthermore, the Pearson correlation coefficient was calculated to evaluate the correlation between the MLT at 7 days post-TAVI and alterations in T-TAS parameters and platelet count post-TAVI. We conducted a univariate linear regression analysis to compute the β coefficient for MLT at 7 days post-TAVI. Statistical significance was set at P<0.05. All statistical analyses were performed using JMP, version 14 (SAS Institute).
Results
Clinical Demographics of the Study Population
Table 1 summarizes the clinical characteristics of patients with AS who underwent TAVI. The mean age was 84.5 years, with 22 (63%) patients being female. There was a high prevalence of hypertension, dyslipidemia, and chronic kidney disease among the study patients. The median aortic maximum velocity was 4.4 m/s, and the left ventricular ejection fraction was preserved in most patients. Most patients received mono- or dual antiplatelet therapy; 14% of the patients were administered direct oral anticoagulants for atrial fibrillation. Regarding the TAVI procedure, two-thirds of the patients underwent Sapien 3 implantation, and one-third underwent Evolut PRO+ implantation.
Table 1.
Baseline Clinical Demographics of Patients Who Underwent TAVI
| |
Overall cohort
(n=35) |
| Age (years) |
84.5±4.5 |
| Female |
22 (63%) |
| Body mass index (kg/m2) |
23.1±3.6 |
| Hypertension |
30 (86%) |
| Diabetes mellitus |
9 (26%) |
| Dyslipidemia |
23 (66%) |
| Coronary artery disease |
12 (34%) |
| Atrial fibrillation |
5 (14%) |
| Previous stroke |
9 (26%) |
| Chronic kidney disease |
18 (51%) |
| Laboratory data |
| eGFR (mL/min/1.73 m2) |
58 (47, 73) |
| HbA1c (%) |
6.0±1.1 |
| LDL-C (mg/dL) |
96±26 |
| BNP (pg/mL) |
137 (70, 249) |
| Hemoglobin (g/dL) |
12.5±1.5 |
| Platelet count (104/μL) |
20.2±6.4 |
| PT-INR |
1.06±0.29 |
| APTT (s) |
30.5±4.5 |
| D-dimer (μg/mL) |
1.0 (0.7, 1.9) |
| Echocardiographic data |
| LVEF (%) |
62.9 (55.6, 68.8) |
| Aortic valve area (cm2) |
0.65±0.18 |
| Max velocity (m/s) |
4.4 (4.1, 4.8) |
| Mean gradient (mmHg) |
45.4 (35.0, 54.4) |
| Medications before TAVI |
| Aspirin |
11 (31%) |
| Clopidogrel |
7 (20%) |
| Prasugrel |
1 (3%) |
| DAPT |
3 (9%) |
| DOAC |
5 (14%) |
| ACEI/ARB/ARNI |
19 (54%) |
| β-blocker |
3 (9%) |
| CCB |
20 (57%) |
| Loop diuretics |
12 (34%) |
| Statin |
23 (66%) |
| Operative risk score |
| STS score (%) |
3.8 (3.1, 5.8) |
| Euro SCORE II (%) |
2.5 (1.8, 3.4) |
| Procedural characteristics |
| Aortic valve calcium score |
2,256 (1,250, 2,800) |
| Aortic valve area (cm2) |
379 (333, 426) |
| Prosthesis type |
| Sapien 3 |
23 (66%) |
| Evolut PRO+ |
12 (34%) |
| Predilatation performed |
27 (77%) |
| Post-dilatation performed |
11 (31%) |
| PVL |
| Trivial |
19 (54%) |
| Mild |
16 (46%) |
ACEI/ARB/ARNI, angiotensin-converting enzyme inhibitor/angiotensin II receptor blocker/angiotensin-receptor neprilysin inhibitor; APTT, activated partial thromboplastin time; BNP, B-type natriuretic peptide; CCB, calcium-channel blocker; DAPT, dual antiplatelet therapy (defined as the combination of aspirin plus P2Y12 inhibitor); DOAC, direct oral anticoagulant; eGFR, estimated glomerular filtration rate; LDL-C, low-density lipoprotein cholesterol; LVEF, left ventricular ejection fraction; PT-INR, prothrombin time-international normalized ratio; PVL, paravalvular leak; STS, Society of Thoracic Surgeons.
Periprocedural Thrombogenicity and CT Findings
Periprocedural thrombogenicity was assessed using T-TAS parameters (PL18-AUC10
and AR10-AUC30
levels) and conventional coagulation tests, including prothrombin time-international normalized ratio (PT-INR), activated partial thromboplastin time (APTT), and platelet count (Table 2). PL18-AUC10
and AR10-AUC30
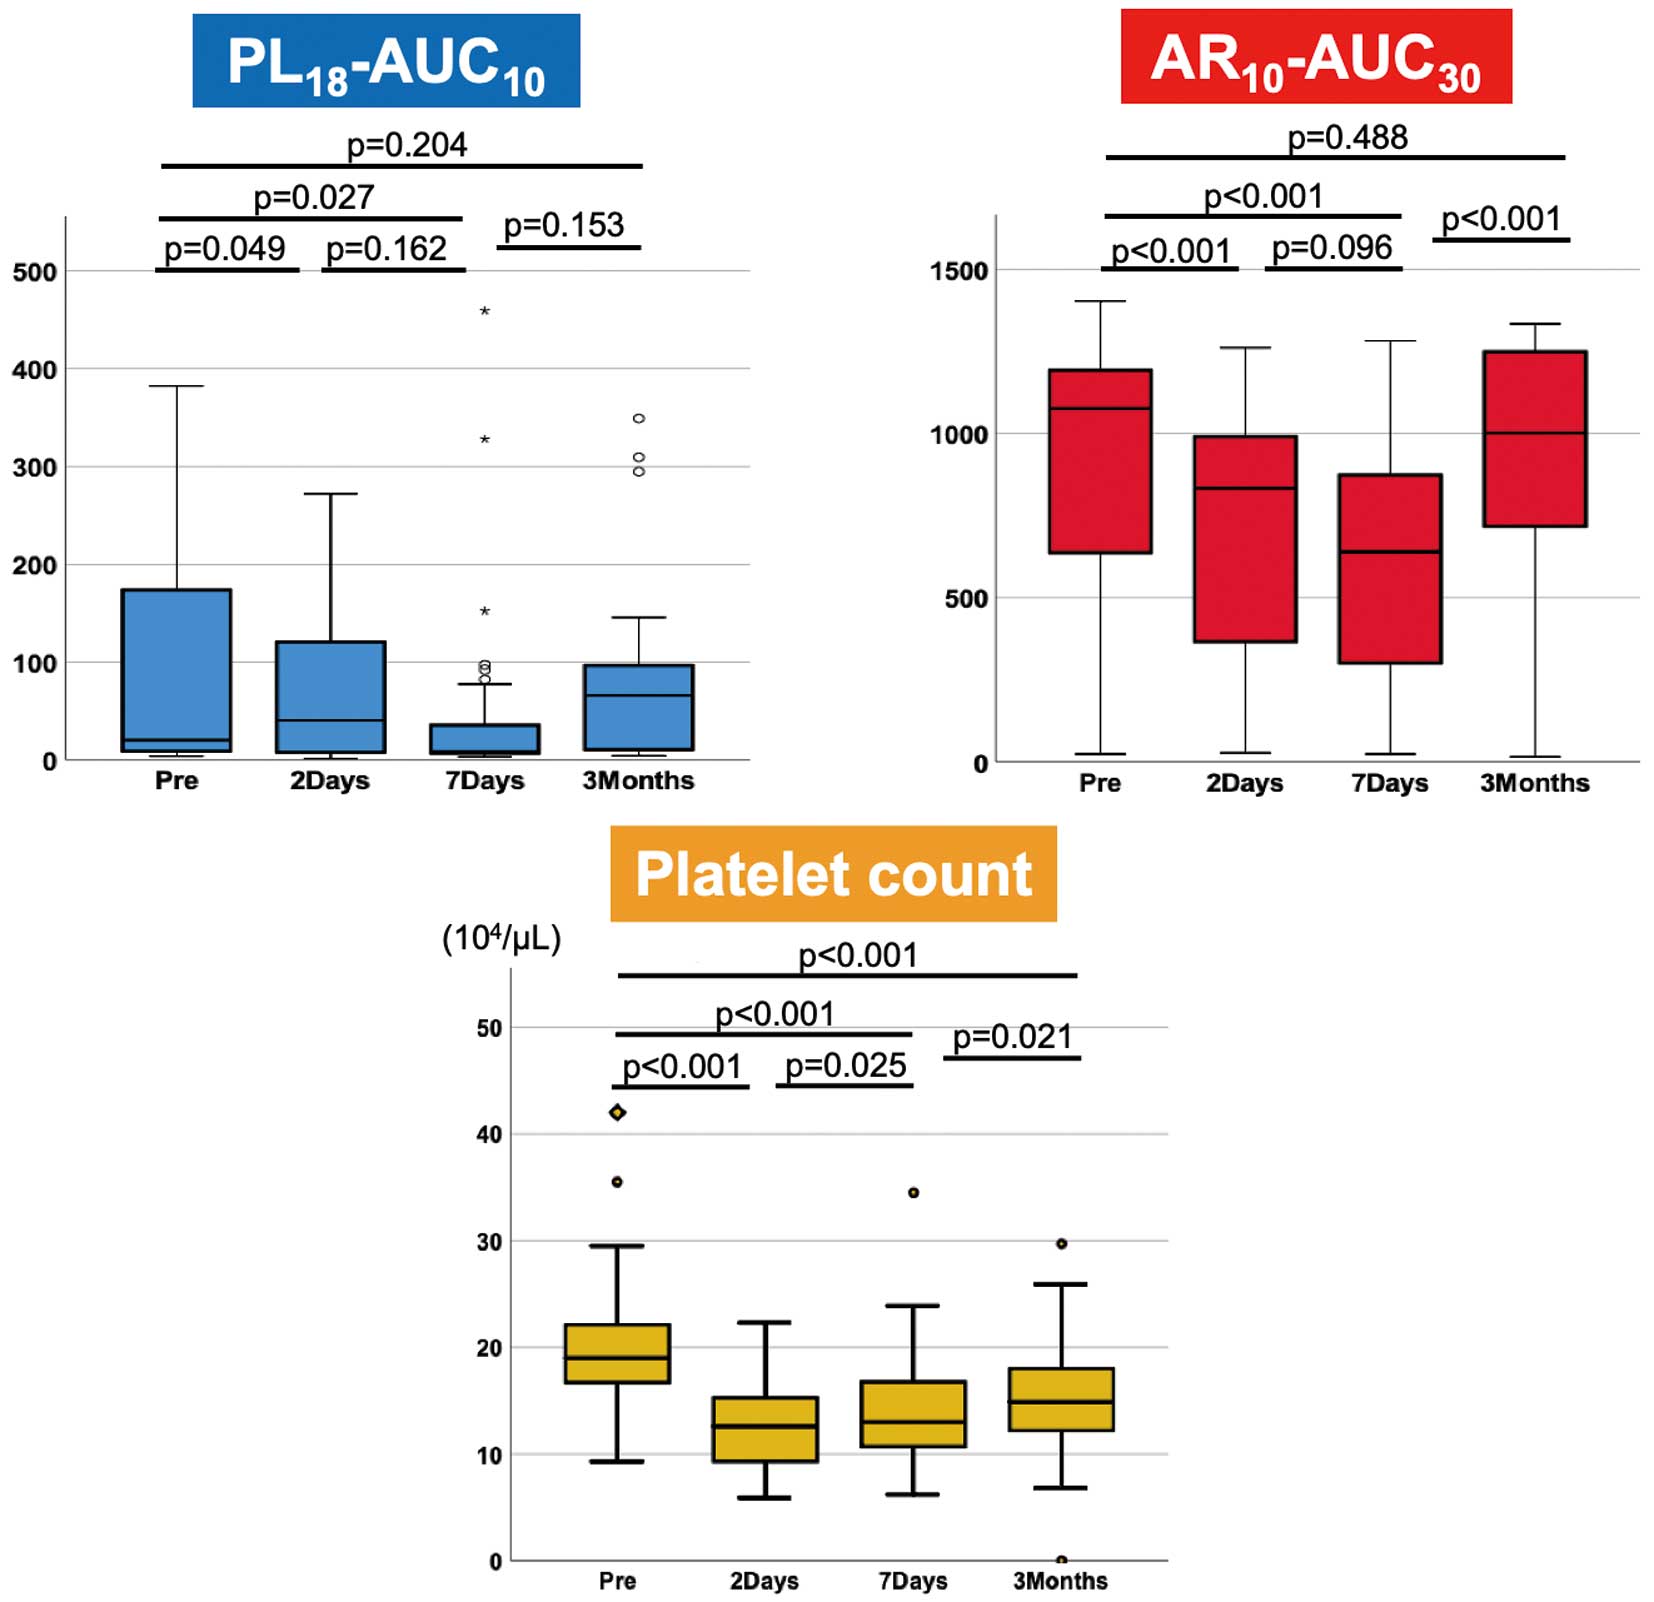
and platelet counts significantly decreased following TAVI compared with baseline. The PL18-AUC10
and AR10-AUC30
were the lowest at 7 days post-TAVI and then recovered until 3 months post-TAVI. Conversely, the platelet count reached its lowest point 2 days post-TAVI and recovered 3 months post-TAVI. However, it was still lower than the baseline level (Figure 1). Following TAVI, the PT-INR, APTT, and D-dimer level all increased significantly. The PL18-AUC10
at baseline was not significantly different between patients receiving and not receiving antiplatelet therapy (10 [9, 91] vs. 110 [9, 261], P=0.12), although it tended to be lower in patients receiving antiplatelet therapy than in those not receiving antiplatelet therapy.
Table 2.
Serial Change in Thrombogenic Parameters and CT Findings Pre- and Post-TAVI
| |
Pre-TAVI |
2 days
post-TAVI |
7 days
post-TAVI |
3 months
post-TAVI |
| PL18-AUC10 |
20 (9, 178) |
40 (8, 123)* |
9 (7, 48)* |
66 (9, 110) |
| AR10-AUC30 |
1,077 (605, 1,198) |
834 (366, 995)* |
641 (267, 891)* |
1,002 (692, 1,250) |
| Platelet count (104/μL) |
20.2±6.4 |
12.8±4.5* |
14.2±5.6* |
15.8±5.3* |
| PT-INR |
1.06±0.29 |
1.12±0.13 |
1.04±0.10 |
1.07±0.23 |
| APTT (%) |
30.5±4.5 |
33.4±4.5* |
32.9±5.0* |
29.7±4.5 |
| D-dimer (μg/mL) |
1.0 (0.7, 1.9) |
3.4 (2.0, 5.6)* |
3.0 (1.8, 4.6)* |
1.5 (0.9, 2.6)* |
| Hemoglobin (g/dL) |
12.5±1.5 |
10.8±1.5* |
10.8±1.2* |
11.8±1.5* |
| Antithrombotic regimen |
| Aspirin |
11 (31%) |
26 (74%) |
28 (80%) |
28 (88%) |
| Clopidogrel |
7 (20%) |
6 (17%) |
7 (20%) |
6 (19%) |
| DAPT |
3 (9%) |
3 (9%) |
4 (11%) |
5 (14%) |
| DOAC |
5 (14%) |
6 (17%) |
6 (17%) |
6 (19%) |
| CT findings |
| HALT |
– |
– |
7 (20%)† |
5 (17%)‡ |
| Involved cusp |
| L |
– |
– |
2 (29%) |
1 (20%) |
| R |
– |
– |
2 (29%) |
1 (20%) |
| N |
– |
– |
3 (43%) |
3 (60%) |
| MLT (mm) |
– |
– |
1.70 (1.30, 2.10) |
1.70 (1.50, 1.95) |
*P<0.05 vs. Pre-TAVI, †data available for 35 patients, ‡data available for 29 patients. AR10-AUC30, area under the curve for the first 30 min for the atheroma chip tested at flow rate of 10 μL/min; HALT, hypoattenuated leaflet thrombosis; MLT, maximum leaflet thickness; PL18-AUC10, area under the curve for the first 10 min for the platelet chip tested at flow rate of 18 μL/min; TAVI, transcatheter aortic valve implantation. Other abbreviations as in Table 1.
HALT and MLT were evaluated using contrast-enhanced CT scans of the 35 patients 7 days post-TAVI and of 29 patients 3 months post-TAVI. HALT was observed in 7 (20%) and 5 (17%) patients 7 days and 3 months, respectively, post-TAVI. The median MLT was 1.60 mm (IQR, 1.30–2.10 mm) and 1.70 mm (IQR, 1.50–1.95 mm) 7 days and 3 months, respectively, post-TAVI.
Association Between T-TAS Parameters and MLT
Correlation analyses performed to determine the association between thrombogenicity and subclinical leaflet thrombosis following TAVI revealed there was no significant relationship between the presence of HALT at 7 days and 3 months post-TAVI and periprocedural T-TAS parameters. However, the decrease in AR10-AUC30
(as opposed to PL18-AUC10) from baseline to 2 days post-TAVI tended to be higher in patients with HALT than in those without HALT at 7 days and 3 months post-TAVI (Supplementary Figure).
Subsequently, we evaluated the associations between MLT at 7 days and 3 months post-TAVI and periprocedural thrombogenicity. A significant correlation was observed between MLT at 7 days post-TAVI and the decrease in AR10-AUC30
from baseline to 2 days post-TAVI (r=0.366, P=0.031). In contrast, the decrease in both PL18-AUC10
and the platelet count exhibited no significant correlation with MLT at 7 days post-TAVI (Figure 2). Univariate linear regression analysis conducted to elucidate the factors contributing to MLT at 7 days post-TAVI (Table 3) revealed that a decrease in the AR10-AUC30
from baseline to 2 days post-TAVI and an increase in the D-dimer level from baseline to 7 days post-TAVI were significant predictors of the MLT at 7 days post-TAVI (P=0.031 and P=0.022, respectively), whereas the antithrombotic regimen, prosthesis type, and PL18-AUC10
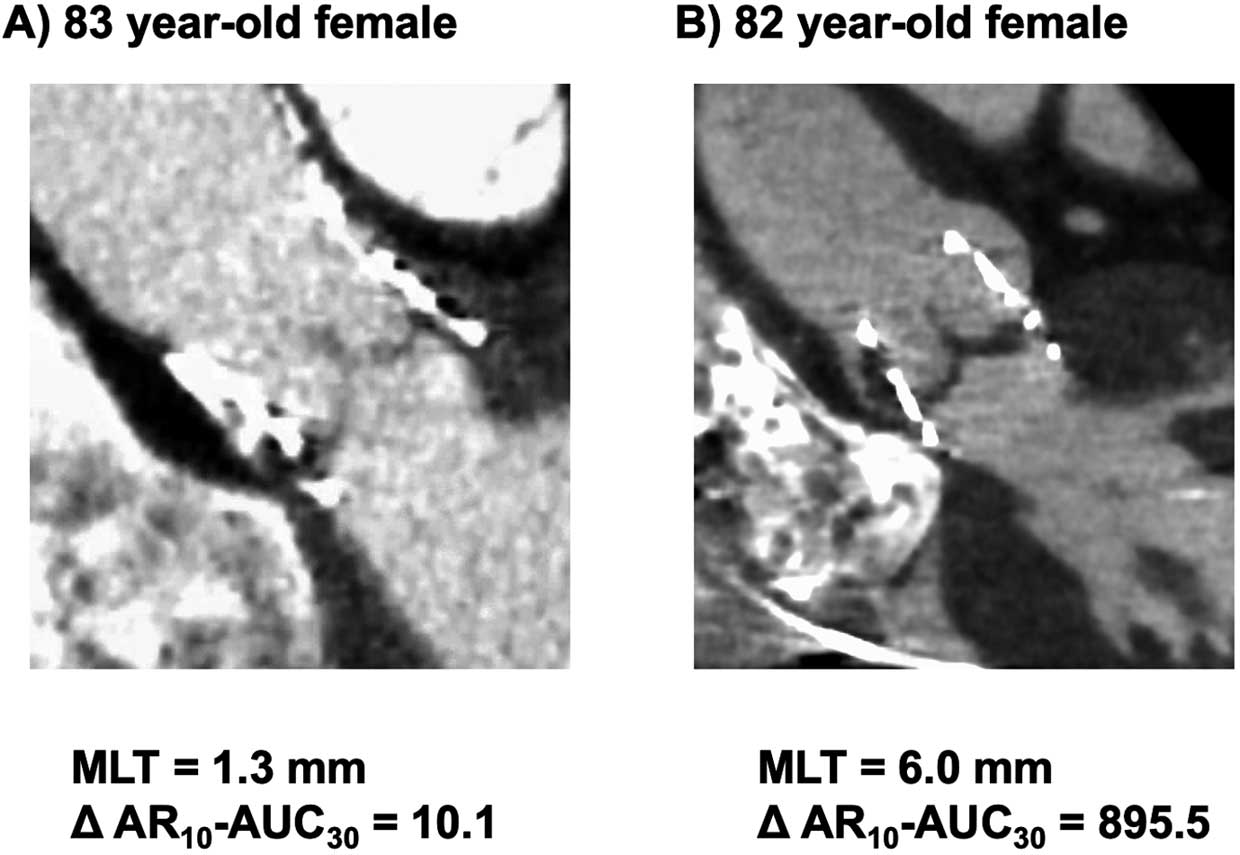
and its fluctuation were not. Figure 3 illustrates 2 representative cases depicting the relationship between the decrease in AR10-AUC30
and MLT at 7 days post-TAVI.
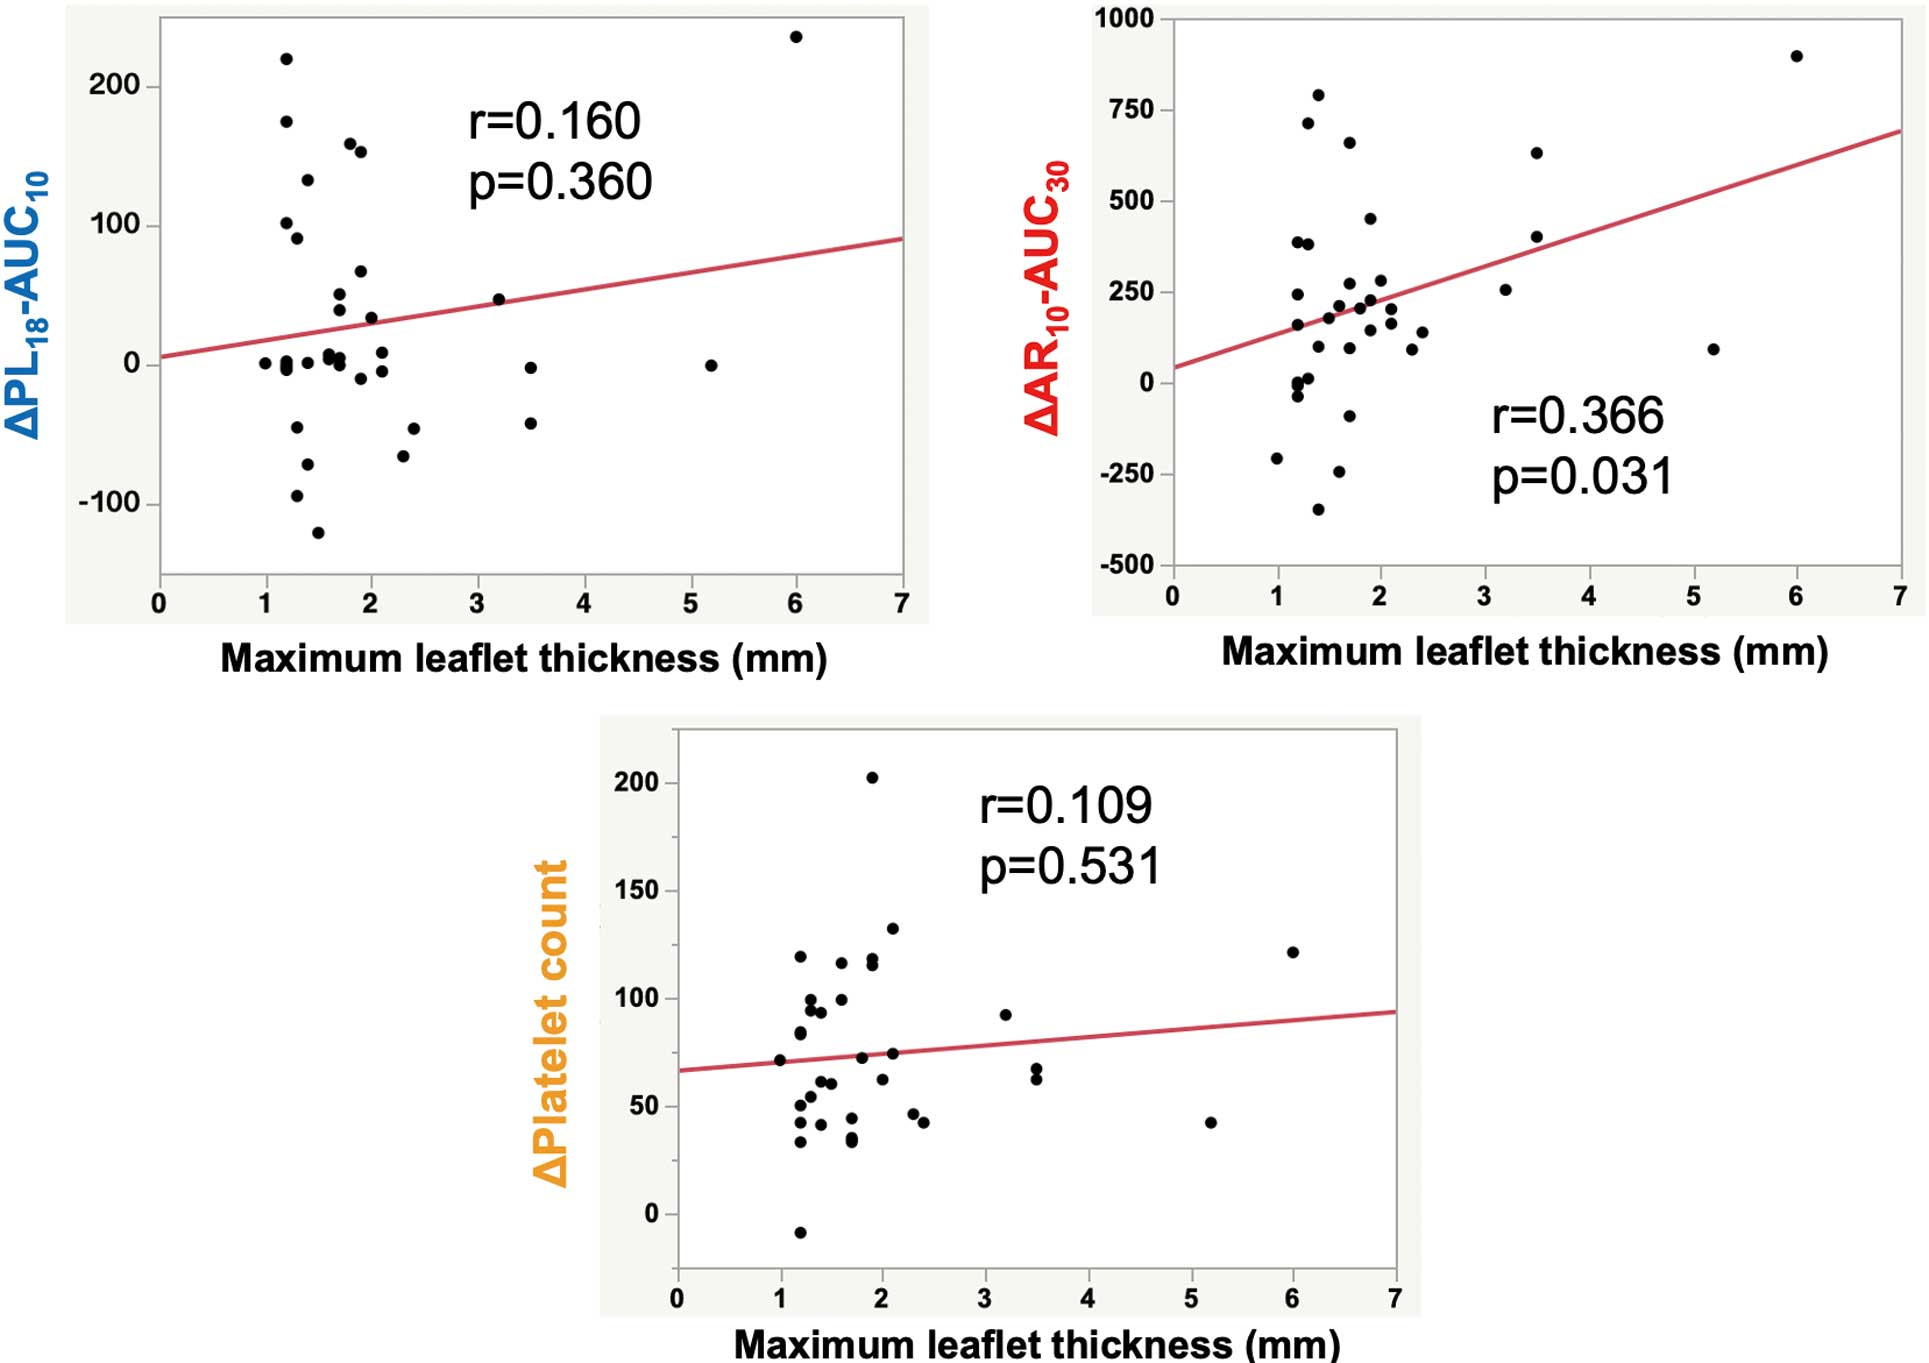
Table 3.
Univariate Linear Regression Analysis for the Maximum Leaflet Thickness 7 Days Post-TAVI
| Variable |
Maximum leaflet thickness 7 days post-TAVI |
| Beta coefficient |
P value |
| Age |
0.026 |
0.881 |
| Male |
−0.062 |
0.722 |
| Body mass index |
0.100 |
0.570 |
| Hypertension |
−0.152 |
0.383 |
| Diabetes mellitus |
0.294 |
0.087 |
| Atrial fibrillation |
−0.028 |
0.874 |
| eGFR |
−0.276 |
0.108 |
| BNP |
−0.048 |
0.784 |
| Hemoglobin |
0.207 |
0.232 |
| Aortic valve area |
0.171 |
0.325 |
| Sapien 3 (vs. Evolut R pro+) |
−0.001 |
0.997 |
| PT-INR |
−0.052 |
0.768 |
| APTT |
−0.210 |
0.234 |
| D-dimer before TAVI |
−0.121 |
0.518 |
| D-dimer 2 days post-TAVI |
−0.159 |
0.371 |
| D-dimer 7 days post-TAVI |
0.058 |
0.739 |
| ΔD-dimer (Pre–2 days post-TAVI) |
0.018 |
0.924 |
| ΔD-dimer (Pre–7 days post-TAVI) |
−0.411* |
0.022* |
| PL18-AUC10 before TAVI |
0.111 |
0.526 |
| AR10-AUC30 before TAVI |
0.025 |
0.888 |
| PL18-AUC10 2 days post-TAVI |
−0.005 |
0.977 |
| AR10-AUC30 2 days post-TAVI |
−0.244 |
0.158 |
| PL18-AUC10 7 days post-TAVI |
−0.112 |
0.536 |
| AR10-AUC30 7 days post-TAVI |
−0.123 |
0.496 |
| ΔPL18-AUC10 (Pre–2 days post-TAVI) |
0.160 |
0.360 |
| ΔAR10-AUC30 (Pre–2 days post-TAVI) |
0.366* |
0.031* |
| ΔPL18-AUC10 (Pre–7 days post-TAVI) |
0.174 |
0.334 |
| ΔAR10-AUC30 (Pre–7 days post-TAVI) |
0.132 |
0.464 |
| Platelet count before TAVI |
−0.029 |
0.867 |
| Platelet count 2 days post-TAVI |
−0.138 |
0.430 |
| Platelet count 7 days post-TAVI |
−0.173 |
0.319 |
| ΔPlatelet count (Pre–2 days post-TAVI) |
0.109 |
0.531 |
| ΔPlatelet count (Pre–7 days post-TAVI) |
0.170 |
0.328 |
| Antiplatelet therapy 7 days post-TAVI |
−0.154 |
0.378 |
| DOAC 7 days post-TAVI |
0.021 |
0.907 |
*Indicates a significant factor. Abbreviations as in Tables 1,2.
Factors Related to the Postoperative Decrease in AR10-AUC30
Post-TAVI and Clinical Events
To elucidate the factors associated with the change in AR10-AUC30
post-TAVI, the patients were divided into 2 groups based on the median value (200.9) of the ∆AR10-AUC30
(the decrease in AR10-AUC30
from baseline to 2 days post-TAVI). The groups were designated as the high and low ∆AR10-AUC30
groups. Baseline characteristics, thrombogenicity, CT findings, and clinical adverse events during follow-up (median, 323 days) were compared between groups (Table 4). No significant difference was observed in the implanted prosthesis type or antithrombotic regimen pre-TAVI between groups. In the high ∆AR10-AUC30
group, the baseline AR10-AUC30
and decrease in PL18-AUC10
from baseline to 2 days post-TAVI were significantly higher than in the low ∆AR10-AUC30
group. Additionally, patients in the high ∆AR10-AUC30
group tended to have a history of stroke and experience cardiac death than those in the low ∆AR10-AUC30
group.
Table 4.
Comparison of Baseline Clinical Demographics and Adverse Events During Follow-up Between Patients With High and Low AR10-AUC30 Difference Pre- and 2 Days Post-TAVI
| |
High ΔAR10-AUC30
(n=18) |
Low ΔAR10-AUC30
(n=17) |
P value |
| Baseline clinical demographics |
| Age (years) |
84.4±4.6 |
84.7±4.6 |
0.84 |
| Male sex |
8 (44%) |
5 (29%) |
0.36 |
| Hypertension |
15 (83%) |
15 (88%) |
0.68 |
| Diabetes mellitus |
3 (17%) |
6 (35%) |
0.20 |
| Coronary artery disease |
7 (39%) |
5 (29%) |
0.55 |
| Previous stroke |
7 (39%) |
2 (12%) |
0.06 |
| eGFR (mL/min/1.73 m2) |
62.7±15.6 |
58.9±15.6 |
0.47 |
| hs-cTnT (ng/mL) |
0.027 (0.019, 0.037) |
0.022 (0.014, 0.026) |
0.06 |
| Prosthesis type |
| Sapien 3 |
12 (67%) |
11 (65%) |
0.90 |
| Evolut PRO+ |
6 (33%) |
6 (35%) |
0.90 |
| Aspirin |
4 (22%) |
7 (41%) |
0.23 |
| Clopidogrel |
5 (28%) |
2 (12%) |
0.23 |
| DOAC |
3 (17%) |
2 (12%) |
0.68 |
| Preoperative thrombogenic parameters |
| Platelet count (104/μL) |
20.2±4.1 |
20.2±8.3 |
0.98 |
| PT-INR |
1.02±0.13 |
1.10±0.39 |
0.42 |
| APTT (s) |
29.6±3.1 |
31.3±5.5 |
0.30 |
| D-dimer (μg/mL) |
1.0 (0.6, 1.8) |
1.1 (0.8, 2.6) |
0.43 |
| PL18-AUC10 |
110 (10, 198) |
14 (9, 103) |
0.32 |
| AR10-AUC30 |
1,163 (974, 1,267) |
838 (506, 1,175) |
0.03 |
| Changes in thrombogenic parameters |
| ΔPL18-AUC10
(Pre-2 days post-TAVI) |
63±87 |
−7±67 |
0.01 |
| ΔPlatelet count (Pre-2 days post-TAVI) |
8.1±3.4 |
6.6±4.4 |
0.28 |
| CT findings 7 days post-TAVI |
| HALT |
4 (22%) |
3 (18%) |
0.73 |
| MLT (mm) |
1.8 (1.3, 2.4) |
1.5 (1.2, 2.0) |
0.27 |
| Clinical adverse events during the follow-up period |
| All-cause death |
3 (17%) |
1 (6%) |
0.31 |
| Cardiac death |
2 (11%) |
0 (0%) |
0.10 |
| Heart failure |
3 (17%) |
4 (24%) |
0.61 |
| Stroke |
1 (6%) |
1 (6%) |
0.97 |
hs-cTnT, high-sensitivity cardiac troponin T. Other abbreviations as in Tables 1,2.
Discussion
The main findings of this study can be clearly summarized. First, HALT, as detected using contrast-enhanced CT, was observed at 7 days and 3 months post-TAVI in one-fifth of patients who underwent TAVI. Second, TAVI induced a postprocedural decrease in thrombogenic parameters, evaluated using T-TAS, including PL18-AUC10, AR10-AUC30, and platelet count. Third, the degree of decrease in AR10-AUC30, distinct from PL18-AUC10
or platelet count, emerged as a significant predictor of leaflet thrombosis during the acute phase following TAVI.
Thrombocytopenia and a decline in thrombogenic parameters measured using T-TAS were observed in this study, consistent with findings from previous studies.6,12 Although the exact etiology of TAVI-related thrombocytopenia remains unknown, there are several hypotheses for this phenomenon. In the context of TAVI, platelet activation triggered by endothelial damage, shared stress changes stemming from prosthesis deployment, and an increase in platelet consumption or reduced platelet production might collectively result in a decline in platelet count.13–15 The T-TAS parameters, specifically PL18-AUC10
and AR10-AUC30, are associated with the platelet count,16 so our observed declines in PL18-AUC10
and AR10-AUC30
following TAVI may be attributed to thrombocytopenia.
Furthermore, a previous study found an increased postoperative decline in platelet and coagulation factors after TAVI,13 which could potentially arise from increased coagulation factor consumption triggered by the implanted prosthesis, periprocedural bleeding, and hemostasis following inserted sheath removal. This assertion is supported by reporting of TAVI inducing coagulation activation, as evaluated through prothrombin activation fragment 1+2.17 Furthermore, coronary angiography through the femoral artery, an even less invasive procedure than TAVI, can trigger localized coagulation activation at the femoral artery insertion site.18 Because of the distinct functionality of the PL chip in the T-TAS, which captures overall platelet activity without including subsequent activation of coagulation factors, and of the AR chip, designed to evaluate platelets and coagulation factor activation, the decline in the AR10-AUC30
noted in this study may reflect excessive consumption of platelets and coagulation-related factors following TAVI. We observed a significant positive correlation between the MLT at 7 days post-TAVI and the magnitude of the decrease in AR10-AUC30
but not in PL18-AUC10, which we suggest indicates that the formation of subclinical leaflet thrombosis may be attributed to fluctuations in the coagulation pathway rather than the platelet pathway. Although the precise etiology of this phenomenon remains unknown, one plausible explanation is that decreased degrees of AR10-AUC30
may reflect the extent of coagulation factor utilization and subsequent clot formation. However, further biochemical studies are needed to investigate the mechanism underlying the postprocedural decrease in this T-TAS parameter and its association with leaflet thrombosis.
Although numerous previous studies have consistently demonstrated the efficacy of anticoagulants in resolving and preventing subclinical leaflet thrombosis following TAVI,3,19,20 the underlying mechanism remains unknown. Previously, we reported a distinct variation: the AR10-AUC30
exhibits a reduction in response to anticoagulants but not to antiplatelet agents.10,21 Considering our findings, which indicated a relationship between leaflet thrombosis and variability in AR10-AUC30
following TAVI, anticoagulants may diminish the development of leaflet thrombosis by suppressing the coagulation cascade and subsequent thrombus formation. However, further studies are needed to explore the underlying molecular mechanism of anticoagulant efficacy.
Study Limitations
First, it was a single-center observational study, and the patient cohort was relatively small. Therefore, the statistical power of the study was insufficient to perform multivariate analysis and evaluate the significance of fluctuations in AR10-AUC30. The results should be carefully interpreted, and emphasize the need for further multicenter and large-scale studies to validate these findings. Second, most patients were administered antiplatelet agents as a postprocedural antithrombotic regimen, potentially affecting PL18-AUC10
and its fluctuations. Given the limited number of patients not receiving any antiplatelet therapy 2 days (n=5) and 7 days (n=4) post-TAVI, a statistically meaningful analysis could not be conducted to examine the effect of postprocedural antiplatelet therapy on the PL18-AUC10
parameter and its fluctuation. Third, apart from T-TAS, other thrombogenic parameters were not investigated within the scope of this study. This highlights the importance of further investigations with further biochemical assessments and larger cohorts to validate the findings of this study.
In conclusion, thrombogenicity as measured using T-TAS exhibited a transient decrease following TAVI, with a noticeable link observed between the decline in AR10-AUC30
and progression of leaflet thrombosis. This finding suggests that using T-TAS for monitoring thrombogenicity may be useful for predicting the progression of leaflet thrombosis and identifying patients at a high risk of its occurrence.
Acknowledgments
The authors thank Satomi Iwashita, Megumi Nagahiro, and Saeko Tokunaga for their skillful technical assistance. This study was supported in part by Grants-in-Aid for Scientific Research (#20K08451) from the Ministry of Education, Culture, Sports, Science and Technology of Japan.
Disclosure
K.K., K.T. are members of Circulation Reports’ Editorial Team.
K.K. received Grants-in-Aid for Scientific Research (20K08451) from the Ministry of Education, Culture, Sports, Science and Technology of Japan, received remuneration for lectures from Bayer Yakuhin, Ltd., Daiichi Sankyo Co., Ltd., Novartis Pharma AG., Otsuka Pharmaceutical Co., Ltd., Bristol-Myers K.K., and Kowa Pharmaceutical Co. Ltd., received trust research/joint research funds from Bayer Yakuhin, Ltd., and Daiichi Sankyo Co., Ltd., and received scholarship funds from Abbott Medical Co., Ltd. K.T. received significant research grants from Bayer Yakuhin, Ltd., Bristol-Myers K.K., EA Pharma Co., Ltd., Mochida Pharmaceutical Co., Ltd., CSL Behring K.K., JIMRO Co., Ltd., Alexion Pharmaceuticals, Inc., AnGes, Inc., PPD-Shin Nippon Biomedical Laboratories K.K., SUGI BEE GARDEN (International) Co., Ltd., Pfizer Japan Inc., scholarship funds from AMI Co., Ltd., Boehringer Ingelheim Japan, Daiichi Sankyo Co., Ltd., ONO Pharmaceutical Co., Ltd., Otsuka Pharmaceutical Co., Ltd., Takeda Pharmaceutical Co., Ltd., Abbott Medical Co., Ltd., and ITI Co., Ltd. and honoraria from Amgen K.K., Abbott Medical Co., Ltd., AstraZeneca K.K., Bayer Yakuhin, Ltd., Daiichi Sankyo Co., Ltd., Medtronic Japan Co., Ltd., Kowa Pharmaceutical Co. Ltd., Kyowa Kirin Co., Ltd., Novartis Pharma K.K., Otsuka Pharmaceutical Co., Ltd., Pfizer Japan Inc., and Janssen Pharmaceutical K.K., and belongs to endowed departments donated by Abbott Japan Co., Ltd., Boston Scientific Japan K.K., Fides-one, Inc., GM Medical Co., Ltd., ITI Co., Ltd., Kaneka Medix Co., Ltd., NIPRO Corporation, Terumo Co, Ltd., Abbott Medical Co., Ltd., Fukuda Denshi Co., Ltd., Japan Lifeline Co., Ltd., and Medtronic Japan Co., Ltd.
IRB Information
The Human Ethics Committee of Kumamoto University approved this study protocol (No. 2155).
Supplementary Files
Please find supplementary file(s);
https://doi.org/10.1253/circrep.CR-23-0092
References
- 1.
Kamon T, Kaneko H, Kiriyama H, Itoh H, Fujiu K, Kumazawa R, et al. Transcatheter aortic valve implantation and surgical aortic valve replacement for aortic stenosis in Japan: Analysis of a nationwide inpatient database. Circ Rep 2020; 2: 753–758, doi:10.1253/circrep.CR-20-0116.
- 2.
Makkar RR, Blanke P, Leipsic J, Thourani V, Chakravarty T, Brown D, et al. Subclinical leaflet thrombosis in transcatheter and surgical bioprosthetic valves: PARTNER 3 cardiac computed tomography substudy. J Am Coll Cardiol 2020; 75: 3003–3015, doi:10.1016/j.jacc.2020.04.043.
- 3.
Pache G, Schoechlin S, Blanke P, Dorfs S, Jander N, Arepalli CD, et al. Early hypo-attenuated leaflet thickening in balloon-expandable transcatheter aortic heart valves. Eur Heart J 2016; 37: 2263–2271, doi:10.1093/eurheartj/ehv526.
- 4.
Cordoba-Soriano JG, Puri R, Amat-Santos I, Ribeiro HB, Abdul-Jawad Altisent O, del Trigo M, et al. Valve thrombosis following transcatheter aortic valve implantation: A systematic review. Rev Esp Cardiol (Engl Ed) 2015; 68: 198–204, doi:10.1016/j.rec.2014.10.003.
- 5.
Chakravarty T, Sondergaard L, Friedman J, De Backer O, Berman D, Kofoed KF, et al. Subclinical leaflet thrombosis in surgical and transcatheter bioprosthetic aortic valves: An observational study. Lancet 2017; 389: 2383–2392, doi:10.1016/S0140-6736(17)30757-2.
- 6.
Dvir D, Genereux P, Barbash IM, Kodali S, Ben-Dor I, Williams M, et al. Acquired thrombocytopenia after transcatheter aortic valve replacement: Clinical correlates and association with outcomes. Eur Heart J 2014; 35: 2663–2671, doi:10.1093/eurheartj/ehu082.
- 7.
Pollari F, Horna S, Rottmann M, Langhammer C, Bertsch T, Fischlein T. A New definition of thrombocytopenia following transcatheter aortic valve implantation: Incidence, outcome, and predictors. J Cardiovasc Dev Dis 2022; 9: 388, doi:10.3390/jcdd9110388.
- 8.
Kaikita K, Hosokawa K, Dahlen JR, Tsujita K. Total Thrombus-Formation Analysis System (T-TAS): Clinical application of quantitative analysis of thrombus formation in cardiovascular disease. Thromb Haemost 2019; 119: 1554–1562, doi:10.1055/s-0039-1693411.
- 9.
Arima Y, Kaikita K, Ishii M, Ito M, Sueta D, Oimatsu Y, et al. Assessment of platelet-derived thrombogenicity with the total thrombus-formation analysis system in coronary artery disease patients receiving antiplatelet therapy. J Thromb Haemost 2016; 14: 850–859, doi:10.1111/jth.13256.
- 10.
Ito M, Kaikita K, Sueta D, Ishii M, Oimatsu Y, Arima Y, et al. Total Thrombus-Formation Analysis System (T-TAS) can predict periprocedural bleeding events in patients undergoing catheter ablation for atrial fibrillation. J Am Heart Assoc 2016; 5: e002744, doi:10.1161/JAHA.115.002744.
- 11.
Mitsuse T, Kaikita K, Ishii M, Oimatsu Y, Nakanishi N, Ito M, et al. Total Thrombus-Formation Analysis System can predict 1-year bleeding events in patients with coronary artery disease. J Atheroscler Thromb 2020; 27: 215–225, doi:10.5551/jat.49700.
- 12.
Ishii M, Kaikita K, Mitsuse T, Nakanishi N, Oimatsu Y, Yamashita T, et al. Reduction in thrombogenic activity and thrombocytopenia after transcatheter aortic valve implantation: The ATTRACTIVE-TTAS study. Int J Cardiol Heart Vasc 2019; 23: 100346, doi:10.1016/j.ijcha.2019.100346.
- 13.
Mitrosz M, Kazimierczyk R, Chlabicz M, Sobkowicz B, Waszkiewicz E, Lisowska A, et al. Perioperative thrombocytopenia predicts poor outcome in patients undergoing transcatheter aortic valve implantation. Adv Med Sci 2018; 63: 179–184, doi:10.1016/j.advms.2017.11.001.
- 14.
Nobili M, Sheriff J, Morbiducci U, Redaelli A, Bluestein D. Platelet activation due to hemodynamic shear stresses: Damage accumulation model and comparison to in vitro measurements. ASAIO J 2008; 54: 64–72, doi:10.1097/MAT.0b013e31815d6898.
- 15.
Skeith L, Baumann Kreuziger L, Crowther MA, Warkentin TE. A practical approach to evaluating postoperative thrombocytopenia. Blood Adv 2020; 4: 776–783, doi:10.1182/bloodadvances.2019001414.
- 16.
Nakanishi N, Kaikita K, Ishii M, Kuyama N, Tabata N, Ito M, et al. Hemodialysis-related low thrombogenicity measured by total thrombus-formation analysis system in patients undergoing percutaneous coronary intervention. Thromb Res 2021; 200: 141–148, doi:10.1016/j.thromres.2021.02.004.
- 17.
Sedaghat A, Falkenberg N, Sinning JM, Kulka H, Hammerstingl C, Nickenig G, et al. TAVI induces an elevation of hemostasis-related biomarkers, which is not causative for post-TAVI thrombocytopenia. Int J Cardiol 2016; 221: 719–725, doi:10.1016/j.ijcard.2016.07.094.
- 18.
Tandar A, Lehman CM, Rodgers GM, Meredith KG, Muhlestein JB, Barry WH, et al. Activation of coagulation during routine diagnostic coronary angiography. EuroIntervention 2007; 3: 345–349, doi:10.4244/eijv3i3a63.
- 19.
Makkar RR, Fontana G, Jilaihawi H, Chakravarty T, Kofoed KF, De Backer O, et al. Possible subclinical leaflet thrombosis in bioprosthetic aortic valves. N Engl J Med 2015; 373: 2015–2024, doi:10.1056/NEJMoa1509233.
- 20.
Hansson NC, Grove EL, Andersen HR, Leipsic J, Mathiassen ON, Jensen JM, et al. Transcatheter aortic valve thrombosis: Incidence, predisposing factors, and clinical implications. J Am Coll Cardiol 2016; 68: 2059–2069, doi:10.1016/j.jacc.2016.08.010.
- 21.
Ishii M, Kaikita K, Ito M, Sueta D, Arima Y, Takashio S, et al. Direct oral anticoagulants form thrombus different from warfarin in a microchip flow chamber system. Sci Rep 2017; 7: 7399, doi:10.1038/s41598-017-07939-6.
