Arrhythmia/Electrophysiology
Transcriptome Discovery of Genes in the Three Phases of Autophagy That Are Upregulated During Atrial Fibrillation
2023 年 5 巻 4 号 p. 114-122

詳細
2023 年 5 巻 4 号 p. 114-122
Background: Autophagy may contribute to the maintenance of atrial fibrillation (AF), but no previous study has concurrently surveyed all 3 phases of autophagy, namely autophagosome formation, lysosome formation, and autophagosome-lysosome fusion. Here we aimed to identify disorders involving various phases of autophagy during AF.
Methods and Results: We used bioinformatic techniques to analyze publicly available DNA microarray datasets from the left atrium (LA) and right atrium (RA) of 7 patients with AF and 6 patients with normal sinus rhythm who underwent valvular surgeries. We compared gene expression levels in the LA (AF-LA) and RA of patients with AF with those in the LA and RA of patients with normal sinus rhythm. Several differentially expressed genes in the AF-LA sample were significantly associated with the Gene Ontogeny term ‘Autophagy’, indicating that the expression of autophagic genes was specifically altered in this dataset. In particular, the expression of genes known or suspected to be involved in autophagosome formation (autophagy related 5 [ATG5], autophagy related 10 [ATG10], autophagy related 12 [ATG12], and light chain 3B [LC3B]), lysosome formation (lysosomal associated membrane protein 1 [LAMP1] and lysosomal associated membrane protein 2 [LAMP2]), and autophagosome-lysosome fusion (synaptosome associated protein 29 [SNAP29], SNAP associated protein [SNAPIN], and syntaxin 17 [STX17]) was significantly upregulated in the LA-AF dataset.
Conclusions: Autophagy is activated excessively in, and may perpetuate, AF.
Atrial fibrillation (AF) is a very common cardiac arrhythmia in Western countries,1,2 but given that the population with AF in Asia is poised to exceed that in Europe and North America,3 AF can be considered a global problem, particularly of aging societies. Previous studies have suggested that defects in autophagy may contribute to AF.4 In particular, macroautophagy is an essential process that polices the intracellular environment by removing misfolded proteins and damaged organelles.5 However, excessive activation of this pathway, as may occur in AF, is toxic.2 Conversely, insufficient autophagy is similarly not beneficial for cells. For example, aging attenuates autophagy, and impaired autophagy increases the amount of intracellular protein waste, thereby increasing oxidative stress.6,7 In addition, retarded autophagy promotes hypertrophy, fibrosis, and diastolic dysfunction, thus leading to the development of heart failure despite preservation of a normal ejection fraction.8–11
Autophagy comprises 3 phases, namely autophagosome formation, lysosome formation, and autophagosome-lysosome fusion,6,7 and assessing the overall process is complex. One way to circumvent this difficulty has been to study the component steps individually, but any individual contribution may not accurately reflect the overall autophagic state. For example, the depressed autophagy associated with aging involves both increased autophagosome formation and reduced autophagosome-lysosome fusion. Were only autophagosome formation evaluated, its heightened activity may lead to the erroneous conclusion that the aging-associated abnormal autophagic state is due to hyperactivity overall. However, in its aging-associated form, autophagy is not exacerbated, but rather attenuated overall, because autophagic autophagosome-lysosome fusion is blocked.6
We hypothesized that AF may result from abnormal electrical remodeling due to increased autophagy. In this regard, several autophagosome-formation genes are upregulated in patients with AF.2,12 However, no study has assessed gene expression in all 3 phases of autophagy concurrently in AF patients. To this end, in the present study we used bioinformatics to concurrently compare the expression of genes associated with autophagosome formation, lysosome formation, and autophagosome-lysosome fusion between patients with AF and those with normal sinus rhythm.
Using human DNA microarray data, we compared gene expression levels in heart tissue between patients with persistent AF and those with normal sinus rhythm. Specifically, we downloaded the gene expression dataset GSE79768 as CEL files from the Gene Expression Omnibus (GEO) database (https://www.ncbi.nlm.nih.gov/geo/), which was derived from the platform HG-U133_Plus_2, genome version hg19 (Homo sapiens). To generate this dataset, paired samples of the appendages of the left and right atrium were obtained from 13 patients with either persistent AF (n=7; 3 men [42.9%]) or normal sinus rhythm (n=6; 2 men [33.3%]) who underwent valvular surgery for disease of the mitral valve or coronary artery;13 that previous study did not address autophagy, which is the focus of the present study. The mean (±SD) age of the 7 patients with AF was 48.3±11.9 years, whereas that of the 6 with normal sinus rhythm was 63.7±16.7 years. We compared 4 groups of data: the LA and RA of patients with AF (AF-LA and AF-RA, respectively) and the LA and RA of patients with normal sinus rhythm (Sinus-LA and Sinus-RA, respectively).
Statistical Analysis of Differentially Expressed GenesWe used Transcriptome Analysis Console (TAC) 4.0.2 (Affymetrix, Santa Clara, CA, USA) in the present study. TAC performs statistical analyses to produce a list of significantly differentially expressed genes (DEGs) and generates a graphic representation of gene expression patterns. Most algorithms provided in TAC 4.0.2 were implemented through the R or Bioconductor packages (R Foundation for Statistical Computing, Vienna, Austria). According to published data,14 we defined P<0.05 as the cut-off value; however, after the initial round of TAC filtering (fold changes of <−2 or >2), we incorporated genes with fold changes of <−1 or >1 to obtain additional candidates. Specifically, the initial volcano plot, bar graph, Venn diagram, and Kyoto Encyclopedia of Genes and Genomes (KEGG) pathway analysis involved genes with P<0.05 and fold changes of <−2 or >2. The follow-up volcano plot and WikiPathways analysis assessed genes with P<0.05 and fold changes of <−1 or >1. For functional annotation, we used the Database for Annotation, Visualization, and Integrated Discovery (DAVID) 6.8.15
Visualization of Gene Expression PatternsWe used KEGG16–18 and WikiPathways19–22 to visualize gene expression patterns. The KEGG-based figures were customized by using DAVID; the images for WikiPathways were obtained by using TAC. The KEGG and WikiPathways analyses assessed genes with P<0.05 and a false discovery rate (FDR) P<0.2. The FDR was applied at a rate of 0.2, as in previous studies.23,24
Heat MapWe used Prism 9.5.0 (GraphPad Software, San Diego, CA, USA) to perform heat map analyses of gene expression related to the 3 phases of autophagy. The color pattern setting was viridis, and the scale setting was calculated automatically by Prism. Normalization was used in this heat map analysis. Normalization is a scaling technique method in which data points are shifted and rescaled so that they end up in the range 0–1. The formula for calculating the normalized score (Xnew) is as follows:
Xnew = (X − Xmin) / (Xmax − Xmin)
where Xmax and Xmin are the maximum and minimum values of the feature, respectively. X is the non-normalized data point.
Paired samples of LA and RA were obtained from 13 patients with either persistent AF (n=7) or sinus rhythm (n=6) who underwent valvular surgery. Four groups of data were compared: AF-LA, AF-RA, Sinus-LA, and Sinus-RA. We first compared AF-LA with Sinus-LA to obtain downregulated (Supplementary Table 1) and upregulated (Supplementary Table 2) DEGs in the AF-LA. The total number of genes analyzed was 54,613, of which 433 genes (308 upregulated; 125 downregulated) passed the filter criteria (Figure 1A). We then generated a volcano plot for which the filter criteria were fold change >2 or <−2 and P<0.05 (Figure 1B). Using bar graphs, we then summarized the DEGs for AF-LA vs. AF-RA, AF-LA vs. Sinus-LA, AF-LA vs. Sinus-RA, AF-RA vs. Sinus-LA, AF-RA vs. Sinus-RA, and Sinus-LA vs. Sinus-RA (Figure 2A). To identify AF-specific DEGs in the LA, we organized the DEGs of the AF-LA vs. Sinus-LA, AF-LA vs. AF-RA, and Sinus-LA vs. Sinus-RA using a Venn diagram; this process revealed that the expression of 317 genes was uniquely changed in the AF-LA dataset (Figure 2B). Volcano plots of DEGs in AF-LA vs. AF-RA and Sinus-LA vs. Sinus-RA are provided in Supplementary Figures 1,2.

(A) We detected differentially expressed genes (DEGs) in the left atrium of patients with atrial fibrillation (AF-LA) compared with patients with sinus rhythm (Sinus-LA). The filter criteria were fold changes >2 or <−2 and P<0.05. In all, 54,613 genes were evaluated, of which 433 (308 upregulated, 125 downregulated) passed the filter criteria. (B) Volcano plot comparing fold change (AF-LA/Sinus-LA gene expression) against the P value of the difference in gene expression. Red dots indicate genes upregulated in the AF-LA; green dots indicate downregulated genes; and gray dots indicate genes that did not pass the filter criteria.
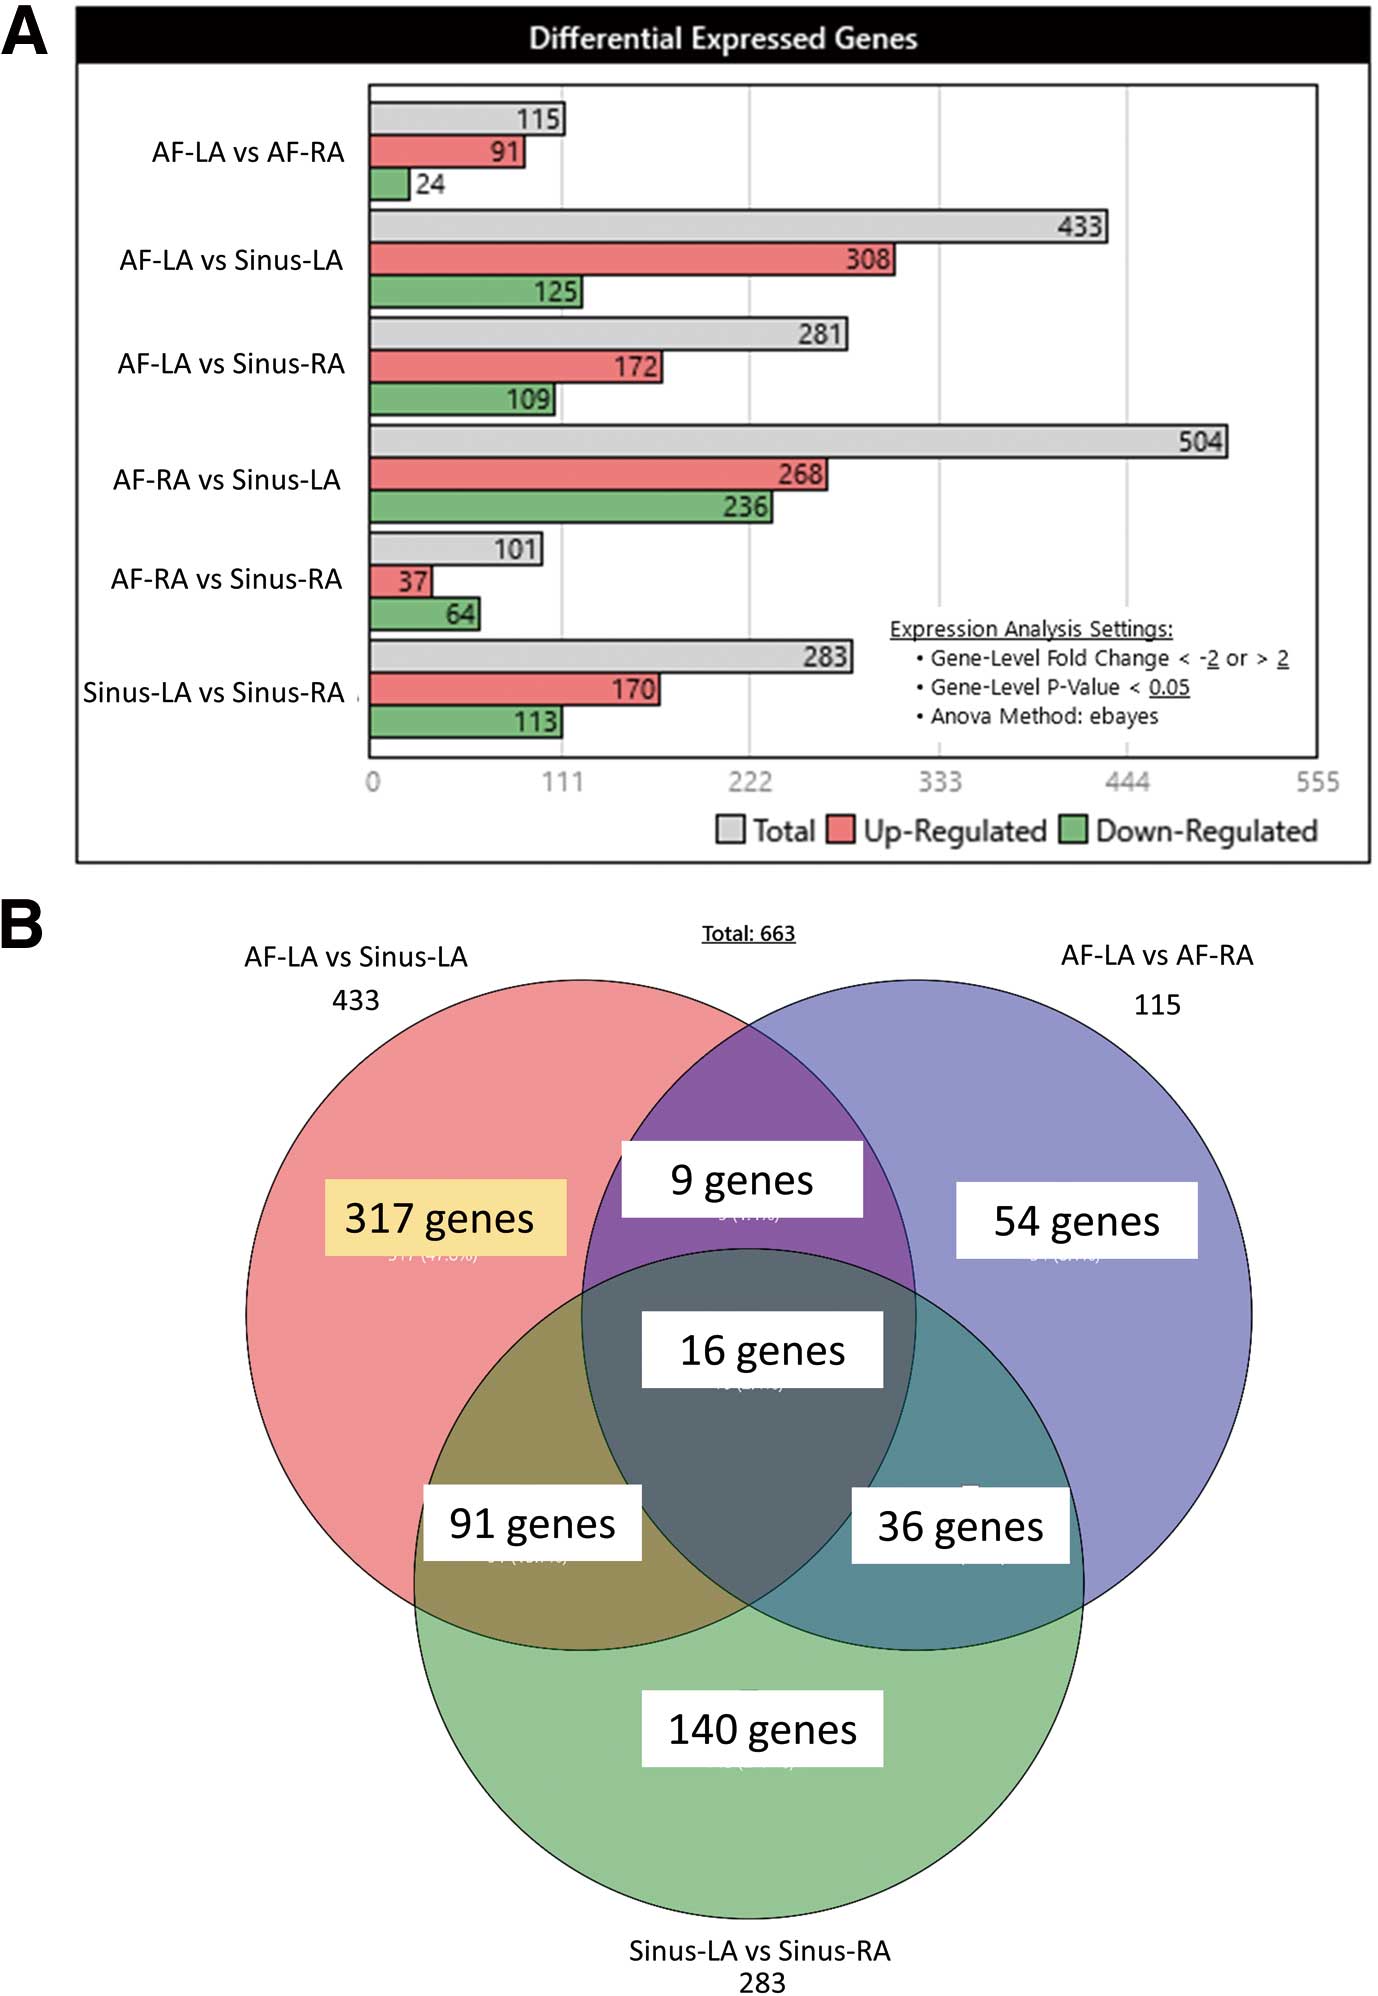
(A) Differentially expressed genes (DEGs) in the left and right atria of patients with AF (AF-LA and AF-RA, respectively) and those with normal sinus rhythm (Sinus-LA and Sinus-RA, respectively). (B) We compared “AF-LA vs. Sinus-LA”, “AF-LA vs. AF-RA”, and “Sinus-LA vs. Sinus-RA” to detect AF-LA-specific DEGs. Organizing the DEGs in these 3 groups using a Venn diagram showed that the expression of 317 genes was uniquely changed in the AF-LA. All false discovery rate-corrected P values <0.2.
Next, we used DAVID to better understand the biological functions of the 317 AF-specific genes in the LA (Supplementary Table 3). The Table presents the top 20 KEGG terms according to the P value-based analysis of the KEGG pathway analysis in the DAVID Functional Annotation Chart; the complete data from this analysis are presented in Supplementary Table 4. The most frequent term, ‘Phagosome’, was associated with 12 of the DEGs specifically associated with the AF-LA. The original data are provided in Supplementary Table 1. We summarized the genes in the Table as a KEGG pathway (Figure 3), with the red stars in Figure 3 indicating DEGs specific to the AF-LA. We also compared DEGs between “AF-LA vs. AF-RA” and “AF-RA vs. Sinus-RA”, but KEGG pathway analysis did not reveal any autophagy-specific changes (Supplementary Table 5).
| Term | Number of genes |
% | P value | FDR | ||
|---|---|---|---|---|---|---|
| Uncorrected | Bonferroni | Benjamini | ||||
| Leishmaniasis | 9 | 3.17 | 0.000030 | 0.01 | 0.00 | 0.00 |
| Phagosome | 12 | 4.23 | 0.000031 | 0.01 | 0.00 | 0.00 |
| Intestinal immune network for IgA production | 7 | 2.46 | 0.000121 | 0.03 | 0.01 | 0.01 |
| Asthma | 5 | 1.76 | 0.001429 | 0.29 | 0.07 | 0.07 |
| Antigen processing and presentation | 7 | 2.46 | 0.001527 | 0.30 | 0.07 | 0.07 |
| Rheumatoid arthritis | 7 | 2.46 | 0.003728 | 0.59 | 0.12 | 0.11 |
| Inflammatory bowel disease | 6 | 2.11 | 0.003784 | 0.59 | 0.12 | 0.11 |
| Staphylococcus aureus infection | 7 | 2.46 | 0.004360 | 0.65 | 0.12 | 0.11 |
| Hematopoietic cell lineage | 7 | 2.46 | 0.005069 | 0.70 | 0.12 | 0.11 |
| Epithelial cell signaling in Helicobacter pylori infection | 6 | 2.11 | 0.005204 | 0.71 | 0.12 | 0.11 |
| Adherens junction | 6 | 2.11 | 0.005527 | 0.73 | 0.12 | 0.11 |
| Th17 cell differentiation | 7 | 2.46 | 0.007704 | 0.84 | 0.14 | 0.13 |
| Arrhythmogenic right ventricular cardiomyopathy | 6 | 2.11 | 0.007773 | 0.84 | 0.14 | 0.13 |
| Regulation of actin cytoskeleton | 10 | 3.52 | 0.008338 | 0.86 | 0.14 | 0.13 |
| Breast cancer | 8 | 2.82 | 0.009321 | 0.89 | 0.15 | 0.14 |
| Cell adhesion molecules | 8 | 2.82 | 0.013083 | 0.96 | 0.19 | 0.18 |
| Viral myocarditis | 5 | 1.76 | 0.015500 | 0.98 | 0.21 | 0.20 |
| Th1 and Th2 cell differentiation | 6 | 2.11 | 0.016005 | 0.98 | 0.21 | 0.20 |
| Prostate cancer | 6 | 2.11 | 0.019695 | 0.99 | 0.24 | 0.22 |
| Influenza A | 8 | 2.82 | 0.020036 | 0.99 | 0.24 | 0.22 |
Benjamini: Benjamini-Hochberg procedure; Bonferroni, Bonferroni correction; FDR, false discovery rate; Th, T helper.
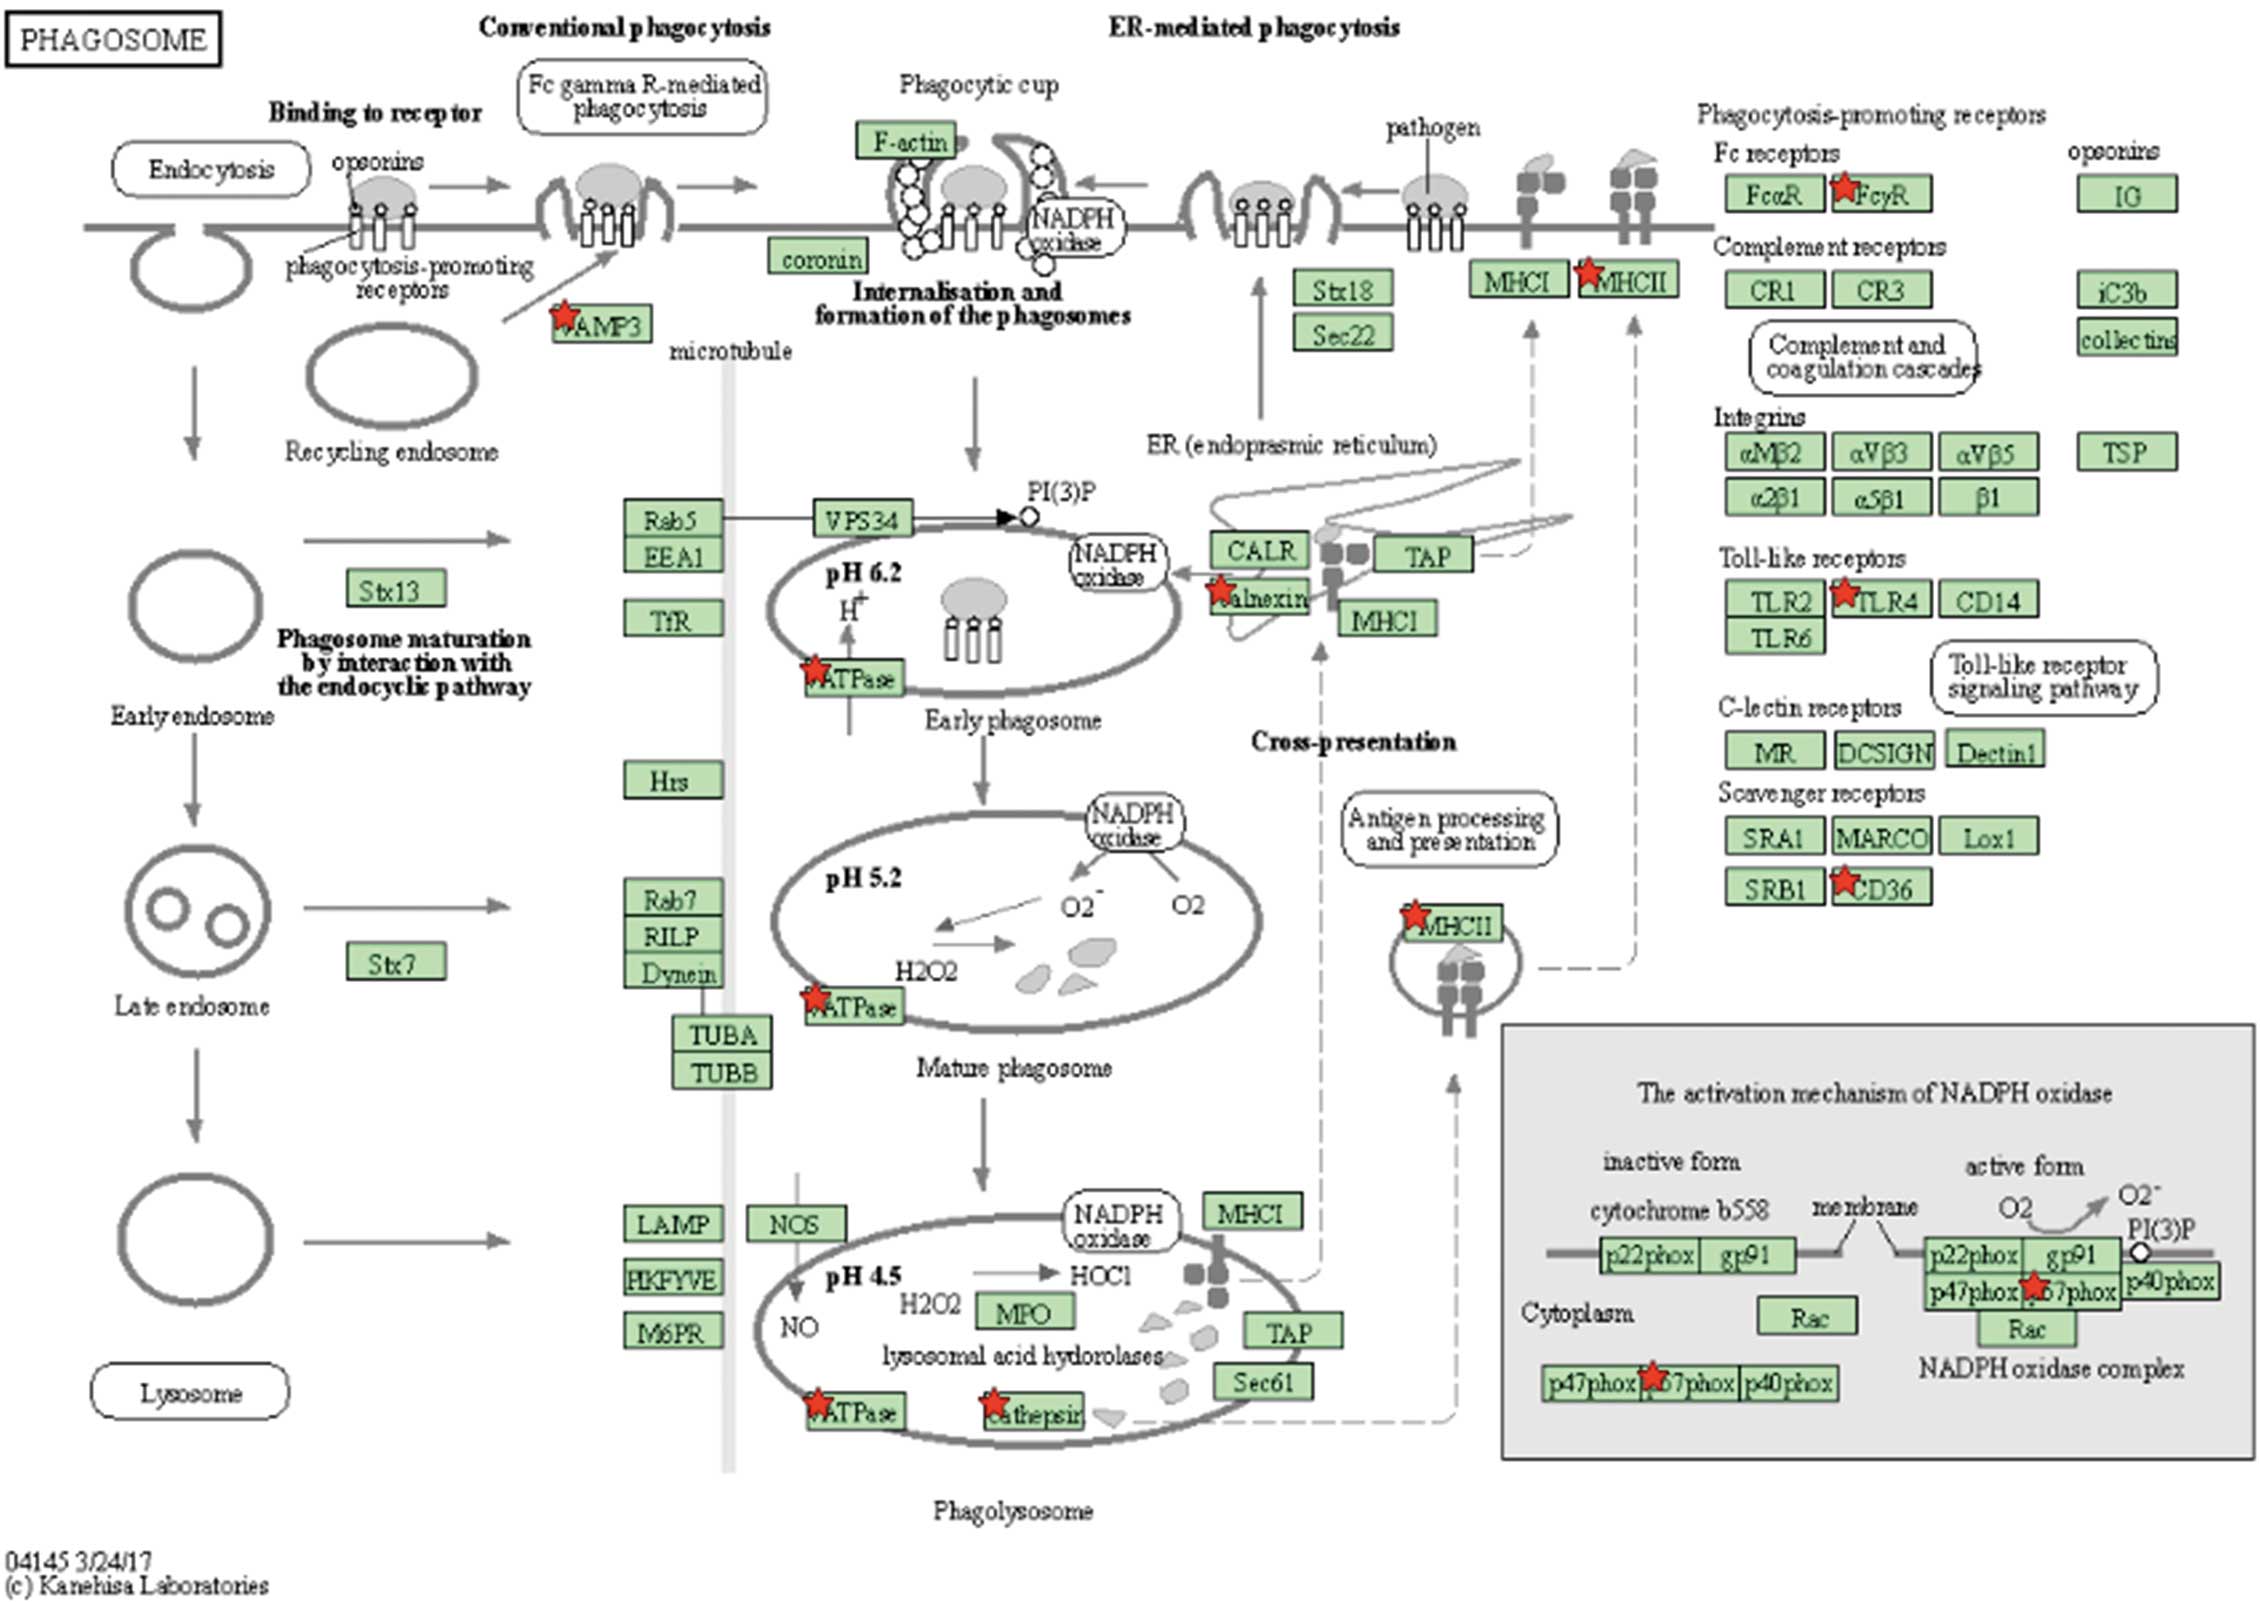
Molecular pathway map prepared using the Kyoto Encyclopedia of Genes and Genomes (KEGG); red stars indicate genes upregulated in the left atrium of patients with atrial fibrillation (AF-LA; Table). No genes in the AF-LA showed downregulated expression. All false discovery rate-corrected P values <0.2. The KEGG pathway map hsa04145 is reproduced with the permission of “KEGG Copyright Permission 221802”.
We then created another volcano plot to reveal DEGs in the AF-LA, but this time the filter criterion was P<0.05 only (Figure 4A). We then used TAC to summarize the genes in WikiPathways that were found to be upregulated (Figure 4B) and downregulated (Figure 4C); the raw data for Figure 4 are shown in Supplementary Figure 3. We further evaluated the expression levels of the DEGs in the AF-LA (Figure 4B,C) that are known or suspected markers of autophagy. As shown in Figure 5, Significantly upregulated DEGs in the AF-LA were autophagy related 5 (ATG5), autophagy related 10 (ATG10), autophagy related 12 (ATG12), light chain 3B (LC3B), lysosomal associated membrane protein 1 (LAMP1), lysosomal associated membrane protein 2 (LAMP2), synaptosome associated protein 29 (SNAP29), SNAP associated protein (SNAPIN), and syntaxin 17 (STX17). Heat map analyses of gene expression related to the 3 phases of autophagy are summarized in Figure 6, which was produced by using the same data as used to produce Figures 4C,5.
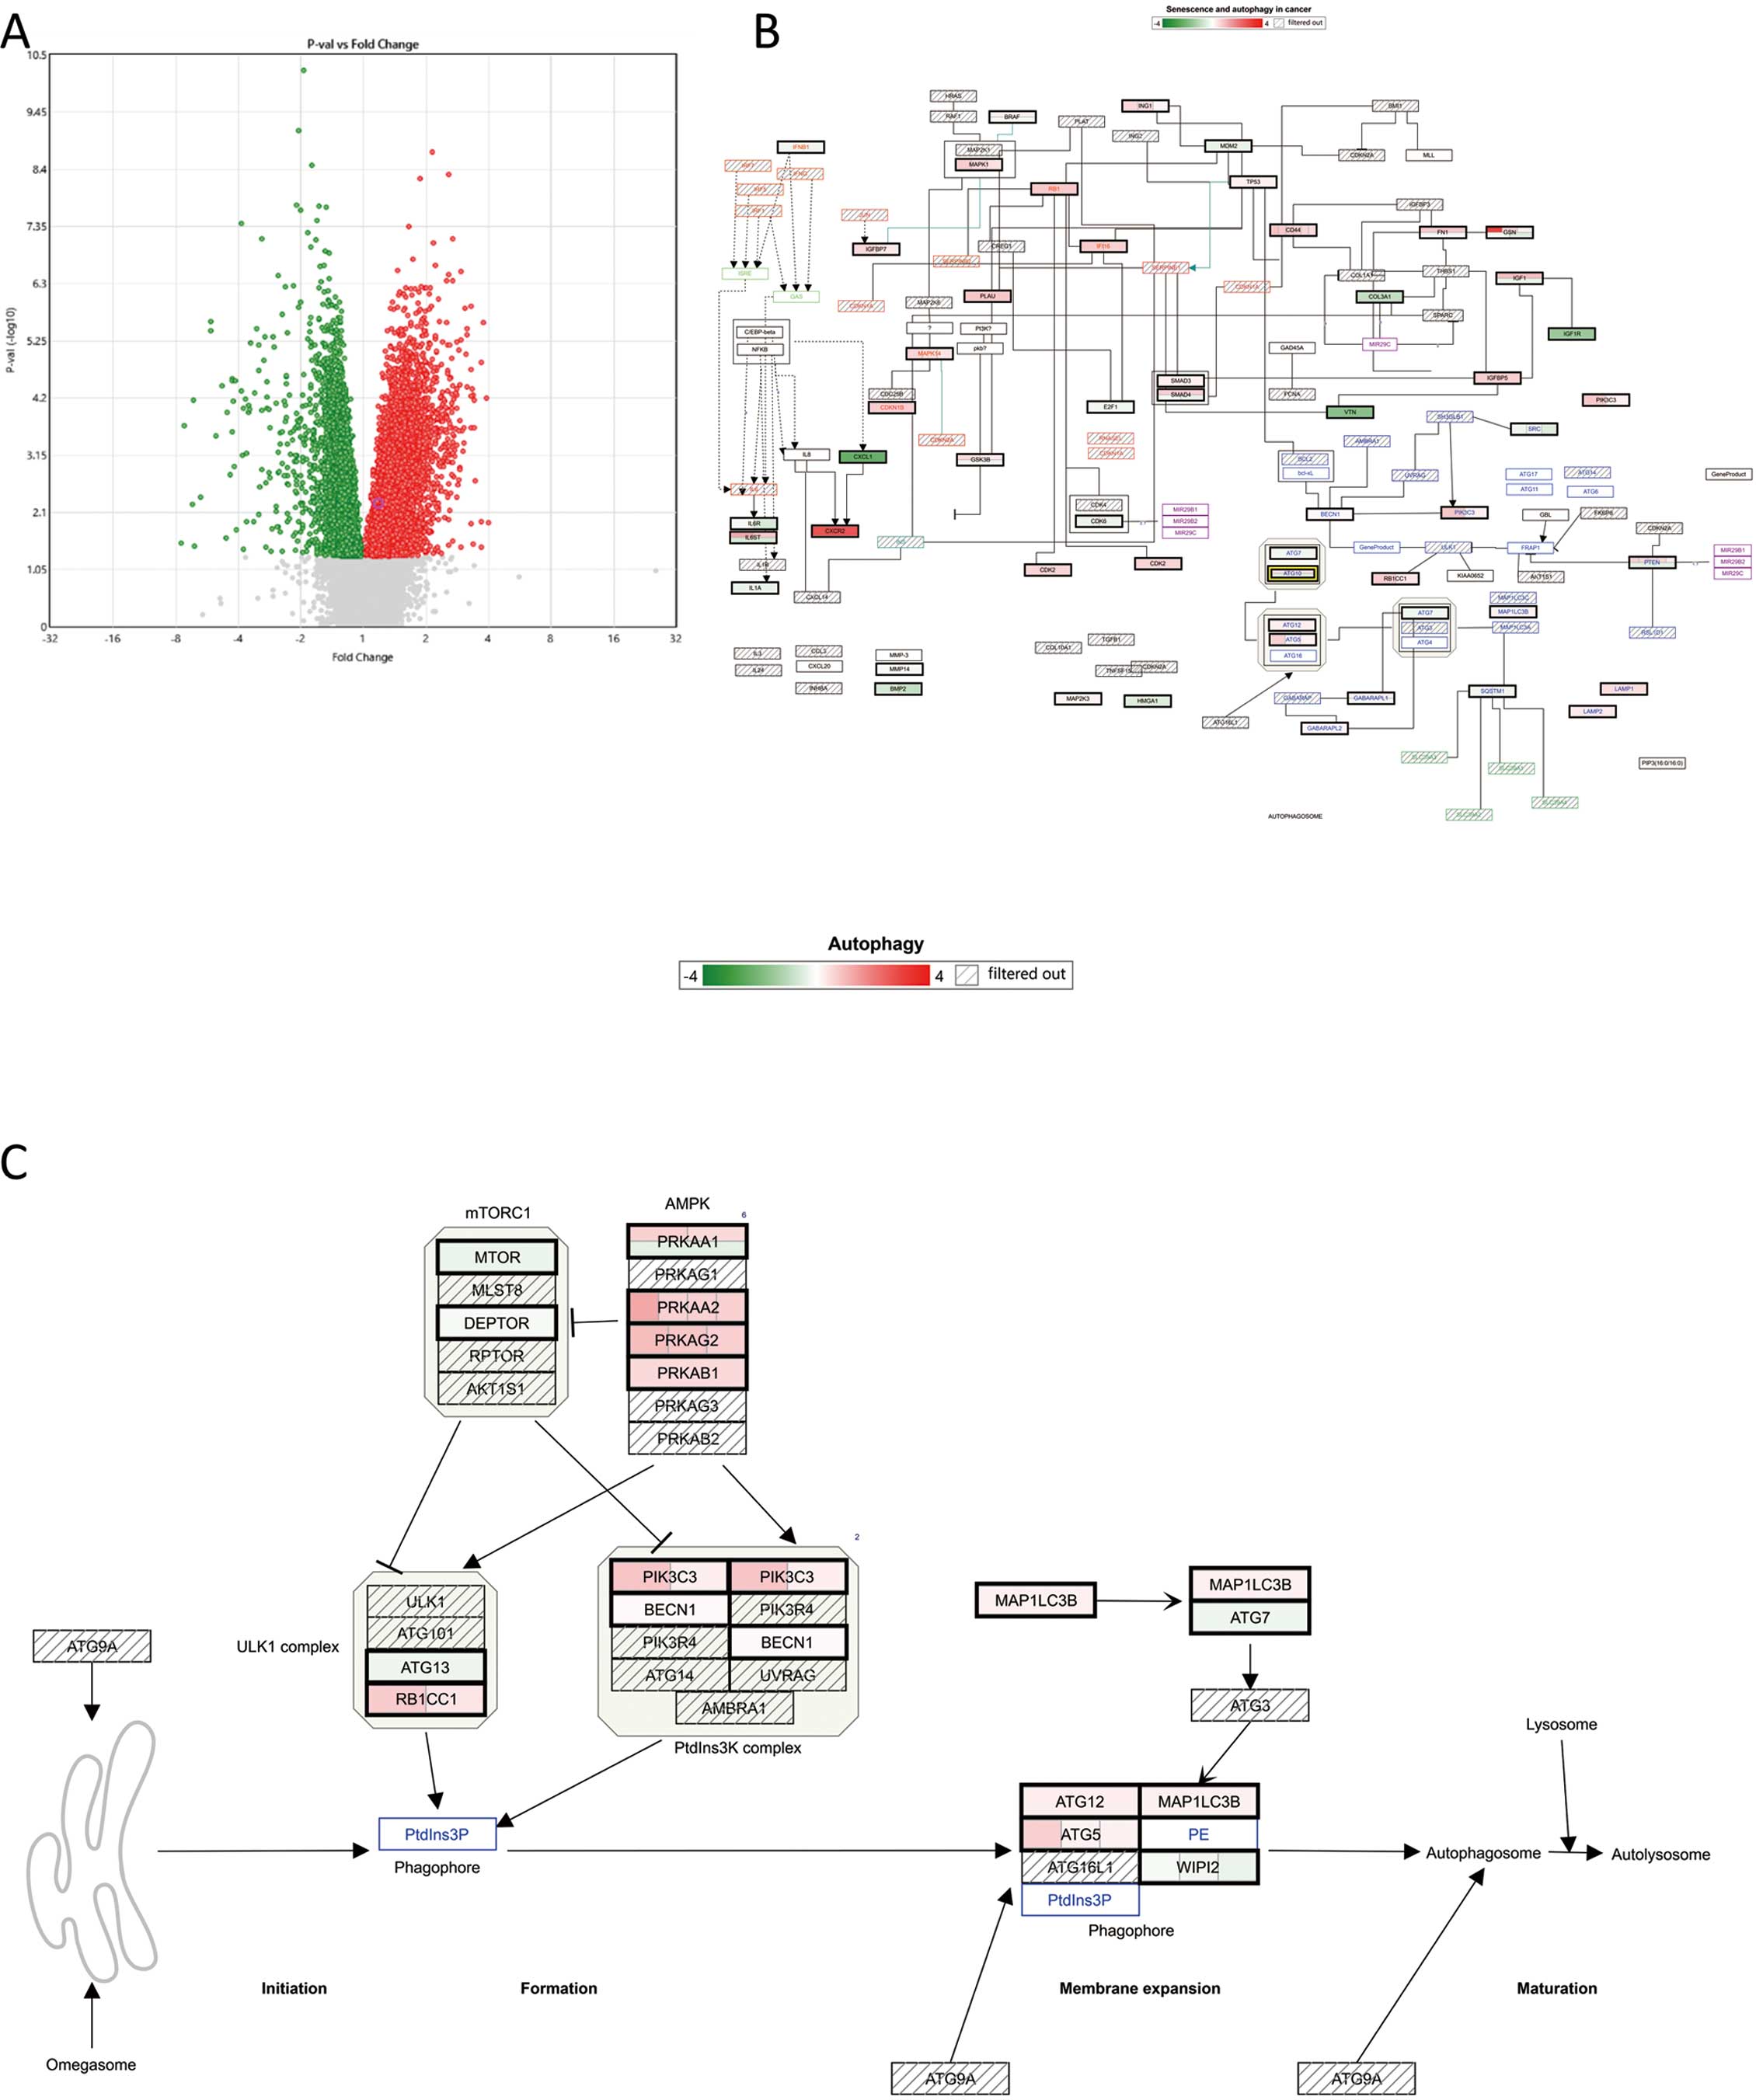
(A) Detection of differentially expressed genes (DEGs) in the left atrium of patients with atrial fibrillation (AF-LA) compared with patients with sinus rhythm (Sinus-LA) using a volcano plot showing fold changes (AF-LA/Sinus-LA gene expression) relative to the P value of the comparison. In this figure, the filter criterion is P<0.05. All false discovery rate-corrected P values <0.2. Red dots indicate upregulated genes; green dots indicate downregulated genes; and gray dots indicate the genes that did not pass the filter criterion. (B) The Transcriptome Analysis Console was used to summarize those upregulated (red) and downregulated (green) genes in WikiPathways. The summary image is based on the original images for “Senescence and autophagy in cancer (Homo sapiens)” (B) and “Autophagy (Homo sapiens)” (C) in WikiPathways. WikiPathways content is covered by the Creative Commons CC0 waiver, which states that we are free to share (copy, distribute and transmit) and remix (adapt) the work.
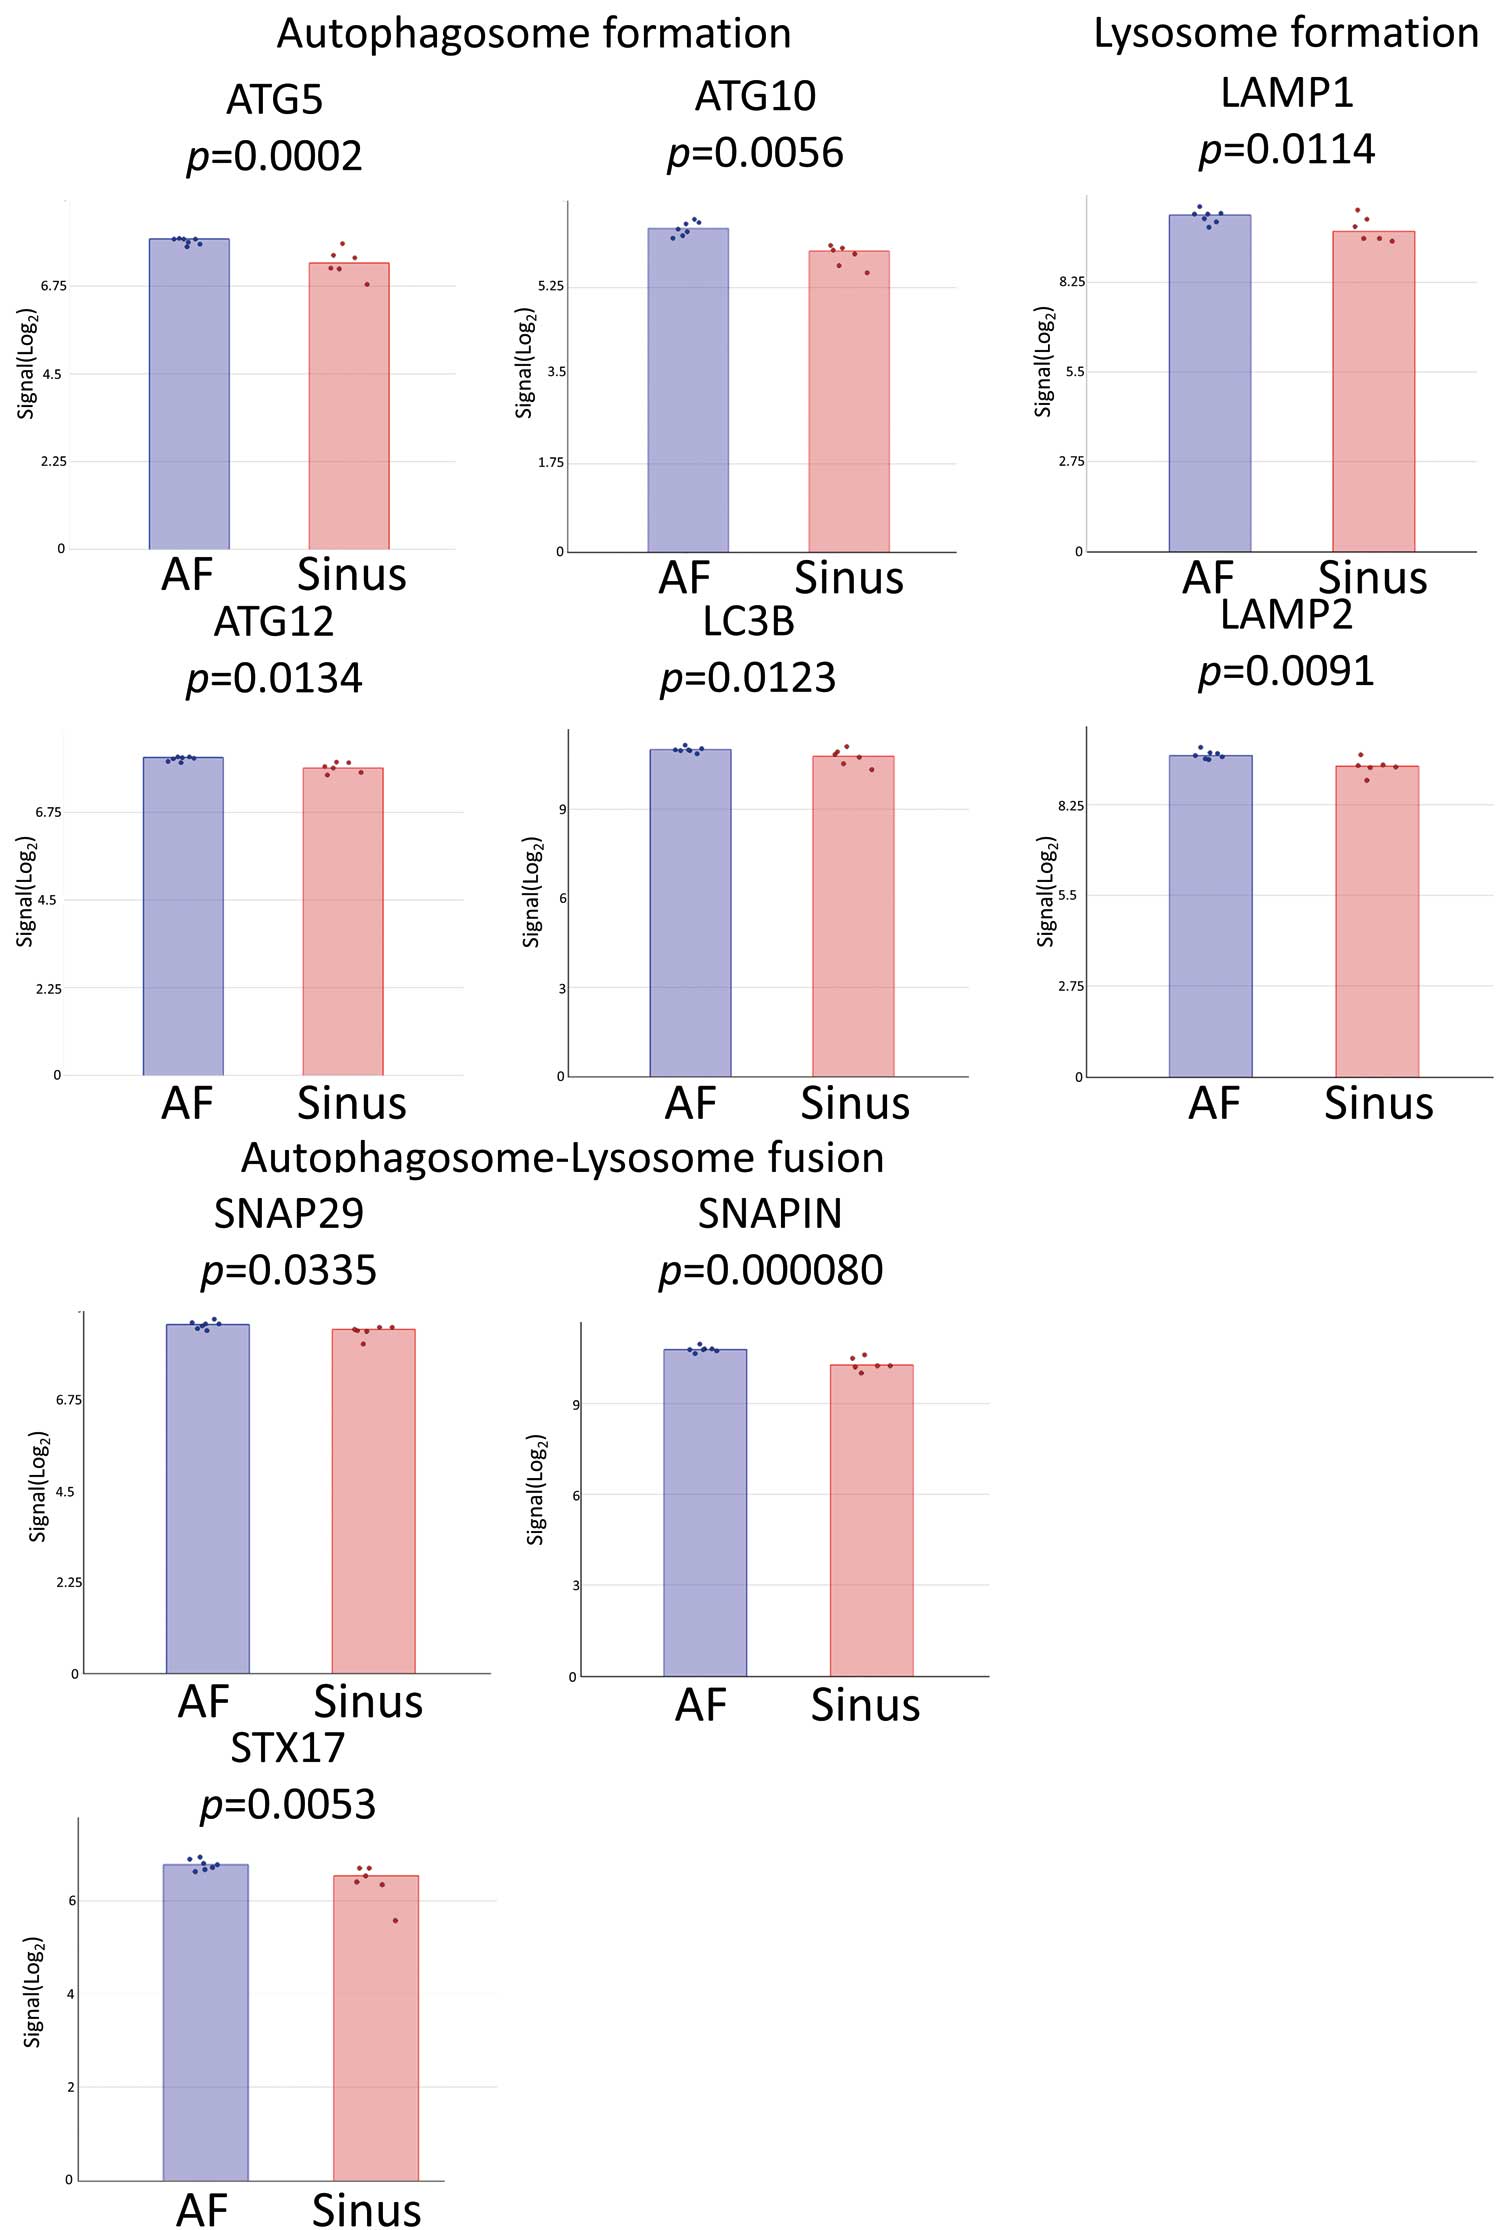
Genes with significantly upregulated expression in the left atrium of patients with atrial fibrillation (AF) compared with sinus rhythm (Sinus). All false discovery rate-corrected P values <0.2. The columns show mean and what are the coloured dots indicate the signals of each sample. ATG5, autophagy related 5; ATG10, autophagy related 10; ATG12, autophagy related 12; LC3B, light chain 3B; LAMP1, lysosomal associated membrane protein 1; LAMP2, lysosomal associated membrane protein 2; SNAP29, synaptosome associated protein 29; SNAPIN, SNAP associated protein; STX17, syntaxin 17.
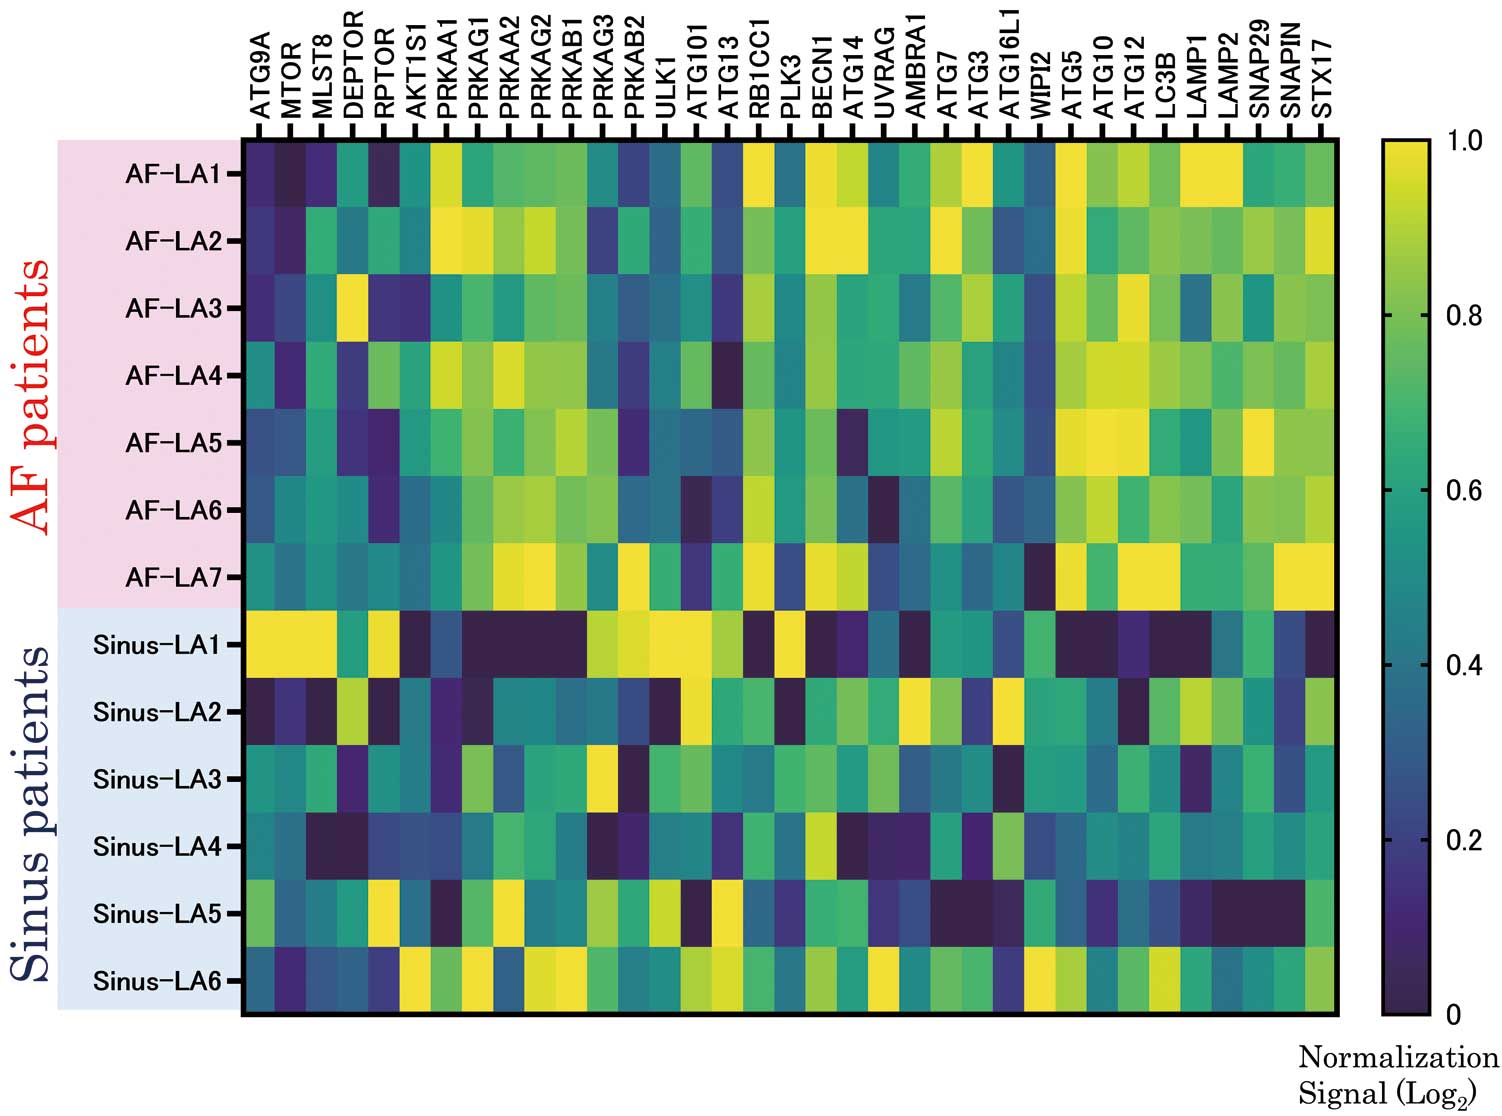
Summary of heat map analyses of gene expression related to the 3 phases of autophagy. Figure 6 was produced by using the same data as Figure 4C (“Autophagy (Homo sapiens)”) and Figure 5, and the heat map was created using GraphPad Prism 9.5.0 (GraphPad Software, San Diego, CA, USA). The color pattern is viridis, and the scale setting was set automatically by Prism. We normalized the heat map. AF-LA, the left atrium of patients with atrial fibrillation (AF); Sinus-LA, the left atrium of patients with normal sinus rhythm.
This bioinformatics study evaluated DNA microarray data and compared DEGs between persistent AF and normal sinus rhythm. We focused on LA-specific changes and found several phagosome-related genes whose expression was specifically upregulated or downregulated in the AF-LA dataset. The marked changes in expression of the DEGs in the AF-LA suggest that the LA may be the main cardiac region affected in persistent AF (Figures 1,2). We then used DAVID to understand the biological relevance of the 317 AF-LA-specific DEGs.
The top result of the KEGG pathway analysis was the term ‘Leishmaniasis’ (Table). Autophagy has been suggested to play a key role in the vital processes linked to survival of the Leishmania organism.23,24 Therefore, genes associated with the term ‘Leishmaniasis’ may include potential markers for autophagy. The second highest (and most frequent) result of the KEGG pathway analysis was the term ‘Phagosome’, a structure important in autophagy. Similarly, the KEGG pathway analysis returned DEGs in the AF-LA that were associated with the term ‘Phagosome’ (Figure 3). We also compared DEGs between “AF-LA vs. AF-RA” and “AF-RA vs. Sinus-RA”, but KEGG pathway analysis did not reveal any autophagy-specific differences (Supplementary Table 5). This outcome suggested that autophagy-associated changes may be specific to the AF-LA vs. Sinus-LA. To further highlight changes in the expression of autophagy-related genes in the AF-LA, we selected DEGs in the AF-LA that yielded P<0.05 compared with the Sinus-LA and assessed them in WikiPathways, an open platform maintained by the research community19–22 (Figure 4). In this analysis, we used the WikiPathways terms “Autophagy (Homo sapiens)” (Figure 4C) and “Senescence and autophagy in cancer (Homo sapiens)” (Figure 4B). Senescence and autophagy have overlapping features, and both influence tumor development.25 The pathway “Senescence and autophagy in cancer (Homo sapiens)” included several autophagic genes that were AF-specific DEGs in the LA, namely ATG5, ATG10, ATG12, LC3B, LAMP1, LAMP2, SNAP29, SNAPIN, and STX17 (Figure 5).
We then categorized these 9 genes according to the 3 phases of autophagy (i.e., autophagosome formation, lysosome formation, and autophagosome-lysosome fusion). Regarding autophagosome formation, ATG5 is necessary for the formation of the autophagosome membrane,26 and the ubiquitin-like molecules ATG12 and LC3B each trigger separate protein conjugation systems that are required for autophagosome elongation and maturation. ATG12 is subsequently conjugated to ATG5 via ATG10.27 With the assistance of ATG5–ATG12 conjugates, LC3B coats the outer surface of the autophagosome.28 LC3B plays a key role in the development of the autophagosome membrane and is a downstream signal for autophagy. In the present study, LC3B expression was high (Figure 6); it makes sense that several small changes in upstream signals, such as those associated with ATG5, ATG10, and ATG10, contribute to an amplified effect on LC3B.
With regard to the lysosome-formation phase of autophagy, LAMP1 and LAMP2 are well-known molecules in the lysosome membrane.29 LAMP overexpression may ameliorate autophagic flux blockade.30 Finally, STX17 and SNAP29 are critical regulators of autophagosome-lysosome fusion.31 Through its interaction with membrane-bound STX17 or syntaxin 7, SNAP29 participates in the formation of the SNARE (SNAP REceptor) complex.32,33 In addition, SNAPIN is necessary in the autophagic-lysosomal function of neural tissues,34 and macrophage-expressed SNAPIN is essential in lysosomal acidification and autophagosome maturation.35,36 Furthermore, our previous data indicate that SNAPIN is critical for cardiac autophagy.6
The autophagic genes downregulated in the AF-LA (Figure 4C) included mechanistic target of rapamycin kinase (MTOR), which is important as the contributor of cell migration and DNA damage,37,38 and the “brake” in autophagy.39–41 This downregulation of MTOR in the AF-LA may suggest that autophagy was induced in AF-LA.
Our results indicate that all 3 phases of autophagy may be upregulated during AF (Figure 7). DNA microarrays are very useful for getting an overview of the DEGs of a particular biological process. The present study is the first to apply the National Center for Biotechnology Information GEO database to simultaneously analyze and compare gene expression levels between AF-LA and Sinus-LA samples, particularly differences in the expression of genes associated with autophagy.

Autophagy related 5 (ATG5), autophagy related 10 (ATG10), autophagy related 12 (ATG12), and LC3B were identified previously as autophagosome formation-related genes. Lysosomal associated membrane protein 1 (LAMP1) and lysosomal associated membrane protein 2 (LAMP2) are molecules in the lysosomal membrane. Synaptosome associated protein 29 (SNAP29), SNAP associated protein (SNAPIN), and syntaxin 17 (STX17) are speculated to be important in autophagosome-lysosome fusion. These results indicate that all 3 phases of autophagy may be upregulated in atrial fibrillation.
This study has 3 major limitations. First, because samples of myocardium cannot be obtained from healthy people for obvious ethical reasons, we evaluated DNA microarray data from tissues obtained during valvular surgery. Patients with AF and those with normal sinus rhythm both have valvular disease, but the influence of valvular disease on AF is a potential confounding effect in the present study. We did not include non-valvular samples from patients with normal sinus rhythm or AF in this bioinformatics study. In addition, we were unable to obtain detailed clinical information, such as which samples were derived from patients who underwent surgery for both mitral valve and coronary artery disease. Because this bioinformatics study was a preliminary analysis, further studies are necessary to support the validity of our findings. Second, GO terms are indicators of the functional annotation assigned through DAVID, but not all genes are associated with GO terms. Finally, the actual magnitude of upregulation of autophagy may differ from the pathway analyses because the mRNA levels indicated in DNA microarrays are not always concordant with protein levels. Our study may reflect these intrinsic limitations of bioinformatics analysis. However, despite these (and other) possible limitations, bioinformatic analyses can provide insights into biological experimental strategies for future studies, without the need for additional invasive procedures.
In conclusion, autophagy can have beneficial or detrimental effects in cells, depending on the context. In persistent AF, excessive autophagy may exacerbate LA remodeling.
The authors extend their appreciation to the staff who supported this study, particularly Shihoko Matsuda (National Center for Geriatrics and Gerontology) for her assistance.
This work was supported by the National Center for Geriatrics and Gerontology as part of the Center’s funding for research and development for longevity medicine (Project 22-9; to A.S.).
None of the authors has any competing interests regarding this study.
T.K. conceived and designed the overall study, collected and reviewed all data, and wrote the initial draft of the manuscript. All authors reviewed all data and contributed to the discussion.
This bioinformatics analysis did not require approval from the Ethics Committee of National Center for Geriatrics and Gerontology.
Please find supplementary file(s);
https://doi.org/10.1253/circrep.CR-22-0130