Abstract
Background: The utility of telomere G-tail length to predict coronary artery disease (CAD) remains controversial. CAD results from coronary artery narrowing due to cholesterol and lipid accumulation, augmented by inflammatory cells and other factors. This study explored the significance of telomere G-tail length in suspected CAD patients.
Methods and Results: In all, 95 patients with suspected CAD or ≥1 cardiac risk factor underwent coronary computed tomography angiography (CCTA). We measured leukocyte telomere length and G-tail length using a hybrid protection method, and diagnosed the presence of CAD using CCTA. Associations between G-tail length and the presence of CAD, the number of stenosed coronary arteries, and brachial-ankle pulse wave velocity (baPWV) were analyzed. No significant difference was observed in G-tail length when comparing groups with or without CAD or statin treatment. However, in the non-statin group, G-tail length was significantly shorter in patients with 3-vessel disease compared with 1-vessel disease. Dividing the group using a baPWV of 1,300 cm/s, telomere G-tail length was significantly shorter in the high-risk (baPWV ≥1,300 cm/s) group.
Conclusions: The clinical utility of telomere G-tail length as a CAD risk indicator seems limited. There was a trend for longer telomere G‐tail length in the statin‐treated group. Moreover, telomere G-tail length was reduced in patients at high-risk of cardiovascular events, aligning with the trend of a shortening in telomere G-tail length with CAD severity.
The potential use of telomere G-tail length as a novel predictor of cardiovascular events has been suggested.1 Telomeres are double-stranded DNA consisting of 6 repeats of TTAGGG, and the constituent telomeric DNA is deleted with each replication.2,3 In the final stage of replication, the single-stranded projecting end of this TTAGGG sequence is called the telomere G-tail. Telomere G-tails are key structures that protect telomere DNA from DNA damage.4,5 It has been reported that in diseases such as myocardial infarction and chronic heart failure, telomere length is markedly shortened,6–8 and this shortening is associated with hypertension (HTN), atherosclerosis, and coronary calcification.1,9,10 Because telomere G-tail length, rather than total telomere length, has been reported to function as a trigger for cell viability and senescence, we decided to use the telomere G-tail length in this study.11,12
Although many studies have examined the relationship between telomere G-tail length and cardiovascular disease, few epidemiological studies have validated telomere G-tail length in subjects at risk of some form of heart disease, as in actual clinical practice. Non-invasive means of assessing the severity of atherosclerosis are available, such as pulse wave velocity (PWV), ankle-brachial pressure index (ABI), and coronary artery calcification (CAC). Brachial-ankle PWV (baPWV) is non-invasive, easy to measure, and frequently used to assess the risk of developing cardiovascular disease. CAC indicates the presence of coronary atherosclerosis, with the amount of CAC considered to represent the severity of coronary atherosclerosis.13 Similarly, the number of diseased coronary vessels has been reported to be associated with poor clinical outcomes.14 Many Japanese patients have already received statin therapy as primary prevention, and show a unique association between lipid profile and the development of coronary artery disease (CAD).15 Statin treatment affects telomere G-tail length. At the molecular level, statins may inhibit telomere length shortening by interacting with the telomere/telomerase system and by reducing telomere damage caused by oxidation.16–18
Therefore, the aim of this study was to clarify the relationship between telomere G-tail length and CAD by using established indices reflecting atherosclerosis in Japanese subjects with suspected CAD in real clinical practice.
Methods
Study Subjects
This study was a single-center, hospital-based, cross-sectional study conducted using the coronary computed tomography angiography (CCTA) database of Fukuoka University from August 2017 to February 2018. Of 100 consecutive patients, 95 patients were enrolled and 5 were excluded due to a lack of data. We included patients who were clinically suspected of having CAD based on abnormal electrocardiogram (ECG) findings and/or chest symptoms, or with ≥1 cardiovascular risk factor, and age ≥20 years. ECG findings suggestive of ischemia included ST changes, T wave changes, and QRS wave changes. Patients with acute coronary syndrome, a history of known CAD, severe renal insufficiency (estimated glomerular filtration rate [eGFR] ≤30 mL/min/1.73 m2), or missing data were excluded.
Evaluation of CAD Using CCTA
All patients underwent scanning with CCTA, and CAD was defined as a narrowing of >50% in the coronary artery lumen.19 All segments were assessed according to the 15-segment American Heart Association coronary artery model.20 Subjects were classified into 4 groups according to the number of stenosed vessels as follows: 0, 1, 2, and 3 stenosed vessels. CCTA was assessed by trained cardiologists using a Ziostation (Ziosoft Inc., Tokyo, Japan), a computed tomography workstation. These cardiologists were blinded to the clinical characteristics and the results of blood tests. Overall, the severity of CAD was assessed according to the number of stenosed vessels and the CAC score.21 The CAC score was assessed using the Agatston score.22 The severity of CAD was also assessed according to the Gensini score.21
Evaluation of CAD Risk Factors
Patient characteristics are presented in Table 1, including cardiovascular risk factors. Patients who had a current systolic blood pressure ≥140 mmHg and/or diastolic blood pressure ≥90 mmHg or were receiving anti-hypertensive therapy were considered to have HTN. Patients with low-density lipoprotein cholesterol (LDL-C) ≥140 mg/dL, triglycerides (TG) ≥150 mg/dL, and/or high-density lipoprotein cholesterol (HDL-C) <40 mg/dL, or who were being treated with lipid-lowering therapy were defined as having dyslipidemia (DL). HbA1c was evaluated according to the National Glycohemoglobin Standardization Program. Patients were considered to have diabetes if they satisfied any of the diagnostic criteria as defined by the Japan Diabetes Society.23 Chronic kidney disease was defined as eGFR <60 mL/min/1.73 m2.2,24,25
Table 1. Patient Characteristics in Each of the Overall and Non-Statin Treatment Groups, (A) Patient Characteristics of All Patients According to the Presence or Absence of CAD and Statin Treatment, (B) Patient Characteristics in the Non-Statin Group, According to the Presence or Absence of CAD
| (A) |
All patients
(n=95) |
Non-CAD
(n=56) |
CAD
(n=39) |
P value
Non-CAD
vs. CAD |
Non-statin
(n=71) |
Statin
(n=24) |
P value
Non-statin
vs. statin |
| Age (years) |
64.8±13.2 |
62.2±13.7 |
68.6±11.8 |
0.019 |
62.9±13.7 |
70.7±10.0 |
0.012 |
| Female sex |
48 (50.5) |
22 (39.3) |
26 (66.7) |
0.0086 |
34 (47.9) |
14 (58.3) |
0.38 |
| HTN |
55 (57.9) |
25 (44.6) |
30 (76.9) |
0.0017 |
37 (52.1) |
18 (75.0) |
0.050 |
| BMI >25 kg/m2 |
37 (38.9) |
25 (44.6) |
12 (30.8) |
0.17 |
29 (40.9) |
8 (33.3) |
0.51 |
| Diabetes |
16 (16.8) |
7 (12.5) |
9 (23.1) |
0.18 |
7 (9.9) |
9 (37.5) |
0.0018 |
| DL |
38 (40.0) |
15 (26.8) |
23 (59.0) |
0.0016 |
17 (23.9) |
21 (87.5) |
<0.0001 |
| Smoking |
34 (35.8) |
15 (26.8) |
19 (48.7) |
0.028 |
22 (31.0) |
12 (50.0) |
0.093 |
| LVEF (%) |
64.2±9.2 |
65.7±8.6 |
62±9.7 |
0.052 |
63.8±9.1 |
65.3±9.5 |
0.51 |
| Glucose (mg/dL) |
109.9±28.3 |
108.7±30.4 |
111.8±25.2 |
0.61 |
107.8±28.4 |
116.3±27.5 |
0.21 |
| HbA1c (%) |
5.9±0.9 |
5.8±0.9 |
6.2±0.9 |
0.058 |
5.8±0.9 |
6.3±1.0 |
0.020 |
| eGFR (mL/min/1.73 m2) |
71.0±14.2 |
73.0±14.3 |
68.3±13.6 |
0.11 |
72.9±14.3 |
65.6±12.3 |
0.029 |
| HDL-C (mg/dL) |
56.1±15.3 |
59.3±16.3 |
51.3±12.7 |
0.012 |
55.8±15.9 |
56.8±14.0 |
0.79 |
| LDL-C (mg/dL) |
121.8±33.7 |
126.7±29.5 |
114.9±38.3 |
0.095 |
131.3±32.0 |
93.8±20.7 |
<0.0001 |
| Total cholesterol (mg/dL) |
206.7±38.8 |
215.2±35.4 |
194.4±40.6 |
0.0094 |
216.3±38.0 |
178.1±24.5 |
<0.0001 |
| Triglycerides (mg/dL) |
129.9±71.5 |
132.1±86.0 |
126.7±44.0 |
0.72 |
139.1±76.5 |
102.8±45.3 |
0.031 |
| Medication |
| ARB |
24 (25.3) |
11 (19.6) |
13 (33.3) |
0.13 |
14 (19.7) |
10 (41.7) |
0.032 |
| ACE-I |
3 (3.2) |
0 |
3 (7.7) |
0.035 |
2 (2.8) |
1 (4.2) |
0.74 |
| CCB |
38 (40.0) |
19 (33.9) |
19 (48.7) |
0.15 |
24 (33.8) |
14 (58.3) |
0.034 |
| BB |
6 (6.3) |
0 |
6 (15.4) |
0.0024 |
2 (2.8) |
4 (16.7) |
0.016 |
| Statin |
24 (25.3) |
7 (12.5) |
17 (43.6) |
0.0006 |
|
|
|
| Oral antidiabetic |
21 (22.1) |
9 (16.07) |
12 (30.8) |
0.090 |
12 (16.9) |
9 (37.5) |
0.036 |
| Leukocytes (×103/μL) |
5.91±1.91 |
5.94±2.18 |
5.86±1.45 |
0.84 |
5.97±2.09 |
5.71±1.22 |
0.58 |
| Log telomere G-tail length |
9.36±0.24 |
9.34±0.24 |
9.39±0.24 |
0.36 |
9.34±0.24 |
9.43±0.23 |
0.093 |
| CAD |
|
|
|
|
22 (31.0) |
17 (70.8) |
0.0004 |
| No. diseased vessels |
| 0 |
|
56 |
0 |
|
49 |
7 |
|
| 1 |
|
0 |
14 |
|
8 |
6 |
|
| 2 |
|
0 |
11 |
|
7 |
4 |
|
| 3 |
|
0 |
14 |
|
7 |
7 |
|
| CAC score |
0
[0–99.32] |
0 |
99.3
[14.6–335.1] |
0.0002 |
0
[0–33.6] |
62.7
[0.3–280.3] |
0.0064 |
| Gensini score |
5
[0–14.25] |
0
[0–2.5] |
16
[10.5–29] |
<0.0001 |
2.5
[0–10.5] |
13
[3.4–25] |
0.22 |
| (B) |
Non-statin group (n=71) |
|
|
|
All patients
(n=71) |
Non-CAD
(n=49) |
CAD
(n=22) |
P value
Non-CAD
vs. CAD |
|
|
|
| Age (years) |
62.9±13.7 |
61.1±14.1 |
66.8±12.1 |
0.11 |
|
|
|
| Female sex |
34 (47.9) |
19 (38.8) |
15 (68.2) |
0.022 |
|
|
|
| HTN |
37 (52.1) |
21 (42.9) |
16 (72.7) |
0.020 |
|
|
|
| BMI >25 kg/m2 |
29 (40.8) |
23 (46.9) |
6 (27.3) |
0.12 |
|
|
|
| Diabetes |
7 (9.9) |
5 (10.2) |
2 (9.1) |
0.88 |
|
|
|
| DL |
17 (23.9) |
9 (18.4) |
8 (36.4) |
0.10 |
|
|
|
| Smoking |
22 (31.0) |
14 (28.6) |
8 (36.4) |
0.51 |
|
|
|
| Oral antidiabetic |
12 (16.9) |
8 (16.3) |
4 (18.2) |
0.85 |
|
|
|
| LVEF (%) |
63.8±9.1 |
65.1±8.5 |
61.2±10.0 |
0.094 |
|
|
|
| Glucose (mg/dL) |
107.8±28.4 |
108.6±32.0 |
106.2±19.0 |
0.74 |
|
|
|
| HbA1c (%) |
5.8±0.9 |
5.8±0.9 |
5.9±0.7 |
0.65 |
|
|
|
| eGFR (ml/min) |
72.9±14.4 |
73.7±14.5 |
71±14.1 |
0.47 |
|
|
|
| HDL-C (mg/dL) |
55.8±15.9 |
58.5±2.2 |
49.8±3.3 |
0.031 |
|
|
|
| LDL-C (mg/dL) |
131.3±32.0 |
131.2±4.6 |
131.5±6.9 |
0.97 |
|
|
|
| Total cholesterol (mg/dL) |
216.3±38.0 |
219.3±35.7 |
209.7±42.9 |
0.33 |
|
|
|
| Triglycerides (mg/dL) |
139.1±76.5 |
135.7±88.5 |
146.6±39.3 |
0.31 |
|
|
|
| Medication |
| ARB |
14 (19.7) |
8 (16.3) |
6 (27.3) |
0.28 |
|
|
|
| ACE-I |
2 (2.8) |
0 |
2 (9.1) |
0.032 |
|
|
|
| CCB |
24 (33.8) |
16 (32.7) |
8 (36.4) |
0.76 |
|
|
|
| BB |
2 (2.8) |
0 |
2 (9.1) |
0.032 |
|
|
|
| Leukocytes (×103/μL) |
5.97±2.09 |
6.06±2.29 |
5.75±1.58 |
0.56 |
|
|
|
| Log telomere G-tail length |
9.34±0.24 |
9.35±0.24 |
9.31±0.24 |
0.59 |
|
|
|
| No. diseased vessels |
| 0 |
49 |
49 |
0 |
|
|
|
|
| 1 |
8 |
0 |
8 |
|
|
|
|
| 2 |
7 |
0 |
7 |
|
|
|
|
| 3 |
7 |
0 |
7 |
|
|
|
|
| CAC score |
0
[0–33.6] |
0
[0–2.3] |
89.4
[9–354.4] |
0.0001 |
|
|
|
| Gensini score |
2.5
[0–10.5] |
0
[0–2.5] |
14.3
[10–24.5] |
<0.0001 |
|
|
|
ACE-I, angiotensin-converting enzyme inhibitor; ARB, angiotensin II receptor blocker; BB, β-blocker; BMI, body mass index; CAD, coronary artery disease; CCB, calcium channel blocker; DL, dyslipidemia; eGFR, estimated glomerular filtration rate; HDL-C, high-density lipoprotein cholesterol; HTN, hypertension; LDL-C, low-density lipoprotein cholesterol; LVEF, left ventricular ejection fraction. (A) Normally distributed continuous variables are presented as the mean±SD; non-normally distributed continuous are presented as the median [interquartile range]. Categorical variables are presented as n (%). P values for differences were estimated from Chi-squared tests for categorical variables and from unpaired t-tests for continuous variables. (B) Normally distributed continuous variables are presented as the mean±SD; non-normally distributed continuous are presented as the median [interquartile range]. Categorical variables are presented as n (%). P values for differences were estimated from Chi-squared tests for categorical variables and from unpaired t-tests for continuous variables.
PWV is an index of arterial stiffness and is independently associated with cardiovascular events. PWV is calculated from the difference in rise time of the pulse wave detected at 2 points and the distance between the measurement sites. In the present study, PWV was measured using a volume plethysmography device in accordance with previously described methods.26
Patients were classified into 2 groups according to PWV (i.e., PWV ≥1,300 and <1,300 cm/s) because baPWV ≥1,300 cm/s represents arterial stiffness, which is associated with a risk of cardiovascular disease. Previous Japanese studies reported that coronary-related events were not observed in patients with baPWV <1,300 cm/s.27 Arterial stiffness is also highly associated with the development of albuminuria, with one study showing the threshold of baPWV in relation to the prevalence of albuminuria with respect to arterial stiffness. In that study, the cut-off value for PWV was 1,269 cm/s, and morbid albuminuria increased with every 100 cm/s increase in baPWV.28
Measurement of Leukocyte Total Telomere Length and Telomere G-Tail Length
Total telomere length was measured using the telomere hybridization protection assay (HPA), and telomere G-tail length was measured using a telomere G-tail HPA.5,29,30 As you pointed out, there was repetition, so I have consolidated it with the previous section. Telomere G-tail length was determined using 0.2 μg denatured genomic (g) DNA or 1 μg non-denatured gDNA. All samples were assessed in triplicate, with gDNA of RKO cells used as a control to correct for interassay variability. The average coefficient of variance for the G-tail was 4.0%.31 The length of the G-tail was represented in logarithmic notation.
Statistical Analysis
No statistical sample size calculations were performed. The post hoc results showed that the required sample size for the difference between the statin and non-statin groups was 199, with an α error at the 5% level of significance and a β error at the 20% level of significance. However, due to the high cost of measuring G-tail length, the study was limited to 100 samples.
All calculations were performed using JMP®
14 (SAS Institute Inc., Cary, NC, USA). Continuous data are reported as the mean±SD or as the median with interquartile range (IQR). Categorical and continuous variables were compared between the groups using Chi-squared tests or unpaired t-tests, respectively. Taking into account the issue of multiplicity, we conducted an adjustment for the false discovery rate (FDR) using the Benjamini-Hochberg method. We set the threshold for statistical significance at FDR <0.05. Continuous variables that were not normally distributed and are reported as the median and IQR were compared using the Wilcoxon rank-sum test. The Spearman rank correlation coefficient was used to evaluate associations between the groups. Log-normalization was used for telomere G-tail length, which was not normally distributed. The significance of differences in telomere G-tail length between groups with 1-, 2-, and 3-vessel disease (VD) were determined by 1-way analysis of variance (ANOVA) with Hsu’s multiple comparison with the best (MCB). A multivariate analysis was performed using an ordinal logistic regression analysis for independent variables that were related to the number of stenosed vessels without statin treatment. For the selection of explanatory variables related to arterial stiffness in multiple regression analysis, we used the backward selection method with P>0.3 for the likelihood ratio test as the exclusion criterion. Statistical significance was set at P<0.05.
Results
Patient Characteristics Overall and in Each of the Non-Statin Treatment Groups
Table 1A shows the clinical characteristics for all patients (n=95), as well as for those with and without statin treatment and according to the absence (n=56) or presence (n=39) of CAD separately. Of all patients, 25.3% were treated with statins. The CAD group was significantly older, had a higher proportion of women and smokers, and had a significantly higher prevalence of HTN and DL. The use of a statin and CAC scores were significantly higher in the CAD group. Telomere G-tail length was not associated with the presence of CAD (P=0.36; Figure 1A). Table 1A also presents the clinical characteristics of all patients according to statin treatment. Patients who had DL treatment other than a statin were included in the non-statin group. The statin group had significantly lower TC, LDL-C, and TG concentrations. In addition, the presence of diabetes, DL, and HTN, and the percentage of CAD morbidity were higher in the statin than non-statin group. However, there was no significant difference in telomere G-tail length between these 2 groups (P=0.093; Figure 1A). The statin group was significantly older than the non-statin group, so when we compared the G-tail length adjusting for age, the P value was 0.049, indicating a significant difference. Nevertheless, when multiplicity was considered, the FDR was 0.140, which was not statistically significant (Figure 1A). In addition, when comparing within the CAD group based on the presence or absence of statin treatment, there was a significant elongation of telomere G-tail length in the statin-treated group of patients (P=0.024). However, considering multiplicity, the FDR was 0.072, which was not statistically significant (Figure 1B).

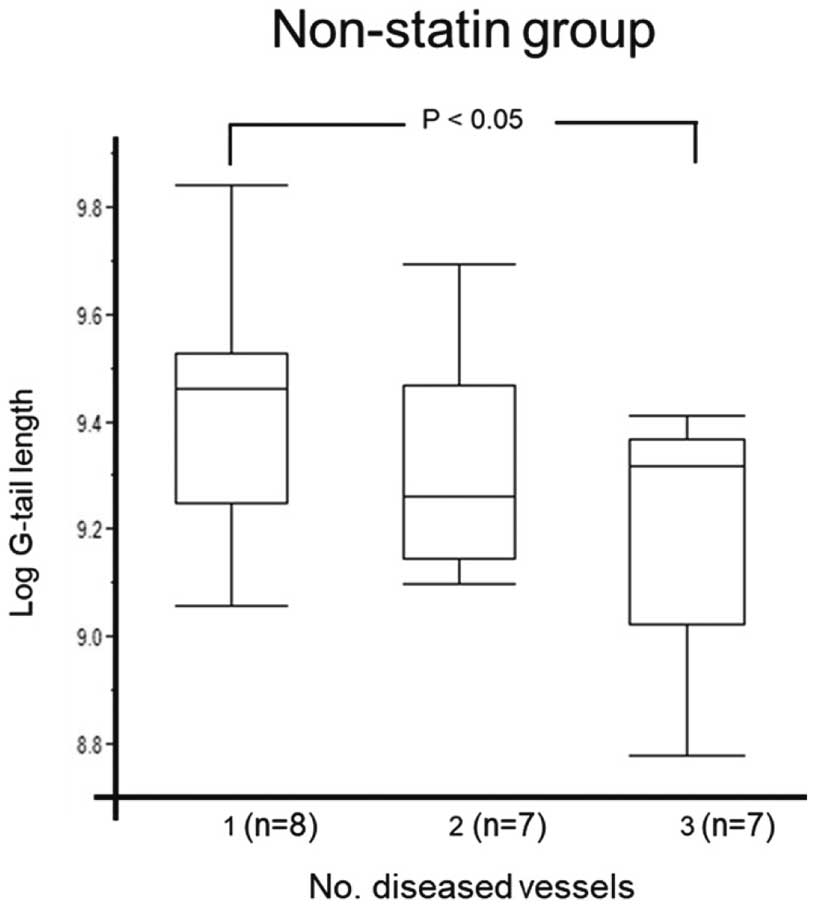
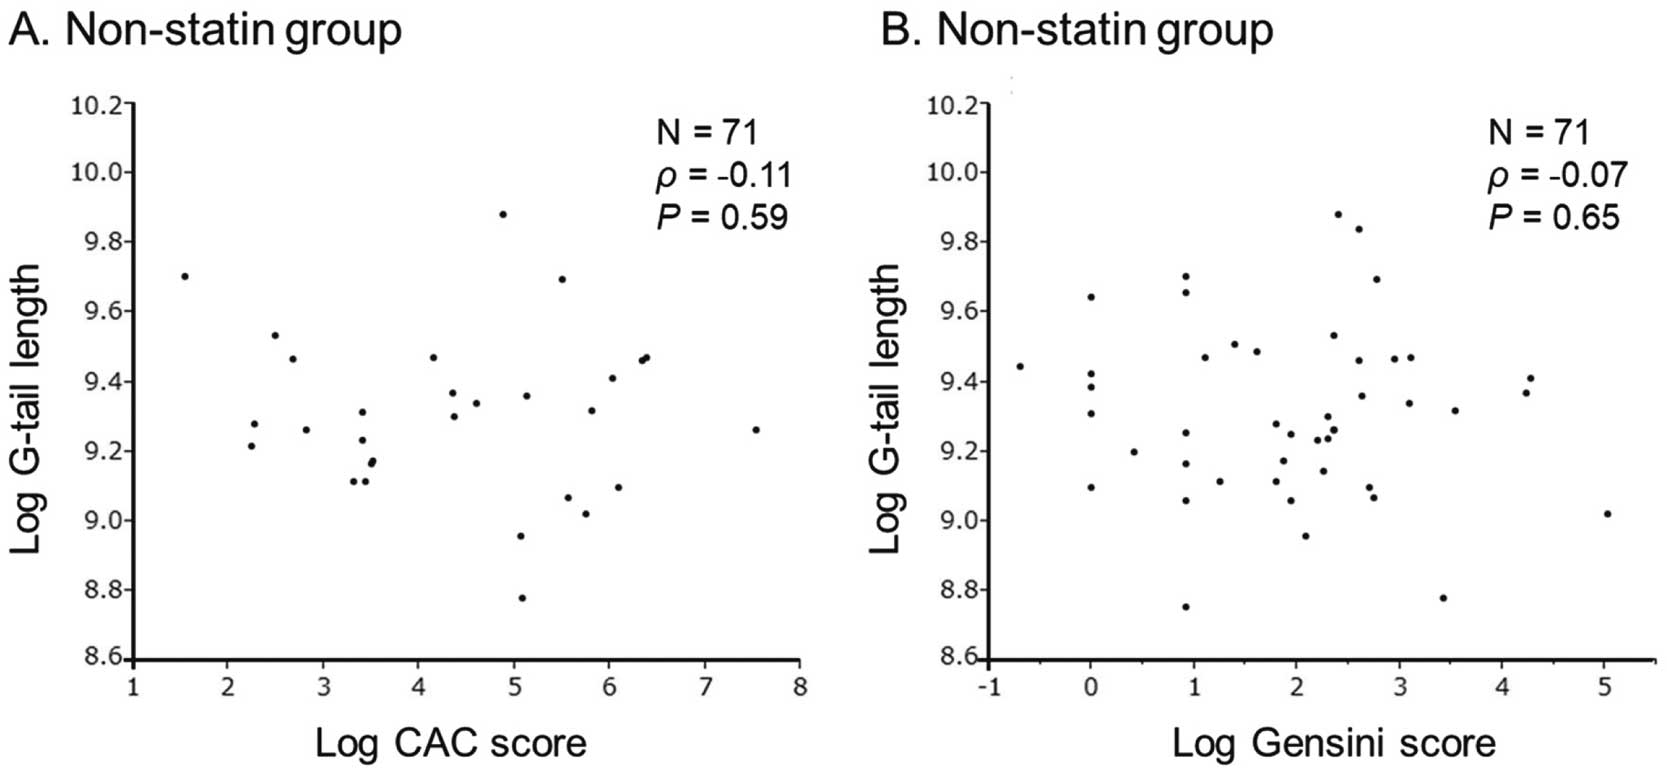
Next, patients on non-statin treatment were further divided into non-CAD (n=49) and CAD (n=22) groups (Table 1B). In the non-statin group, the percentage of patients with HTN was higher and HDL-C concentrations were lower in the CAD than non-CAD group. Figure 2 shows telomere G-tail length in patients without statin treatment according to the number of stenosed vessels. Telomere G-tail length was significantly shorter for patients with 3VD than for those with 1VD and 2VD (9.46 [9.25–9.53] vs. 9.26 [9.14–9.47] and 9.32 [9.02–9.37], respectively; P<0.05). In contrast, the CAC score was not associated with telomere G-tail length (r=−0.056, P=0.64; Figure 3).
Associations Between Telomere G-Tail Length and CAD Risk Factors in Patients Without Statin Treatment
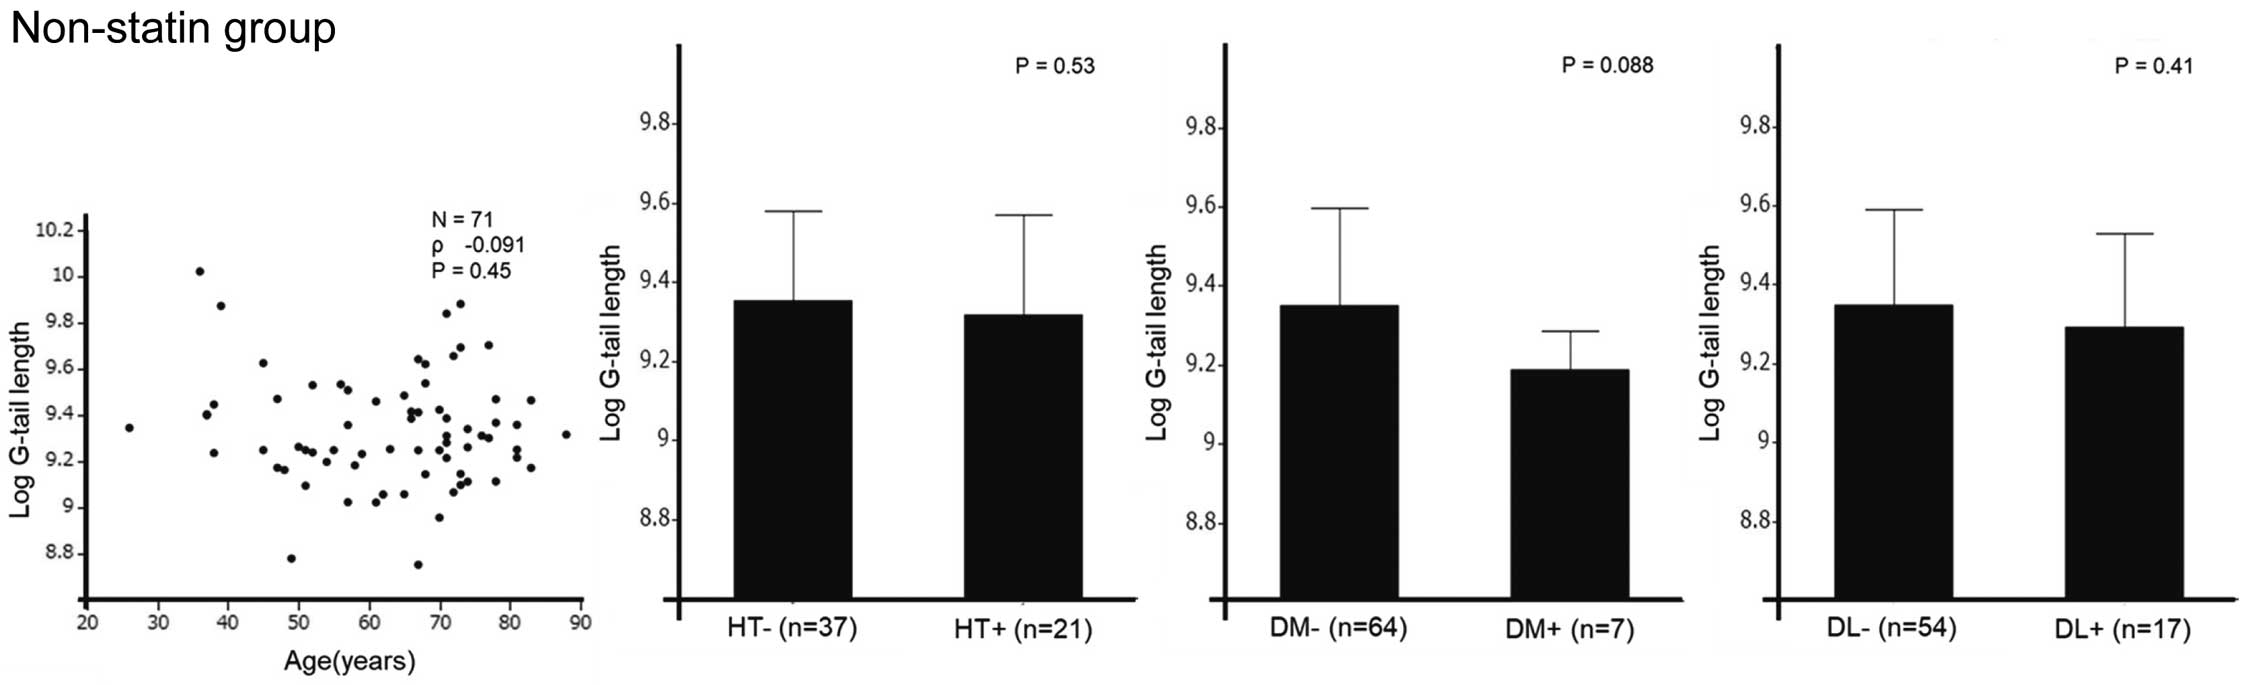
There were no significant associations between telomere G-tail length and traditional CAD risk factors (age, HTN, diabetes, and DL; Figure 4).
Multivariate Ordinal Logistic Regression Analysis Regarding the Number of Diseased Vessels in Patients Without Statin Treatment
An ordinal logistic regression analysis that corrected for independent variables was performed in the non-statin group (Table 2). Telomere G-tail length, in addition to smoking, was independently associated with the number of diseased vessels in patients without statin treatment.
Table 2. Multivariate Ordinal Logistic Regression Analysis Regarding the Increase in the Number of Disease Vessels in the Patients on Non-Statin Group
| Variables |
Multivariate |
| AOR |
95% CI |
P value |
| Age |
1.04 |
0.96–1.15 |
0.33 |
| Smoking |
2.76 |
1.05–8.39 |
0.051 |
| Hypertension |
2.58 |
0.80–10.5 |
0.13 |
| Log(telomere G-tail length) |
0.0026 |
0.000011–0.22 |
0.016 |
Multiple Ordinal Regression was used to identify the factors associated with the increase in the number of diseased vessels, and the results are reported as AORs with 95% CIs. AOR, adjusted odds ratio; CI, confidence interval.
The baseline characteristics of patients with baPWV ≥1,300 and <1,300 cm/s are presented in Table 3, whereas comparisons of unadjusted telomere G-tail length according to baPWV overall and for the non-statin groups are shown in Figure 5. Significant differences in telomere G-tail length were observed in both the entire patient group and in the non-statin group (P=0.032 [FDR=0.032] and P=0.030 [FDR=0.032], respectively). We selected TG, eGFR, and smoking history as explanatory variables in multiple regression analysis. After adjustment for TG, eGFR, and smoking history, telomere G-tail length was significantly shorter in the baPWV ≥1,300 than <1,300 cm/s group (9.49±0.06 vs. 9.34±0.03, respectively; P=0.015). Regarding the units, additional information has been added in the method section. The data was log-transformed and thus has no units.
Table 3. Characteristics of Patients With baPWV ≥1,300 and <1,300 cm/s
| |
baPWV <1,300
(n=19) |
baPWV ≥1,300
(n=75) |
P value |
| Age (years) |
52.8±14.9 |
68.0±11.0 |
<0.0001 |
| Female sex |
11 (57.9) |
37 (49.3) |
0.50 |
| HTN |
8 (42.1) |
47 (62.7) |
0.10 |
| BMI >25 kg/m2 |
10 (52.4) |
27 (36.0) |
0.19 |
| Diabetes |
4 (21.1) |
12 (16.0) |
0.60 |
| Hypercholesterolemia |
6 (31.6) |
32 (42.7) |
0.38 |
| Smoking |
6 (31.6) |
28 (37.3) |
0.64 |
| LVEF (%) |
63.1±8.1 |
64.5±9.5 |
0.57 |
| Glucose (mg/dL) |
107.1±31.6 |
110.0±27.7 |
0.60 |
| HbA1c (%) |
5.8±1.0 |
6.0±0.9 |
0.63 |
| eGFR (mL/min/1.73 m2) |
74.8±12.1 |
70.0±14.6 |
0.20 |
| HDL-C (mg/dL) |
54.1±17.4 |
56.4±14.9 |
0.56 |
| LDL-C (mg/dL) |
117.0±29.6 |
123.0±34.9 |
0.49 |
| Total cholesterol (mg/dL) |
203.3±27.9 |
207.4±41.4 |
0.68 |
| Triglycerides (mg/dL) |
142.2±92.3 |
127.3±66.0 |
0.42 |
| Medication |
| ARB |
4 (21.1) |
20 (26.7) |
0.62 |
| ACE-I |
0 |
3 (4.0) |
0.38 |
| CCB |
5 (26.3) |
33 (44.0) |
0.16 |
| BB |
2 (10.5) |
4 (5.3) |
0.41 |
| Statin |
4 (21.1) |
20 (26.7) |
0.62 |
| Leukocytes (×103/μL) |
5.88±1.61 |
5.94±1.99 |
0.91 |
| Telomere G-tail length |
9.46±0.23 |
9.33±0.24 |
0.032 |
| No. diseased vessels |
| 0 |
12 |
43 |
|
| 1 |
4 |
10 |
|
| 2 |
3 |
8 |
|
| 3 |
0 |
14 |
|
| CAC score |
0 [0–27.4] |
9.7 [0–159.1] |
0.63 |
Normally distributed continuous variables are presented as the mean±SD; non-normally distributed continuous are presented as the median [interquartile range]. Categorical variables are presented as n (%). P values for differences were estimated from Chi-squared tests for categorical variables and from unpaired t-tests for continuous variables. baPWV, brachial-ankle pulse wave velocity. Other abbreviations as in Table 1.

Discussion
This study focused on the correlation between telomere G-tail length and CAD in a Japanese population with suspected CAD. It also explored the relationship between statin therapy and the severity of CAD. The results showed that telomere G-tail length was not associated with the presence of CAD. Conversely, a trend towards elongation of telomere G-tail length was observed in the statin-treated group. In the non-statin group, telomere G-tail length was significantly shorter in patients with 3VD than in those with 1VD. An independent association was found between telomere G-tail length and number of diseased vessels. Furthermore, patients with a baPWV ≥1,300 cm/s had significantly shorter telomere G-tail length.
Our results could potentially be significant because previous studies have associated shorter telomere G-tail length with an elevated risk of cardiovascular disease in hemodialysis patients, suggesting a correlation with aging and vascular risk factors.4,32 Statin treatment is a well-established, safe, and effective therapy for CAD that also has an anti-atherosclerotic effect. Numerous studies have shown a correlation between statin treatment and telomere length, indicating that telomere length is often longer in patients receiving statin treatment, regardless of age, than those not receiving such treatment.16,33,34 Similarly, the results of the present study indicated that patients being treated with statin have a trend towards longer telomere G-tail length, particularly in patients with CAD (Figure 1). Given the findings of the previous studies and the present study, it could be suggested that, at least in patients with shortened telomere G-tail length such as untreated CAD patients, statin treatment may improve the length of the telomere G-tail. However, a lack of clear statistical significance suggested that the usefulness of telomere G-tail length for assessing CAD may be limited in patients at risk of CAD, as in the present study. In contrast, there was no difference in telomere G-tail length in the entire patient cohort, regardless of the presence of CAD; although there were significantly more elderly patients in the CAD group, that group also contained more statin-treated patients, which may have influenced our findings.35 The individuals in this study were at risk of CAD and some were already receiving statin therapy. Against such a background, telomere G-tail length may not be of much value in assessing CAD.
Because CAC reflects atherosclerosis and is a global measure of atherosclerosis, it can be used to assess the risk of CAD. In the present study, telomere G-tail length was not clearly related to the CAC score, regardless of statin treatment. Mainous et al reported that there was no relationship between telomere length and CAC in Blacks, who have less coronary calcification than Whites.10 This is noteworthy because the incidence of a high CAC score is generally seen as lower in Japanese compared with Whites.36,37 It is possible that the number of patients in the present study with a high CAC score (>400) was too small and insufficient for validation. In addition, the results of this study indicated that low calcified lesions with a low CAC score in Japanese patients may not be suitable as surrogate markers of coronary calcification.
The association between telomere G-tail length and disease severity was also analyzed in CAD patients. Because the natural history of CAD is influenced by the number of artery branches affected, we stratified disease severity according to the number of affected branches and evaluated it in relation to telomere G-tail length. In the non-statin group, there was a trend towards shorter telomere G-tail length as the number of diseased vessels increased, with a significant difference between the 1VD and 3VD groups. As indicated in Table 2, telomere G-tail length was demonstrated to be a significant factor related to the number of affected branches, independent of the age factor reported in previous studies, suggesting a correlation with severity.4,32 It has been previously reported that vessels with plaque have markedly shorter telomeres and that telomere shortening was closely associated with an increase in the severity of atherosclerosis.38 On this point, our results are not inconsistent with those previous reports.
In the present study, we further evaluated the efficacy of telomere G-tail length by comparing patients with baPWV ≥1,300 and <1,300 cm/s. Statin treatment has been reported to decrease baPWV.39,40 In the present study, significant differences in telomere G-tail length were observed after adjusting for confounding factors that can affect baPWV, such as smoking history, eGFR, and TG. It has been reported that baPWV is considered to reflect the sum of cardiovascular risks, and 1,400 cm/s is equivalent to a moderate risk using the Framingham risk score.41 Some cross-sectional and cohort studies have reported that baPWV is positively associated with cardiovascular disease.42–45 Recently, telomere G-tail length was shown to be an independent predictor of increased baPWV in a general Japanese population.46 The authors of that study argued that a decrease in telomere length influenced the risk of cardiovascular disease at a very early stage when individuals could still take necessary precautions before cardiovascular disease leads to a symptomatic health outcomes. In the present study, we used a baPWV cutoff of 1,300 cm/s, in accordance with previous studies showing that baPWV <1,300 cm/s did not indicate coronary artery-related events; that the lower limit of normal baPWV for women was 1,300 cm/s; and setting a baPWV of 1,400 cm/s as the cut-off value for cardiovascular events.27,47,48 Our previous report that telomere G-tail length was a predictor of cardiovascular events and the results of the present study showing that the group with lower baPWV had significantly longer telomere G-tail length suggest a similar implication regarding cardiovascular events.32
Previous reports have indicated that oxidative stress and chronic inflammation play major roles in telomere shortening.49,50 Cholesterol accumulation in blood vessels has been found to bring about the chronic inflammatory process of atherosclerosis by promoting the uptake of oxidized LDL.51 Conversely, the rate of telomere shortening is highly dependent on oxidative damage to the cell. It is suggested that the shortening of telomeres in endothelial progenitor cells, mediated by increased oxidative DNA damage, may contribute to the pathophysiology of CAD.52 Thus, it is reasonable to assume that a greater number of diseased vessels or a greater severity of the lesions would imply greater chronic inflammation, which would result in shorter telomere length.
This study has several limitations. First, the sample size was relatively small, which limited our ability to determine significance. Both the 2VD and 3VD groups were small. Compared with previous studies, fewer subjects had high-severity stenosis or a high CAC score. A large number of subjects with complex lesions, higher CAC scores, and multivessel disease may be needed to reveal a relationship between telomere G-tail length and the severity of CAD. Second, the patients in this study were at some risk of CAD, and many were being treated with statins. Comparisons with healthy individuals without CAD should also be made. Third, telomere G-tail length has been reported to shorten primarily with aging and in cancer diseases, but, in relation to the present study, there may be other factors associated with conditions such as cardiomyopathies.31 It is difficult to assess the direct effect of time-dependent changes related to CAD risk in a cross-sectional study of telomere G-tail length measurements. A large-scale prospective study, including different populations, will be needed to address these issues.
Conclusions
In conclusion, telomere G-tail length appears to have limited utility as a clinical indicator for patients at risk of CAD. One contributing factor could be the observed tendency for telomere G-tail length to extend with statin treatment. However, those at higher risk of cardiovascular events had significantly shorter telomere G-tail lengths than those at lower risk. Furthermore, a trend towards shortening telomere G-tail length was observed in non-statin-treated individuals corresponding with the severity of CAD. This suggests the possibility that telomere G-tail length may shorten with the progression of coronary atherosclerosis and plaque formation.
Acknowledgments
The authors express their gratitude to Yukie Nishiyama, Yuko Kamikawa, and Eriko Aoki for their clinical research advice and technical assistance.
Sources of Funding
The current study did not receive any funding or financial support.
Disclosures
H.T. is a founder and director of the board of MiRTeL Co. LTD and owns stock in MiRTeL Co. LTD. The views expressed in this publication are those of the authors and not those of the acknowledged institution. S.M. is a member of Circulation Reports’ Editorial Team. The remaining authors declare no conflicts of interest.
IRB Information
This study was approved by the Institutional Review Board of Fukuoka University Hospital (Fukuoka University Hospital EC/IRB: #U19-07-015).
References
- 1.
Haycock PC, Heydon EE, Kaptoge S, Butterworth AS, Thompson A, Willeit P. Leucocyte telomere length and risk of cardiovascular disease: Systematic review and meta-analysis. BMJ 2014; 349: g4227, doi:10.1136/bmj.g4227.
- 2.
Blackburn EH. Structure and function of telomeres. Nature 1991; 350: 569–573, doi:10.1038/350569a0.
- 3.
Levy MZ, Allsopp RC, Futcher AB, Greider CW, Harley CB. Telomere end-replication problem and cell aging. J Mol Biol 1992; 225: 951–960, doi:10.1016/0022-2836(92)90096-3.
- 4.
Nezu T, Hosomi N, Takahashi T, Anno K, Aoki S, Shimamoto A, et al. Telomere G-tail length is a promising biomarker related to white matter lesions and endothelial dysfunction in patients with cardiovascular risk: A cross-sectional study. EBioMedicine 2015; 2: 960–967, doi:10.1016/j.ebiom.2015.05.025.
- 5.
Anno K, Hayashi A, Takahashi T, Mitsui Y, Ide T, Tahara H. Telomerase activation induces elongation of the telomeric single-stranded overhang, but does not prevent chromosome aberrations in human vascular endothelial cells. Biochem Biophys Res Commun 2007; 353: 926–932, doi:10.1016/j.bbrc.2006.12.112.
- 6.
van der Harst P, van der Steege G, de Boer RA, Voors AA, Hall AS, Mulder MJ, et al. Telomere length of circulating leukocytes is decreased in patients with chronic heart failure. J Am Coll Cardiol 2007; 49: 1459–1464, doi:10.1016/j.jacc.2007.01.027.
- 7.
Brouilette S, Singh RK, Thompson JR, Goodall AH, Samani NJ. White cell telomere length and risk of premature myocardial infarction. Arterioscler Thromb Vasc Biol 2003; 23: 842–846, doi:10.1161/01.Atv.0000067426.96344.32.
- 8.
Brouilette SW, Moore JS, McMahon AD, Thompson JR, Ford I, Shepherd J, et al. Telomere length, risk of coronary heart disease, and statin treatment in the West of Scotland Primary Prevention Study: A nested case-control study. Lancet 2007; 369: 107–114, doi:10.1016/s0140-6736(07)60071-3.
- 9.
Rehkopf DH, Needham BL, Lin J, Blackburn EH, Zota AR, Wojcicki JM, et al. Leukocyte telomere length in relation to 17 biomarkers of cardiovascular disease risk: A cross-sectional study of US adults. PLoS Med 2016; 13: e1002188, doi:10.1371/journal.pmed.1002188.
- 10.
Mainous AG 3rd, Codd V, Diaz VA, Schoepf UJ, Everett CJ, Player MS, et al. Leukocyte telomere length and coronary artery calcification. Atherosclerosis 2010; 210: 262–267, doi:10.1016/j.atherosclerosis.2009.10.047.
- 11.
Stewart SA, Ben-Porath I, Carey VJ, O’Connor BF, Hahn WC, Weinberg RA. Erosion of the telomeric single-strand overhang at replicative senescence. Nat Genet 2003; 33: 492–496, doi:10.1038/ng1127.
- 12.
Hewitt G, Jurk D, Marques FD, Correia-Melo C, Hardy T, Gackowska A, et al. Telomeres are favoured targets of a persistent DNA damage response in ageing and stress-induced senescence. Nat Commun 2012; 3: 708, doi:10.1038/ncomms1708.
- 13.
Greenland P, Blaha MJ, Budoff MJ, Erbel R, Watson KE. Coronary calcium score and cardiovascular risk. J Am Coll Cardiol 2018; 72: 434–447, doi:10.1016/j.jacc.2018.05.027.
- 14.
Maron DJ, Hochman JS, Reynolds HR, Bangalore S, O’Brien SM, Boden WE, et al. Initial invasive or conservative strategy for stable coronary disease. N Engl J Med 2020; 382: 1395–1407, doi:10.1056/NEJMoa1915922.
- 15.
Verschuren WM, Jacobs DR, Bloemberg BP, Kromhout D, Menotti A, Aravanis C, et al. Serum total cholesterol and long-term coronary heart disease mortality in different cultures: Twenty-five-year follow-up of the seven countries study. JAMA 1995; 274: 131–136.
- 16.
Tiwari A. Statins and telomere length: Risk assessment and management for coronary heart disease. Expert Opin Ther Targets 2007; 11: 979–982, doi:10.1517/14728222.11.7.979.
- 17.
Olivieri F, Mazzanti I, Abbatecola AM, Recchioni R, Marcheselli F, Procopio AD, et al. Telomere/telomerase system: A new target of statins pleiotropic effect? Curr Vasc Pharmacol 2012; 10: 216–224, doi:10.2174/157016112799305076.
- 18.
Tran PT, Meeker AK, Platz EA. Association between statin drug use and peripheral blood leukocyte telomere length in the National Health and Nutrition Examination Survey 1999–2002: A cross-sectional study. Ann Epidemiol 2018; 28: 529–534, doi:10.1016/j.annepidem.2018.04.010.
- 19.
Mitsutake R, Niimura H, Miura S, Zhang B, Iwata A, Nishikawa H, et al. Clinical significance of the coronary calcification score by multidetector row computed tomography for the evaluation of coronary stenosis in Japanese patients. Circ J 2006; 70: 1122–1127, doi:10.1253/circj.70.1122.
- 20.
Dodge JTJ, Brown BG, Bolson EL, Dodge HT. Intrathoracic spatial location of specified coronary segments on the normal human heart: Applications in quantitative arteriography, assessment of regional risk and contraction, and anatomic display. Circulation 1988; 78: 1167–1180.
- 21.
Sinning C, Lillpopp L, Appelbaum S, Ojeda F, Zeller T, Schnabel R, et al. Angiographic score assessment improves cardiovascular risk prediction: The clinical value of SYNTAX and Gensini application. Clin Res Cardiol 2013; 102: 495–503, doi:10.1007/s00392-013-0555-4.
- 22.
Agatston AS, Janowitz WR, Hildner FJ, Zusmer NR, Viamonte M Jr, Detrano R. Quantification of coronary artery calcium using ultrafast computed tomography. J Am Coll Cardiol 1990; 15: 827–832, doi:10.1016/0735-1097(90)90282-t.
- 23.
Araki E, Goto A, Kondo T, Noda M, Noto H, Origasa H, et al. Japanese Clinical Practice Guideline for Diabetes 2019. Diabetology International 2020; 11: 165–223, doi:10.1007/s13340-020-00439-5.
- 24.
Combe C, McCullough KP, Asano Y, Ginsberg N, Maroni BJ, Pifer TB. Kidney Disease Outcomes Quality Initiative (K/DOQI) and the Dialysis Outcomes and Practice Patterns Study (DOPPS): Nutrition guidelines, indicators, and practices. Am J Kidney Dis 2004; 44: 39–46, doi:10.1053/j.ajkd.2004.08.010.
- 25.
Imai E, Horio M, Iseki K, Yamagata K, Watanabe T, Hara S, et al. Prevalence of chronic kidney disease (CKD) in the Japanese general population predicted by the MDRD equation modified by a Japanese coefficient. Clin Exp Nephrol 2007; 11: 156–163, doi:10.1007/s10157-007-0463-x.
- 26.
Mitsutake R, Miura S, Saku K. Association between coronary artery calcification score as assessed by multi-detector row computed tomography and upstroke time of pulse wave. Intern Med 2007; 46: 1833–1836, doi:10.2169/internalmedicine.46.0321.
- 27.
Tokitsu T, Yamamoto E, Oike F, Hirata Y, Tsujita K, Yamamuro M, et al. Clinical significance of brachial-ankle pulse-wave velocity in patients with heart failure with preserved left ventricular ejection fraction. J Hypertens 2018; 36: 560–568, doi:10.1097/hjh.0000000000001589.
- 28.
Jiang Y, Fan F, Jia J, He D, Sun P, Wu Z, et al. Brachial-ankle pulse wave velocity is independently associated with urine albumin-to-creatinine ratio in a Chinese community-based cohort. Int Urol Nephrol 2020; 52: 713–720, doi:10.1007/s11255-020-02404-2.
- 29.
Hirose M, Abe-Hashimoto J, Ogura K, Tahara H, Ide T, Yoshimura T. A rapid, useful and quantitative method to measure telomerase activity by hybridization protection assay connected with a telomeric repeat amplification protocol. J Cancer Res Clin Oncol 1997; 123: 337–344, doi:10.1007/bf01438310.
- 30.
Tahara H, Kusunoki M, Yamanaka Y, Matsumura S, Ide T. G-tail telomere HPA: Simple measurement of human single-stranded telomeric overhangs. Nat Methods 2005; 2: 829–831, doi:10.1038/nmeth797.
- 31.
Koi Y, Tsutani Y, Nishiyama Y, Kanda M, Shiroma Y, Yamamoto Y, et al. Diagnostic performance of peripheral leukocyte telomere G-tail length for detecting breast cancer. Cancer Sci 2020; 111: 1856–1861, doi:10.1111/cas.14378.
- 32.
Hirashio S, Nakashima A, Doi S, Anno K, Aoki E, Shimamoto A, et al. Telomeric G-tail length and hospitalization for cardiovascular events in hemodialysis patients. Clin J Am Soc Nephrol 2014; 9: 2117–2122, doi:10.2215/cjn.10010913.
- 33.
Bennaceur K, Atwill M, Al Zhrany N, Hoffmann J, Keavney B, Breault D, et al. Atorvastatin induces T cell proliferation by a telomerase reverse transcriptase (TERT) mediated mechanism. Atherosclerosis 2014; 236: 312–320, doi:10.1016/j.atherosclerosis.2014.07.020.
- 34.
Saliques S, Teyssier JR, Vergely C, Lorgis L, Lorin J, Farnier M, et al. Circulating leukocyte telomere length and oxidative stress: A new target for statin therapy. Atherosclerosis 2011; 219: 753–760, doi:10.1016/j.atherosclerosis.2011.09.011.
- 35.
Bhattacharyya J, Mihara K, Bhattacharjee D, Mukherjee M. Telomere length as a potential biomarker of coronary artery disease. Indian J Med Res 2017; 145: 730–737, doi:10.4103/0971-5916.216974.
- 36.
Sekikawa A, Ueshima H, Zaky WR, Kadowaki T, Edmundowicz D, Okamura T, et al. Much lower prevalence of coronary calcium detected by electron-beam computed tomography among men aged 40–49 in Japan than in the US, despite a less favorable profile of major risk factors. Int J Epidemiol 2005; 34: 173–179, doi:10.1093/ije/dyh285.
- 37.
Sekikawa A, Miura K, Lee S, Fujiyoshi A, Edmundowicz D, Kadowaki T, et al. Long chain n-3 polyunsaturated fatty acids and incidence rate of coronary artery calcification in Japanese men in Japan and white men in the USA: Population based prospective cohort study. Heart 2014; 100: 569–573, doi:10.1136/heartjnl-2013-304421.
- 38.
Matthews C, Gorenne I, Scott S, Figg N, Kirkpatrick P, Ritchie A, et al. Vascular smooth muscle cells undergo telomere-based senescence in human atherosclerosis: Effects of telomerase and oxidative stress. Circ Res 2006; 99: 156–164, doi:10.1161/01.RES.0000233315.38086.bc.
- 39.
Jia X, Wei M, Fu X, Gu X, Fan W, Zhang J, et al. Intensive cholesterol-lowering therapy improves large artery elasticity in acute myocardial infarction patients. Heart Vessels 2009; 24: 340–346, doi:10.1007/s00380-008-1132-z.
- 40.
Hongo M, Tsutsui H, Mawatari E, Hidaka H, Kumazaki S, Yazaki Y, et al. Fluvastatin improves arterial stiffness in patients with coronary artery disease and hyperlipidemia: A 5-year follow-up study. Circ J 2008; 72: 722–728, doi:10.1253/circj.72.722.
- 41.
Yamashina A, Tomiyama H, Arai T, Hirose K, Koji Y, Hirayama Y, et al. Brachial-ankle pulse wave velocity as a marker of atherosclerotic vascular damage and cardiovascular risk. Hypertens Res 2003; 26: 615–622, doi:10.1291/hypres.26.615.
- 42.
Koji Y, Tomiyama H, Ichihashi H, Nagae T, Tanaka N, Takazawa K, et al. Comparison of ankle-brachial pressure index and pulse wave velocity as markers of the presence of coronary artery disease in subjects with a high risk of atherosclerotic cardiovascular disease. Am J Cardiol 2004; 94: 868–872, doi:10.1016/j.amjcard.2004.06.020.
- 43.
Takashima N, Turin TC, Matsui K, Rumana N, Nakamura Y, Kadota A, et al. The relationship of brachial-ankle pulse wave velocity to future cardiovascular disease events in the general Japanese population: The Takashima Study. J Hum Hypertens 2014; 28: 323–327, doi:10.1038/jhh.2013.103.
- 44.
Munakata M, Nunokawa T, Yoshinaga K, Toyota T. Brachial-ankle pulse wave velocity is an independent risk factor for microalbuminuria in patients with essential hypertension: A Japanese trial on the prognostic implication of pulse wave velocity (J-TOPP). Hypertens Res 2006; 29: 515–521, doi:10.1291/hypres.29.515.
- 45.
Vlachopoulos C, Aznaouridis K, Terentes-Printzios D, Ioakeimidis N, Stefanadis C. Prediction of cardiovascular events and all-cause mortality with brachial-ankle elasticity index: A systematic review and meta-analysis. Hypertension 2012; 60: 556–562, doi:10.1161/hypertensionaha.112.194779.
- 46.
Wai KM, Kaori S, Itoh K, Shinya O, Uchikawa Y, Hayashi S, et al. Telomere length and arterial stiffness reflected by brachial-ankle pulse wave velocity: A population-based cross-sectional study. J Pers Med 2021; 11: 1278, doi:10.3390/jpm11121278.
- 47.
Ko DH, Kim YH, Han JK. Relationship between cardiovascular disease risk factors, health behavior and physical fitness according to visceral fat in older men. JOMH 2022; 18: 128, doi:10.31083/j.jomh1806128.
- 48.
Kinoshita T, Yahaba M, Terada J, Matsumura T, Sakurai Y, Nagashima K, et al. Impact of arterial stiffness on WatchPAT variables in patients with obstructive sleep apnea. J Clin Sleep Med 2018; 14: 319–325, doi:10.5664/jcsm.6970.
- 49.
Carrero JJ, Stenvinkel P, Fellström B, Qureshi AR, Lamb K, Heimbürger O, et al. Telomere attrition is associated with inflammation, low fetuin-A levels and high mortality in prevalent haemodialysis patients. J Intern Med 2008; 263: 302–312, doi:10.1111/j.1365-2796.2007.01890.x.
- 50.
Houben JM, Moonen HJ, van Schooten FJ, Hageman GJ. Telomere length assessment: Biomarker of chronic oxidative stress? Free Radic Biol Med 2008; 44: 235–246, doi:10.1016/j.freeradbiomed.2007.10.001.
- 51.
Glass CK, Witztum JL. Atherosclerosis: The road ahead. Cell 2001; 104: 503–516, doi:10.1016/s0092-8674(01)00238-0.
- 52.
Satoh M, Ishikawa Y, Takahashi Y, Itoh T, Minami Y, Nakamura M. Association between oxidative DNA damage and telomere shortening in circulating endothelial progenitor cells obtained from metabolic syndrome patients with coronary artery disease. Atherosclerosis 2008; 198: 347–353, doi:10.1016/j.atherosclerosis.2007.09.040.