Abstract
Background: The accumulation of ubiquitinated proteins has been detected in diseased hearts and has been associated with the expression of p62 and microtubule-associated protein 1 light chain 3 (LC3), which are related to autophagy. We evaluated differences in ubiquitin accumulation and p62 and LC3 expression in cardiomyopathy using endomyocardial biopsies.
Methods and Results: We studied 24 patients (aged 24–70 years; mean age 55 years) diagnosed with dilated cardiomyopathy (DCM), hypertrophic cardiomyopathy (HCM), or non-cardiomyopathy (NCM) who underwent endomyocardial biopsy. Biopsied samples were evaluated by microscopy for ubiquitin accumulation and expression of p62 and LC3. Ubiquitin accumulation and p62 and LC3 expression were observed in all patients. Ubiquitin accumulation was higher in DCM than in HCM or NCM; p62 expression was higher in DCM than in HCM. There were no significant differences in LC3 expression among the groups. Ubiquitin accumulation was significantly related to serum N-terminal pro B-type natriuretic peptide concentration and the expression of p62, but not LC3.
Conclusions: Ubiquitin accumulation was more prominent in DCM than in HCM and NCM, which may be due to a relative shortage of clearance, including autophagy, compared with production.
Cardiac protein homeostasis is regulated by a protein quality control machinery that detects, repairs, and disposes of cytotoxic proteins using various mechanisms, which include chaperone proteins, the ubiquitin-proteasome system (UPS), and autophagy.1 Abnormal aggregation and accumulation of ubiquitinated proteins in the cytosol have been detected in human hearts with idiopathic or ischemic cardiomyopathies.2,3 Autophagy can be detected using electron microscopy, and its dysregulation is associated with several cardiac diseases, including cardiomyopathy.4 A previous study showed that immunohistochemistry for microtubule-associated protein 1 light chain 3 (LC3) and p62 can be used to detect autophagy.5 However, there are no precise histological reports on the expression of ubiquitin, LC3, or p62 in cardiac diseases. The aim of this study was to evaluate the accumulation of ubiquitin and the expression of p62 and LC3 in cardiac myocytes in dilated cardiomyopathy (DCM), hypertrophic cardiomyopathy (HCM), and non-cardiomyopathy (NCM).
Methods
The Ethics Committee of Nagasaki University Hospital approved the study protocol (Approval no. 20081714-3), and the study was conducted in accordance with the Declaration of Helsinki. Written informed consent was obtained from the patients for the publication of their details.
Between January 2018 and December 2021 (3 years), we evaluated patients (aged 24–72 years) who underwent endomyocardial biopsy owing to clinical suspicion of myocardial diseases, including cardiomyopathy and myocarditis. Of these patients, 24 (aged 24–70 years; mean age 55 years) were included in the present study. The clinical characteristics, laboratory data, and histopathological features (photomicrography) of these patients were evaluated.
Histopathology
The biopsied myocardium was fixed in 10% neutral-buffered formalin and embedded in paraffin. Sections (4 μm) were prepared and were subjected to hematoxylin and eosin staining or immunostaining. The primary and secondary antibodies used were as follows: rabbit polyclonal anti-p62 (MBL, Tokyo, Japan; 1 : 200 dilution) and goat polyclonal anti-rabbit IgG for p62; mouse monoclonal anti-LC3 (MBL; 1 : 1,000 dilution) and goat polyclonal anti-mouse IgG for LC3; and mouse monoclonal anti-ubiquitin (GeneTex, Irvine, CA, USA; 1 : 1,000 dilution) and goat polyclonal anti-mouse IgG for ubiquitin. Samples were incubated at 4℃ overnight after microwave treatment in citrate buffer.
To quantify the expression of ubiquitin and p62, image intensity was evaluated using WinROOF software (MITANI Corporation, Fukui, Japan), a multipurpose color image processor. Briefly, images covering most of the biopsy specimen area in one visual field were obtained randomly under a light microscope (magnification ×200; BX-53; Olympus). Raw imaging data were analyzed using WinROOF to quantify ubiquitin and p62 immunopositivity in cardiomyocytes.
The number of LC3-immunopositive dots within cardiac myocytes was counted in 5 randomly chosen high-power fields (magnification ×400).
Statistical Analysis
Statistical analyses were performed for all study variables. Continuous variables are expressed as the mean±SD or as the median and interquartile range, and were compared using Student’s t-test or Welch’s test, as appropriate. Categorical variables were compared using the χ2
test or Fisher’s exact test.
Correlations between 2 variables were analyzed, with Spearman’s rank correlation test was used to measure the degree of association between the 2 variables. Statistical significance was set at P<0.05. All analyses were performed using JMP Pro17 (SAS Institute, Cary, NC, USA).
Results
The characteristics of the study population are summarized in Table 1. This study included 9 patients with DCM, 10 with HCM, and 5 with NCM (3 with sarcoidosis and 2 with hypertensive heart disease) who were clinically and pathologically diagnosed using endomyocardial biopsy.
Table 1. Patient Characteristics and Data
| Age (years) |
58.5 [52–68] |
| Female sex |
6 (25.0) |
| BMI (kg/m2) |
26.3 [23.3–28.0] |
| Drinking history |
13 (54.2) |
| Smoking |
13 (54.2) |
| DCM |
9 (37.5) |
| HCM |
10 (41.7) |
| Sarcoidosis |
3 (12.5) |
| Hypertension |
13 (54.2) |
| Untreated hypertension |
2 (8.3) |
| Diabetes |
9 (37.5) |
| CAD |
0 (0.0) |
| COPD |
1 (4.2) |
| Stroke |
1 (4.2) |
| Anemia |
2 (8.3) |
| CKD |
7 (29.2) |
| VT |
4 (16.7) |
| Atrial fibrillation |
3 (12.5) |
| LVAD |
1 (4.2) |
| Valve surgery |
2 (8.3) |
| Laboratory data |
| WBC (/μL) |
5,950 [4,950.0–7,375.0] |
| Lymphocytes (%) |
32.4 [20.5–37.8] |
| Hemoglobin (g/dL) |
14.7 [13.8–15.4] |
| Platelets (×104/μL) |
18.9 [15.8–21.7] |
| Total protein (g/dL) |
7.2 [6.9–7.7] |
| Albumin (g/dL) |
4.2 [4.0–4.5] |
| Total bilirubin (mg/dL) |
0.80 [0.60–1.1] |
| NT-proBNP (pg/mL) |
1,260.0 [388.0–1,966.5] |
| eGFR (mL/min/1.73 m2) |
62.7 [52.5–73.7] |
| hs-TNT (ng/mL) |
0.016 [0.011–0.033] |
| HbA1c (%) |
6.2 [5.7–6.5] |
| Creatine kinase (U/L) |
80.5 [63.8–162.3] |
| CRP (mg/dL) |
0.09 [0.04–0.19] |
| Echocardiography |
| IVST (mm) |
11.5 [9.0–17.3] |
| PWT (mm) |
11.0 [8.3–12.0] |
| LVDd (mm) |
53.5 [41.5–64.3] |
| LVDs (mm) |
33.0 [25.0–56.0] |
| LVEF (%) |
45.0 [27.3–72.8] |
| E/A |
0.95 [0.80–1.8] |
| LAD (mm) |
43.5 [38.0–47.0] |
| LAVI (mL/m2) |
47.0 [34.0–53.0] |
| TRPG (mmHg) |
25.0 [22.0–31.0] |
| RVD (mm) |
27.0 [23.0–31.0] |
| Medications |
| β-blocker |
18 (66.7) |
| MRA |
8 (33.3) |
| ACEi/ARB |
11 (45.8) |
| ARNI |
0 (0.0) |
| SGLT2 inhibitor |
2 (8.3) |
| Diuretics |
9 (37.5) |
Values are presented as n (%) or as the median [interquartile range]. ACEi, angiotensin converting enzyme inhibitor; ARB, angiotensin receptor blocker; ARNI, angiotensin receptor-neprilysin inhibitor; BMI, body mass index; CAD, coronary artery disease; CKD, chronic kidney disease; COPD, chronic obstructive pulmonary disease; CRP, C-reactive protein; DCM, dilated cardiomyopathy; eGFR, estimated glomerular filtration rate; HCM, hypertrophic cardiomyopathy; hs-TNT, high-sensitivity troponin T; IVST, interventricular septal thickness; LAD, left atrial diameter; LAVI, left atrial volume index; LVAD, left ventricular assist device; LVDd, left ventricular diastolic dimension; LVDs, left ventricular systolic dimension; LVEF, left ventricular ejection fraction; MRA, mineralocorticoid receptor antagonist; NT-proBNP, N-terminal pro B-type natriuretic peptide; PWT, posterior wall thickness; RVD, right ventricular dimension; SGLT2, sodium-glucose cotransporter 2; TRPG, tricuspid regurgitation pressure gradient; VT, ventricular tachycardia; WBC, white blood cell count.
DCM, HCM, and NCM were defined as follows. DCM was defined as left ventricular ejection fraction (LVEF) ≤40% and left ventricular (LV) dilatation not explained by coronary artery disease or other causes of global systolic dysfunction, such as abnormal loading conditions, tachycardiomyopathy, cardiotoxicity, or myocarditis. HCM was defined as the presence of increased LV wall thickness that was not solely explained by abnormal loading conditions with characteristic pathological features, including myocardial disarray. NCM was defined as any condition other than cardiomyopathy (primary myocardial disease in the absence of coronary artery disease, hypertension, valvular disease, and congenital heart disease). Parameters were compared between these groups, in addition their evaluation in all patients.
Body mass index was higher in the NCM than DCM and HCM groups (Table 2). N-Terminal pro B-type natriuretic peptide (NT-proBNP) concentrations were significantly higher in the DCM than HCM and NCM groups, and the estimated glomerular filtration rate was lower in the DCM than HCM group (Table 2). Creatine kinase and high-sensitivity troponin T levels did not differ significantly among the groups (Table 2). Transthoracic echocardiography (TTE) revealed that the interventricular septal thickness (IVST) was greater in the HCM than DCM and NCM groups, and that LV posterior wall thickness (LVPWT) was smaller in the DCM than HCM and NCM groups (Table 2). The LV diastolic dimension (LVDd) and LV systolic dimension were lower in the HCM group than in the DCM and NCM groups. LVEF was higher in the HCM than DCM and NCM groups, and was lower in the DCM than NCM group (Table 2).
Table 2. Comparisons of Characteristics and Data Among Groups
| |
DCM (n=9) |
HCM (n=10) |
NCM (n=5) |
P value |
DCM vs.
HCM |
DCM vs.
NCM |
HCM vs.
NCM |
| Age (years) |
58.0 [55.5–64.5] |
64 [52.0–70.0] |
42.5 [32.3–61.8] |
0.5637 |
0.2007 |
0.0729 |
| Female sex |
2 (22.2) |
3 (30) |
1 (20.0) |
1.000 |
1.000 |
1.000 |
| BMI (kg/m2) |
23.9 [19.4–27.9] |
25.4 [24.1–27.7] |
30.4 [26.4–34.8] |
0.3913 |
0.0117 |
0.0070 |
| Drinking history |
4 (44.4) |
6 (60.0) |
3 (60.0) |
0.6563 |
1.000 |
1.000 |
| Smoking |
4 (44.4) |
5 (50.0) |
4 (80.0) |
1.000 |
0.3007 |
0.5804 |
| Hypertension |
4 (44.4) |
5 (50.0) |
4 (80.0) |
1.000 |
0.3007 |
0.5804 |
| Diabetes |
3 (33.3) |
4 (40.0) |
2 (40.0) |
1.000 |
1.000 |
1.000 |
| CAD |
0 (0.0) |
0 (0.0) |
0 (0.0) |
– |
– |
– |
| COPD |
1 (11.1) |
0 (0.0) |
0 (0.0) |
0.4737 |
1.000 |
– |
| Stroke |
0 (0.0) |
1 (10.0) |
0 (0.0) |
1.000 |
– |
1.000 |
| Anemia |
2 (22.2) |
0 (0.0) |
0 (0.0) |
0.2105 |
0.5055 |
– |
| CKD |
3 (33.3) |
2 (20.0) |
2 (40.0) |
0.6285 |
1.000 |
0.5604 |
| VT |
2 (22.2) |
1 (10.0) |
1 (20.0) |
0.5820 |
1.000 |
1.000 |
| Atrial fibrillation |
3 (33.3) |
0 (0.0) |
0 (0.0) |
0.0867 |
0.2582 |
– |
| LVAD |
1 (11.1) |
0 (0.0) |
0 (0.0) |
0.4737 |
1.000 |
– |
| Valve surgery |
2 (22.2) |
0 (0.0) |
0 (0.0) |
0.2105 |
0.4000 |
– |
| Laboratory data |
| WBC (/μL) |
6,600.0
[5,050.0–7,250.0] |
5,450.0
[4,750.0–6,625.0] |
8,550.0
[5,100.0–15,700.0] |
0.3911 |
0.6404 |
0.3263 |
| Hemoglobin (g/dL) |
14.6 [13.7–15.6] |
14.3 [13.8–15.0] |
15.6 [14.3–16.5] |
0.4373 |
0.1815 |
0.0821 |
| Platelet (×104/μL) |
18.9 [15.7–22.0] |
18.1 [16.3–20.2] |
24.6 [11.3–34.3] |
0.5544 |
0.8839 |
0.6682 |
| Total protein (g/dL) |
7.0 [6.1–7.9] |
7.1 [6.9–7.5] |
7.6 [6.8–7.8] |
0.9673 |
0.2849 |
0.1013 |
| Albumin (g/dL) |
4.1 [3.7–4.5] |
4.2 [4.0–4.4] |
4.3 [3.5–4.5] |
0.7428 |
0.2744 |
0.2863 |
| Total bilirubin (mg/dL) |
0.90 [0.80–1.2] |
0.7 [0.6–1.1] |
0.75 [0.48–2.6] |
0.1915 |
0.2539 |
0.6217 |
| NT-proBNP (pg/mL) |
2,662.0
[1,408.0–6,508.5] |
671.5
[334.5–1,621.5] |
945.5
[187.9–6,026.8] |
0.0048 |
0.0113 |
0.5815 |
| eGFR (mL/min/1.73 m2) |
52.6 [38.2–62.7] |
72.1 [59.1–76.7] |
63.4 [46.8–74.2] |
0.0333 |
0.1880 |
0.6595 |
| hs-TNT (ng/mL) |
0.024
[0.013–0.050] |
0.014
[0.011–0.020] |
0.017
[0.012–0.074] |
0.1411 |
0.4232 |
0.7123 |
| HbA1c (%) |
6.2 [5.7–6.4] |
6.1 [5.3–6.7] |
6.3 [5.6–6.9] |
0.84117 |
0.9412 |
0.8539 |
| Creatine kinase (U/L) |
78.0 [56.5–136.5] |
104.5 [76.0–177.0] |
64.5 [50.5–217.3] |
0.3475 |
0.3852 |
0.0861 |
| CRP (mg/dL) |
0.11 [0.040–0.20] |
0.065 [0.040–0.14] |
0.19 [0.085–3.6] |
0.6517 |
0.3496 |
0.1406 |
| Echocardiography |
| IVST (mm) |
9.0 [7.4–10.0] |
18.0 [14.75–22] |
9.5 [8.8–12.5] |
0.0004 |
0.1247 |
0.0042 |
| PWT (mm) |
8.0 [8.0–10.5] |
12.0 [10.0–133.0] |
12.0 [11.3–14.0] |
0.0187 |
0.0122 |
1.000 |
| LVDd (mm) |
65.0 [61.0–70.5] |
41.0 [34.8–43.8] |
60.0 [51.8–72.3] |
<0.0001 |
0.1559 |
0.0005 |
| LVDs (mm) |
56.0 [53.5–62.5] |
25.0 [19.0–27.0] |
51.5 [34.0–59.0] |
0.0036 |
0.1606 |
0.0026 |
| LVEF (%) |
26.0 [19.5–35.0] |
73.0 [69.5–76.5] |
36.5 [29.5–57.8] |
0.0003 |
0.0443 |
0.0119 |
| E/A |
1.7 [0.95–3.0] |
0.85 [0.78–0.93] |
1.4 [1.0–3.2] |
0.0558 |
0.9151 |
0.1141 |
| LAD (mm) |
45.0 [41.5–50.0] |
38.5 [36.3–44.3] |
46.0 [33.0–47.3] |
0.0202 |
0.2224 |
0.6112 |
| LAVI (mL/m2) |
48.0 [37.0–54.0] |
44.0 [33.0–51.0] |
35.0 [20.0–62.0] |
0.3640 |
0.4101 |
0.7156 |
| TRPG (mmHg) |
23.0 [20.5–28.5] |
24.0 [21.5–32.0] |
28.0 [22.8–38.3] |
0.7234 |
0.1231 |
0.2134 |
| RVD (mm) |
31 [23.3–33.8] |
27.0 [21.0–28.5] |
28.5 [25.5–30.0] |
0.1344 |
0.6191 |
0.3098 |
| Medications |
| β-blocker |
8 (88.9) |
1 (11.1) |
0 (0.0) |
1.0000 |
0.0030 |
0.07 |
| MRA |
8 (88.9) |
0 (0.0) |
0 (0.0) |
0.0001 |
0.0030 |
– |
| ACEi/ARB |
6 (66.7) |
4 (40.0) |
1 (20.0) |
0.3698 |
0.2657 |
0.6004 |
| ARNI |
0 (0.0) |
0 (0.0) |
0 (0.0) |
– |
– |
– |
| SGLT2 inhibitor |
1 (11.1) |
1 (10.0) |
0 (0.0) |
1.0000 |
1.0 |
1.000 |
| Diuretics |
9 (100.0) |
0 (0.0) |
0 (0.0) |
<0.0001 |
0.0005 |
– |
Unless indicated otherwise, values presented as n (%) or as the median [interquartile range]. NCM, non-cardiomyopathy. Other abbreviations as in Table 1.
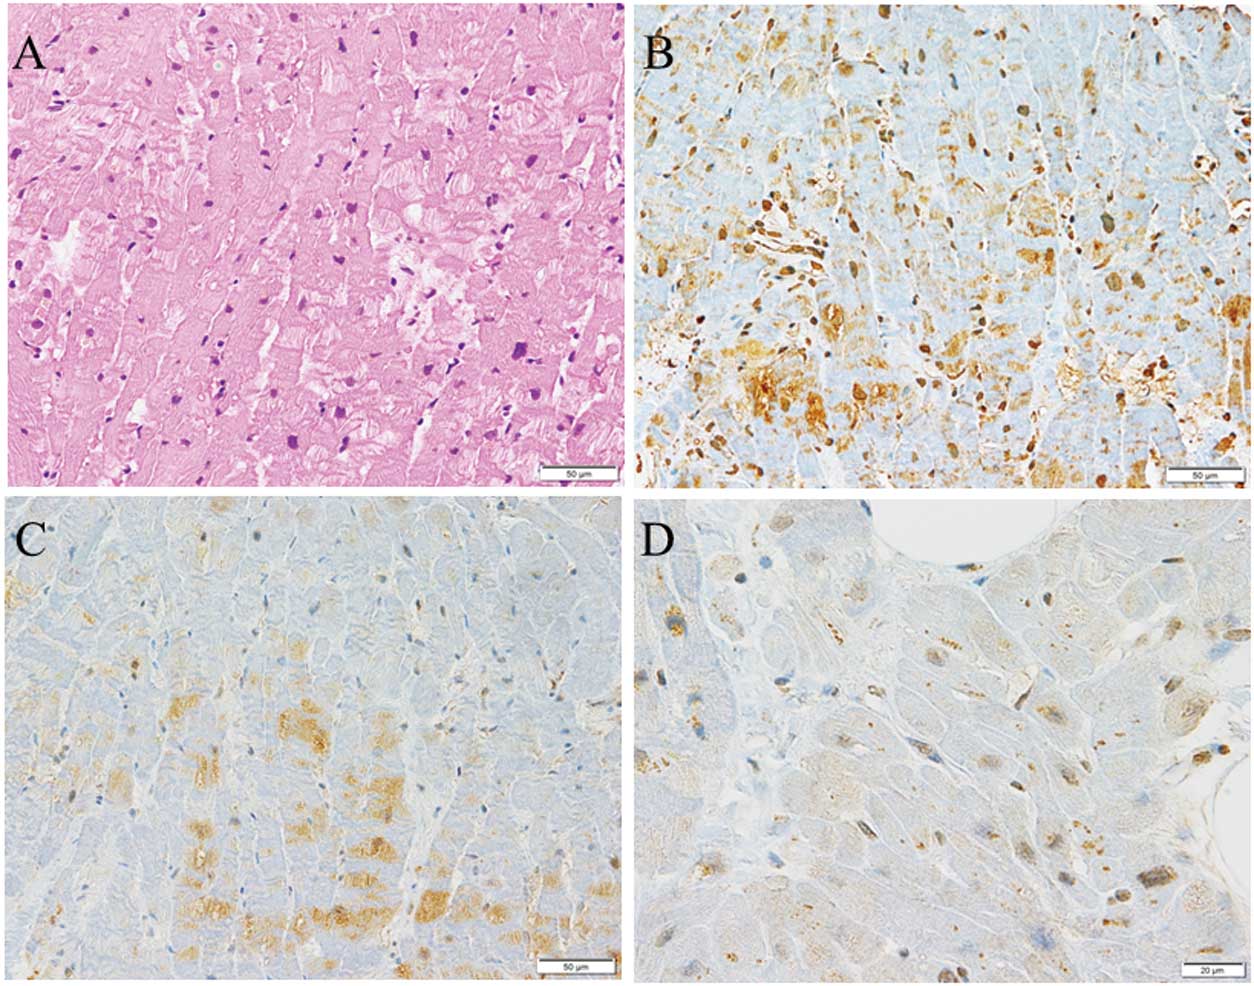
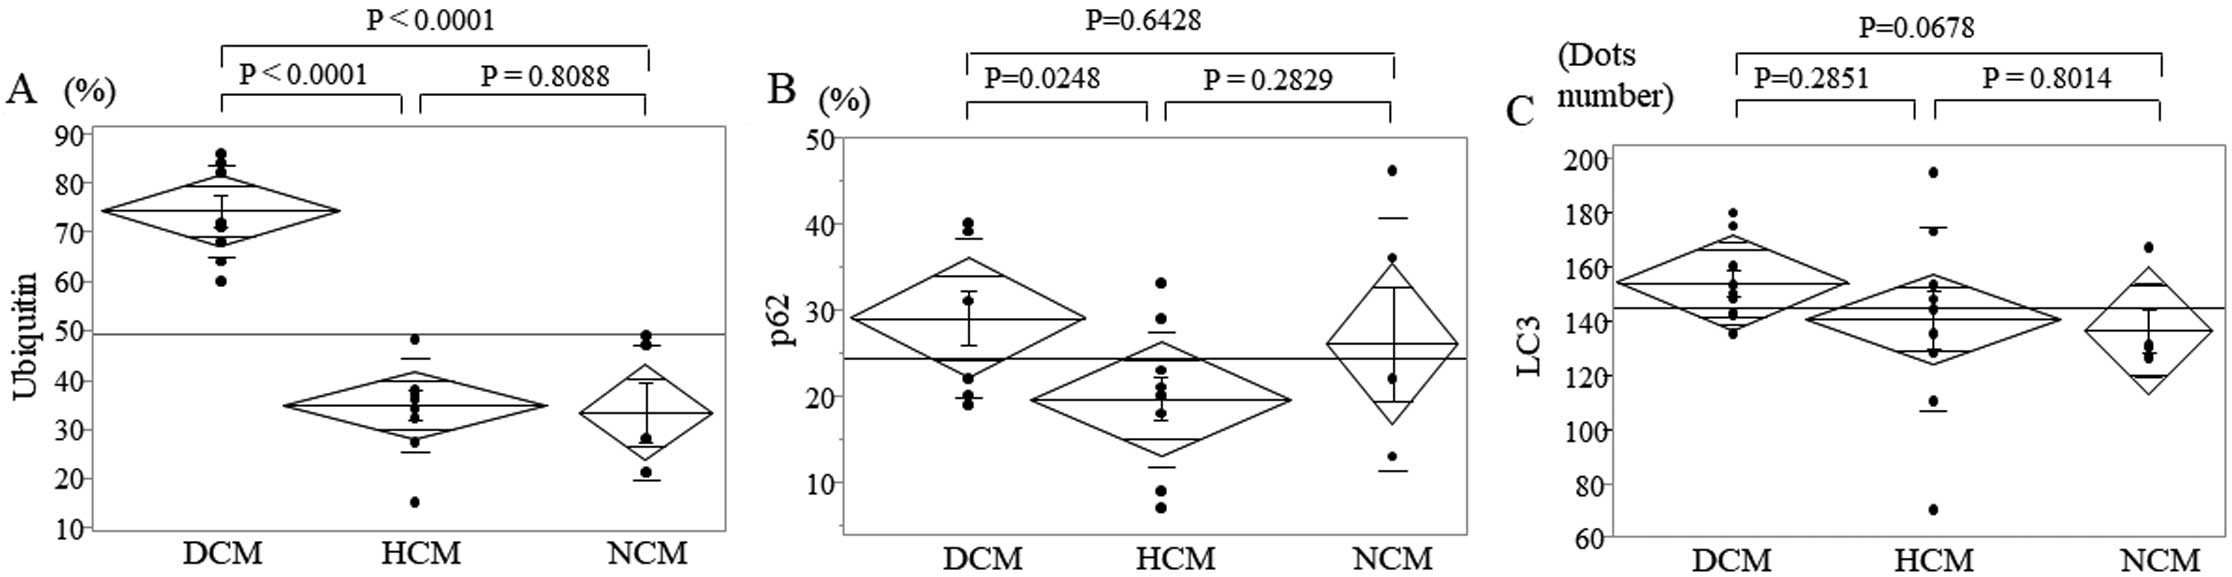
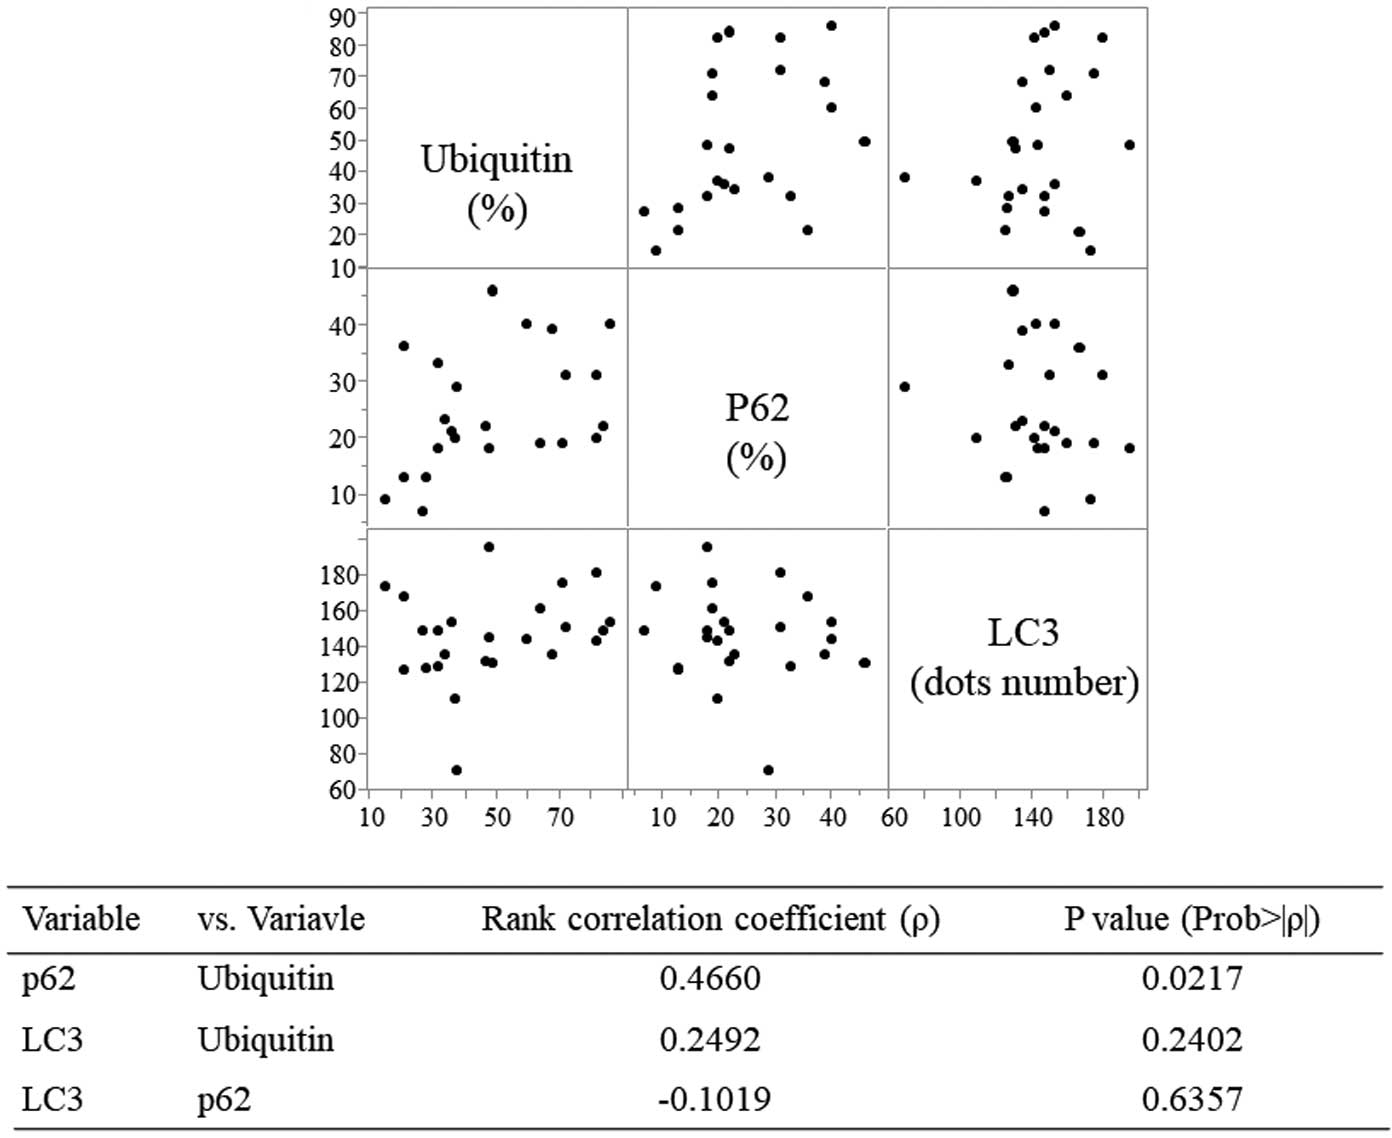
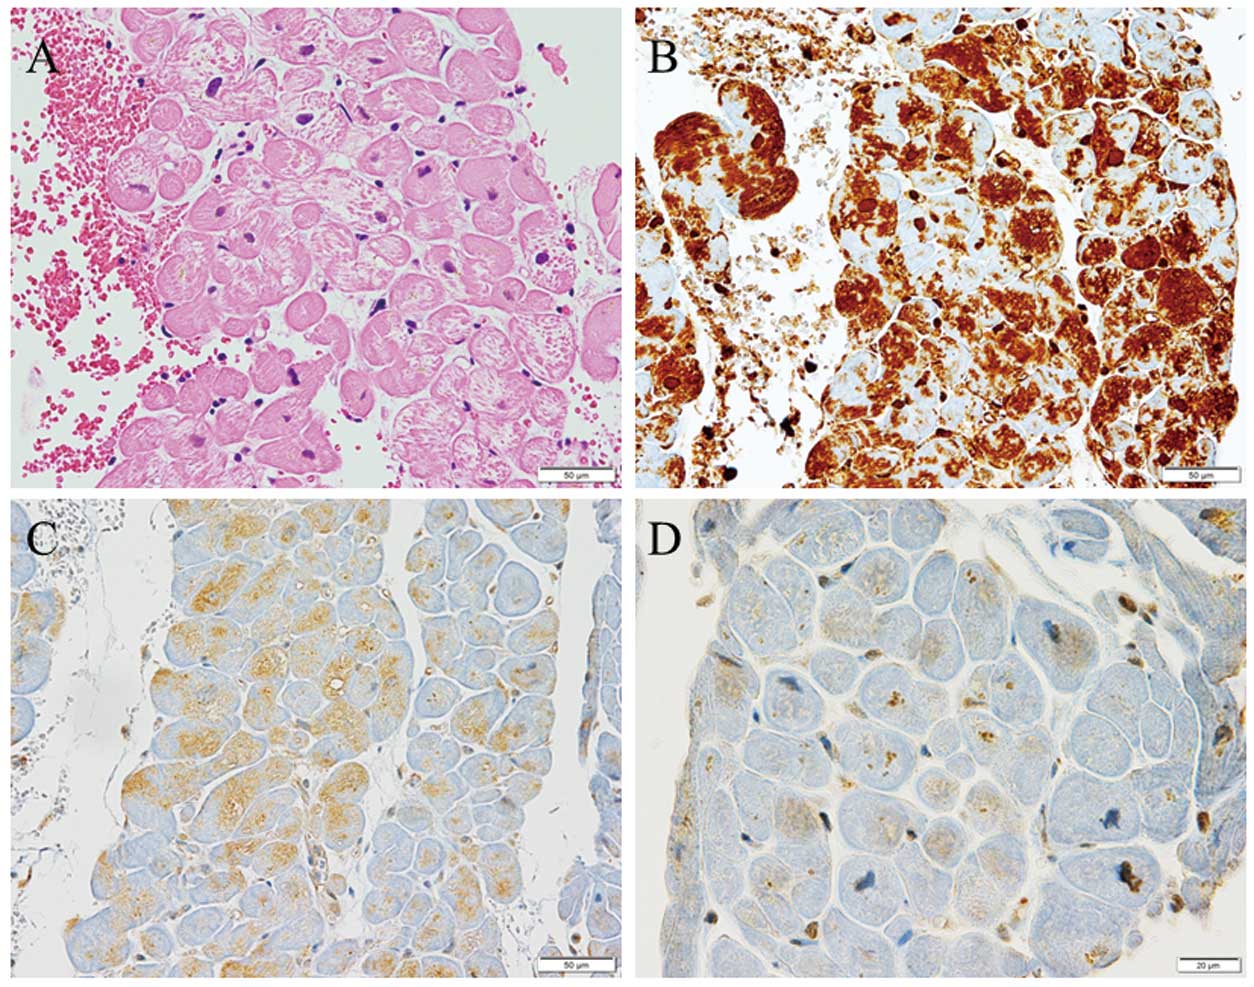
Immunohistochemical staining demonstrated ubiquitin accumulation and p62 and LC3 expression in cardiac myocytes in DCM (Figure 1), HCM (Figure 2), and NCM (Figure 3). Ubiquitin accumulation was higher in the DCM than HCM and NCM groups (74.3±9.5% vs. 34.7±9.6% and 33.2±13.8%, respectively; P<0.0001 for both; Figure 4A). The expression of p62 was higher in the DCM than HCM group (29.0±9.2% vs. 19.6±2.7%, respectively; P=0.0284; Figure 4B). There was no significant difference in LC3 expression among the three groups (Figure 4C). Ubiquitin accumulation was significantly related to p62 expression (ρ=0.4660, P=0.0217) but not to LC3 expression (ρ=0.2492, P=0.2402; Figure 5).
Serum NT-proBNP concentrations were significantly related to ubiquitin accumulation (ρ=0.5470, P=0.0057), but not to p62 (ρ=0.2296, P=0.2804) or LC3 (ρ=0.3121, P=0.1376) expression (Table 3). The high-sensitivity troponin level, a marker of myocardial damage, showed no significant relationship with ubiquitin, p62, or LC3.
Table 3. Correlations Between Parameters
| Variable |
vs. variable |
Rank correlation
coefficient ([ρ]) |
P value |
| Laboratory data |
| NT-proBNP |
Ubiquitin |
0.5470 |
0.0057 |
| p62 |
0.2296 |
0.2804 |
| LC3 |
0.3121 |
0.1376 |
| hs-TNT |
Ubiquitin |
0.1350 |
0.5292 |
| p62 |
0.1989 |
0.3514 |
| LC3 |
0.2223 |
0.2965 |
| TTE |
| IVST |
Ubiquitin |
−0.5207 |
0.0091 |
| p62 |
−0.5817 |
0.0029 |
| LC3 |
−0.0083 |
0.9693 |
| LVPWT |
Ubiquitin |
−0.6041 |
0.0018 |
| p62 |
−0.4877 |
0.0156 |
| LC3 |
−0.1904 |
0.3728 |
| LVDD |
Ubiquitin |
0.5472 |
0.0057 |
| p62 |
0.2091 |
0.3267 |
| LC3 |
0.0763 |
0.7229 |
| LVEF |
Ubiquitin |
−0.6374 |
0.0008 |
| p62 |
−0.3057 |
0.1463 |
| LC3 |
0.066 |
0.7592 |
LVPWT, left ventricular posterior wall thickness; TTE, transthoracic echocardiography. Other abbreviations as in Table 1.
Among the TTE parameters, IVST and LVPWT were significantly and negatively correlated with ubiquitin accumulation (IVST: ρ=−0.5207, P=0.0091; LVPWT: ρ=−0.6041, P=0.0018) and p62 expression (IVST: ρ=−0.5817, P=0.0029; LVPWT: ρ=−0.4877, P=0.0156; Table 3). LVDd was positively correlated with ubiquitin (ρ=0.5472, P=0.0057) accumulation, whereas LVEF was negatively correlated with ubiquitin accumulation (ρ=−0.6374, P=0.0008; Table 3).
Discussion
Otsuka et al6 demonstrated that the area fraction of ubiquitin was significantly higher in DCM hearts than in normal controls, and that it was significantly positively correlated with plasma B-type natriuretic peptide concentrations in DCM hearts. Weekes et al7 reported that overall protein ubiquitination increased 2-fold in DCM relative to ischemic heart disease hearts and 5-fold relative to donor hearts, although the precise mechanism was unknown. Our data showed that ubiquitin accumulation increased approximately 2-fold in DCM compared with diseased (HCM and NCM) hearts, and that ubiquitin accumulation was positively correlated with NT-proBNP and LVDd and negatively correlated with LVEF. These results are consistent with those of previous studies and suggest that ubiquitin accumulation may be related to cardiac dysfunction, especially in DCM.
We also demonstrated the expression of p62 and LC3 in all patients, indicating the presence of autophagy. The expression of p62 was lower in HCM than DCM, and p62 was negatively correlated with LVPWT, but LC3 showed no significant differences among the groups and no relationship with biomarkers or echocardiographic data for heart failure and cardiac dysfunction.
LC3 is a component of autophagy vacuoles, and previous studies have shown an increase in LC3 in cardiac myocytes in the hearts of transgenic DCM mouse models,8 as well as in patients with ischemic cardiomyopathy or DCM compared with control hearts.9,10 Mechanical unloading of the failing human heart by an LV assist device (LVAD) decreases autophagy markers, including LC3, suggesting that autophagy may be an adaptive mechanism in the failing heart and that this phenomenon is attenuated by LVAD support.11 Kostin et al3 reported that cytosolic ubiquitin-positive aggregates linked to increased levels of autophagy were observed in DCM. It has been also reported that LC3 protein levels were higher in HCM septal myectomies than in non-failing control hearts.4 Taken together, our LC3 data are compatible with those of previous studies, suggesting that the levels of autophagy activation may be similar among DCM, HCM, and NCM patients with heart failure.
Previous reports have shown an increase and/or accumulation of p62 in cardiac myocytes in DCM and genetic cardiomyopathy.8,12,13 However, there are no precise reports on p62 expression in HCM. p62 is a multidomain, multifunction protein involved in autophagy and a series of signaling processes.14,15 p62 is a ubiquitin- and LC3-binding protein that is essential for the clearance of ubiquitinated and non-ubiquitinated proteins by autophagy.16 p62 itself is degraded during autophagy, and the suppression of autophagy leads to the accumulation of p62.17 The transcription of p62 is modulated by oxidative stress (nuclear factor erythroid 2-related factor 2 [Nrf2]), the Ras/mitogen-activated protein kinase pathway, the JNK/c-Jun pathway, and some chemical compounds.18 The UPS is indispensable for the degradation of most proteins, including myofibrillar proteins, and the ubiquitination of target proteins is required for degradation by the UPS.19 Proteasome inhibition and other stressors, such as starvation, can also induce p62 synthesis.20 Thus, the expression of p62 may depend on the balance between its production by certain factors, including UPS inhibition, and degradation by autophagy.
Although misfolded protein accumulation and aggresome formation characterize DCM hearts, aggresomes fail to trigger the autophagy lysosomal pathway, with consequent accumulation of both p62 and dysfunctional mitochondria.12 p62 is upregulated in mouse proteinopathic hearts. p62 promotes aggresome formation and autophagy activation and protects cardiomyocytes against proteotoxic stress.21 Disruption of cardiomyocyte autophagy has been reported in cardiac DCM, as well as in aging, diabetes, and heart failure.22–24
Previous studies have shown that excessive cardiac autophagy leads to cardiac hypertrophy and heart failure.25,26 A previous pathological study showed that numerous cardiomyocytes had ubiquitin-positive inclusions, and ultrastructural analysis indicated that cardiomyocytes contained typical autophagic vacuoles in the biopsied myocardium of a patient in the transition stage from HCM to heart failure.27 Moreover, autophagy is activated during ventricular hypertrophy to maintain cellular homeostasis, although excessive autophagy eliminates essential cellular elements and possibly provokes cell death, which, together, contribute to hypertension-related heart disease.28 Thus, prompt autophagy activation may be related to the lower expression of p62 in HCM without severe heart failure than in DCM.
Recently, other autophagy mechanisms have been shown to be independent of ubiquitin-binding receptors, including p62.29,30 Thus, mechanisms other than p62 may be related to differences in p62 expression between DCM and HCM.
This study had some limitations. First, this was a single-center retrospective study, and the number of cases was small and may not be enough to demonstrate significant differences between groups for some data. We did not examine autophagy or mitophagy levels in the myocardium using electron microscopy. We also did not have cardiac magnetic resonance imaging data, including late gadolinium enhancement, for the evaluation of autophagic cell death.
Conclusions
In conclusion, ubiquitin accumulation was more prominent in DCM than in HCM and NCM, which may be due to a relative shortage of clearance, including autophagy, compared with production.
Disclosures
K.M. is a member of Circulation Reports’ Editorial Team. The remaining authors have no conflicts of interest to declare.
IRB Information
This study was approved by thee Ethics Committee of Nagasaki University Hospital (Approval no. 20081714-3).
References
- 1.
Wang X, Robbins J. Heart failure and protein quality control. Circ Res 2006; 99: 1315–1328, doi:10.1161/01.RES.0000252342.61447.a2.
- 2.
Heling A, Zimmermann R, Kostin S, Maeno Y, Hein S, Devaux B, et al. Increased expression of cytoskeletal, linkage, and extracellular proteins in failing human myocardium. Circ Res 2000; 86: 846–853, doi:10.1161/01.res.86.8.846.
- 3.
Kostin S, Pool L, Elsässer A, Hein S, Drexler HC, Arnon E, et al. Myocytes die by multiple mechanisms in failing human hearts. Circ Res 2003; 92: 715–724, doi:10.1161/01.Res.0000067471.95890.5c.
- 4.
Singh SR, Zech ATL, Geertz B, Reischmann-Düsener S, Osinska H, Prondzynski M, et al. Activation of autophagy ameliorates cardiomyopathy in Mybpc3-targeted knockin mice. Circ Heart Fail 2017; 10: e004140, doi:10.1161/circheartfailure.117.004140.
- 5.
Daniels BH, McComb RD, Mobley BC, Gultekin SH, Lee HS, Margeta M. LC3 and p62 as diagnostic markers of drug-induced autophagic vacuolar cardiomyopathy: A study of 3 cases. Am J Surg Pathol 2013; 37: 1014–1021, doi:10.1097/PAS.0b013e3182863fa8.
- 6.
Otsuka K, Terasaki F, Shimomura H, Tsukada B, Horii T, Isomura T, et al. Enhanced expression of the ubiquitin-proteasome system in the myocardium from patients with dilated cardiomyopathy referred for left ventriculoplasty: An immunohistochemical study with special reference to oxidative stress. Heart Vessels 2010; 25: 474–484, doi:10.1007/s00380-010-0006-3.
- 7.
Weekes J, Morrison K, Mullen A, Wait R, Barton P, Dunn MJ. Hyperubiquitination of proteins in dilated cardiomyopathy. Proteomics 2003; 3: 208–216, doi:10.1002/pmic.200390029.
- 8.
Ji XY, Zheng D, Ni R, Wang JX, Shao JQ, Vue Z, et al. Sustained over-expression of calpain-2 induces age-dependent dilated cardiomyopathy in mice through aberrant autophagy. Acta Pharmacol Sin 2022; 43: 2873–2884, doi:10.1038/s41401-022-00965-9.
- 9.
Corsetti G, Chen-Scarabelli C, Romano C, Pasini E, Dioguardi FS, Onorati F, et al. Autophagy and oncosis/necroptosis are enhanced in cardiomyocytes from heart failure patients. Med Sci Monit Basic Res 2019; 25: 33–44, doi:10.12659/msmbr.913436.
- 10.
Kanamori H, Yoshida A, Naruse G, Endo S, Minatoguchi S, Watanabe T, et al. Impact of autophagy on prognosis of patients with dilated cardiomyopathy. J Am Coll Cardiol 2022; 79: 789–801, doi:10.1016/j.jacc.2021.11.059.
- 11.
Kassiotis C, Ballal K, Wellnitz K, Vela D, Gong M, Salazar R, et al. Markers of autophagy are downregulated in failing human heart after mechanical unloading. Circulation 2009; 120(Suppl): S191–S197, doi:10.1161/circulationaha.108.842252.
- 12.
Caragnano A, Aleksova A, Bulfoni M, Cervellin C, Rolle IG, Veneziano C, et al. Autophagy and inflammasome activation in dilated cardiomyopathy. J Clin Med 2019; 8: 1519, doi:10.3390/jcm8101519.
- 13.
van der Klooster ZJ, Sepehrkhouy S, Dooijes D, Te Rijdt WP, Schuiringa F, Lingeman J, et al. P62-positive aggregates are homogenously distributed in the myocardium and associated with the type of mutation in genetic cardiomyopathy. J Cell Mol Med 2021; 25: 3160–3166, doi:10.1111/jcmm.16388.
- 14.
Berkamp S, Mostafavi S, Sachse C. Structure and function of p62/SQSTM1 in the emerging framework of phase separation. FEBS J 2021; 288: 6927–6941, doi:10.1111/febs.15672.
- 15.
Liu WJ, Ye L, Huang WF, Guo LJ, Xu ZG, Wu HL, et al. p62 links the autophagy pathway and the ubiqutin-proteasome system upon ubiquitinated protein degradation. Cell Mol Biol Lett 2016; 21: 29, doi:10.1186/s11658-016-0031-z.
- 16.
Komatsu M, Waguri S, Koike M, Sou YS, Ueno T, Hara T, et al. Homeostatic levels of p62 control cytoplasmic inclusion body formation in autophagy-deficient mice. Cell 2007; 131: 1149–1163, doi:10.1016/j.cell.2007.10.035.
- 17.
Schänzer A, Rupp S, Gräf S, Zengeler D, Jux C, Akintürk H, et al. Dysregulated autophagy in restrictive cardiomyopathy due to Pro209Leu mutation in BAG3. Mol Genet Metab 2018; 123: 388–399, doi:10.1016/j.ymgme.2018.01.001.
- 18.
Puissant A, Fenouille N, Auberger P. When autophagy meets cancer through p62/SQSTM1. Am J Cancer Res 2012; 2: 397–413.
- 19.
Collins GA, Goldberg AL. The logic of the 26S proteasome. Cell 2017; 169: 792–806, doi:10.1016/j.cell.2017.04.023.
- 20.
Thompson HG, Harris JW, Wold BJ, Lin F, Brody JP. p62 overexpression in breast tumors and regulation by prostate-derived Ets factor in breast cancer cells. Oncogene 2003; 22: 2322–2333, doi:10.1038/sj.onc.1206325.
- 21.
Zheng Q, Su H, Ranek MJ, Wang X. Autophagy and p62 in cardiac proteinopathy. Circ Res 2011; 109: 296–308, doi:10.1161/circresaha.111.244707.
- 22.
Miyamoto S. Autophagy and cardiac aging. Cell Death Differ 2019; 26: 653–664, doi:10.1038/s41418-019-0286-9.
- 23.
Kuramoto K, Kim YJ, Hong JH, He C. The autophagy protein Becn1 improves insulin sensitivity by promoting adiponectin secretion via exocyst binding. Cell Rep 2021; 35: 109184, doi:10.1016/j.celrep.2021.109184.
- 24.
Meng L, Zhou Z, Xu M, Yang S, Si K, Liu L, et al. Anomalous thickness dependence of Curie temperature in air-stable two-dimensional ferromagnetic 1T-CrTe2 grown by chemical vapor deposition. Nat Commun 2021; 12: 809, doi:10.1038/s41467-021-21072-z.
- 25.
Zhu H, Tannous P, Johnstone JL, Kong Y, Shelton JM, Richardson JA, et al. Cardiac autophagy is a maladaptive response to hemodynamic stress. J Clin Invest 2007; 117: 1782–1793, doi:10.1172/jci27523.
- 26.
Zhang XJ, Liu DM, Sun Y, Li YS, Ma LL, Kong XF, et al. Potential risk of hyperuricemia: Leading cardiomyocyte hypertrophy by inducing autophagy. Am J Transl Res 2020; 12: 1894–1903.
- 27.
Fidziańska A, Bilińska ZT, Walczak E, Witkowski A, Chojnowska L. Autophagy in transition from hypertrophic cardiomyopathy to heart failure. J Electron Microsc (Tokyo) 2010; 59: 181–183, doi:10.1093/jmicro/dfp048.
- 28.
Wang ZV, Rothermel BA, Hill JA. Autophagy in hypertensive heart disease. J Biol Chem 2010; 285: 8509–8514, doi:10.1074/jbc.R109.025023.
- 29.
Ma X, Lu C, Chen Y, Li S, Ma N, Tao X, et al. CCT2 is an aggrephagy receptor for clearance of solid protein aggregates. Cell 2022; 185: 1325–1345.e1322, doi:10.1016/j.cell.2022.03.005.
- 30.
Liu D, Wu H, Wang C, Li Y, Tian H, Siraj S, et al. STING directly activates autophagy to tune the innate immune response. Cell Death Differ 2019; 26: 1735–1749, doi:10.1038/s41418-018-0251-z.