Abstract
Background: We developed a convolutional neural network (CNN) model to detect atrial fibrillation (AF) using the sinus rhythm ECG (SR-ECG). However, the diagnostic performance of the CNN model based on different ECG leads remains unclear.
Methods and Results: In this retrospective analysis of a single-center, prospective cohort study, we identified 616 AF cases and 3,412 SR cases for the modeling dataset among new patients (n=19,170). The modeling dataset included SR-ECGs obtained within 31 days from AF-ECGs in AF cases and SR cases with follow-up ≥1,095 days. We evaluated the CNN model’s performance for AF detection using 8-lead (I, II, and V1–6), single-lead, and double-lead ECGs through 5-fold cross-validation. The CNN model achieved an area under the curve (AUC) of 0.872 (95% confidence interval (CI): 0.856–0.888) and an odds ratio of 15.24 (95% CI: 12.42–18.72) for AF detection using the eight-lead ECG. Among the single-lead and double-lead ECGs, the double-lead ECG using leads I and V1 yielded an AUC of 0.871 (95% CI: 0.856–0.886) with an odds ratio of 14.34 (95% CI: 11.64–17.67).
Conclusions: We assessed the performance of a CNN model for detecting AF using eight-lead, single-lead, and double-lead SR-ECGs. The model’s performance with a double-lead (I, V1) ECG was comparable to that of the 8-lead ECG, suggesting its potential as an alternative for AF screening using SR-ECG.
Atrial fibrillation (AF) is one of the most prevalent cardiac rhythm disorders and is associated with increased morbidity such as ischemic stroke, and mortality.1–3 A significant challenge in managing AF is its timely detection, given that it is asymptomatic nature in many patients. Various screening tools have been proposed as alternatives to the gold standard 12-lead ECG, including patient-initiated devices such as oscillometric blood pressure cuffs, intermittent ECG rhythm strips, or smartphone photoplethysmograms, as well as semi-continuous options such as smartwatch ECGs and continuous wearable devices such as long-term Holter monitors, wearable belts, or 1–2 week continuous ECG patches.4,5 Additionally, implanted devices have been used for continuous and repeated monitoring in patients with cryptogenic stroke, where the source of the blood clot is unknown, revealing a significant prevalence of undiagnosed AF.6,7
In practical terms, the development of simple methods to identify individuals at a high risk of AF would facilitate the selection of candidates for long-term monitoring devices. One such method involves the precise analysis of waveform patterns on the resting 12-lead ECG using artificial intelligence (AI), which has shown promise in identifying patients with AF on sinus rhythm ECG (SR-ECG).8 This approach is unique because, although the gold standard for diagnosing AF is the presence of AF on 12-lead ECG, AI-based methods can provide insight into the presence of AF even on ECGs where AF is not visually apparent. From the Mayo Clinic, Attia et al reported a landmark study using AI-enabled ECG analysis to predict AF on SR-ECG.8 Similarly, Raghunath et al reported on AI-enabled ECG analysis using a larger ECG database from the Geisinger Health System in the USA.9 Additionally, Gruwez et al in Belgium reported on AI-enabled ECG analysis.10 These studies have had a significant effect because of the high predictive ability, with an area under the curve (AUC) of approximately 0.9.
Recently, there have been advancements in both mobile and smartwatch ECG technologies incorporating AI.11,12 Mobile ECG systems offer a simpler and more accessible method of obtaining an ECG for individuals before visiting a clinical setting, and for physicians providing home-based medical care, both cases where obtaining a 12-lead ECG is not always feasible. These systems utilize fewer leads for recording the ECG, but in the context of AF screening in such circumstances, to date there have been no reports on AI-enabled ECG algorithms specifically designed to detect AF using single- or double-lead SR-ECG recordings.
We previously reported on a convolutional neural network (CNN) model for AF detection using SR-ECG,13 which achieved comparable AUC values to previous studies.8–10 In the present study, using the same dataset, we conducted an analysis to assess the lead-specific performance of the CNN model.
Methods
Ethics and Informed Consent
This study was performed in accordance with the Declaration of Helsinki (revised in 2013) and Ethical Guidelines for Medical and Health Research Involving Human Subjects (Public Notice of the Ministry of Education, Culture, Sports, Science and Technology, and the Ministry of Health, Labour and Welfare, Japan, issued in 2017). Written informed consent was given by all participants. The study protocol was reviewed and approved (IRB No. 424) by the Institutional Review Board of the Cardiovascular Institute.
Study Population
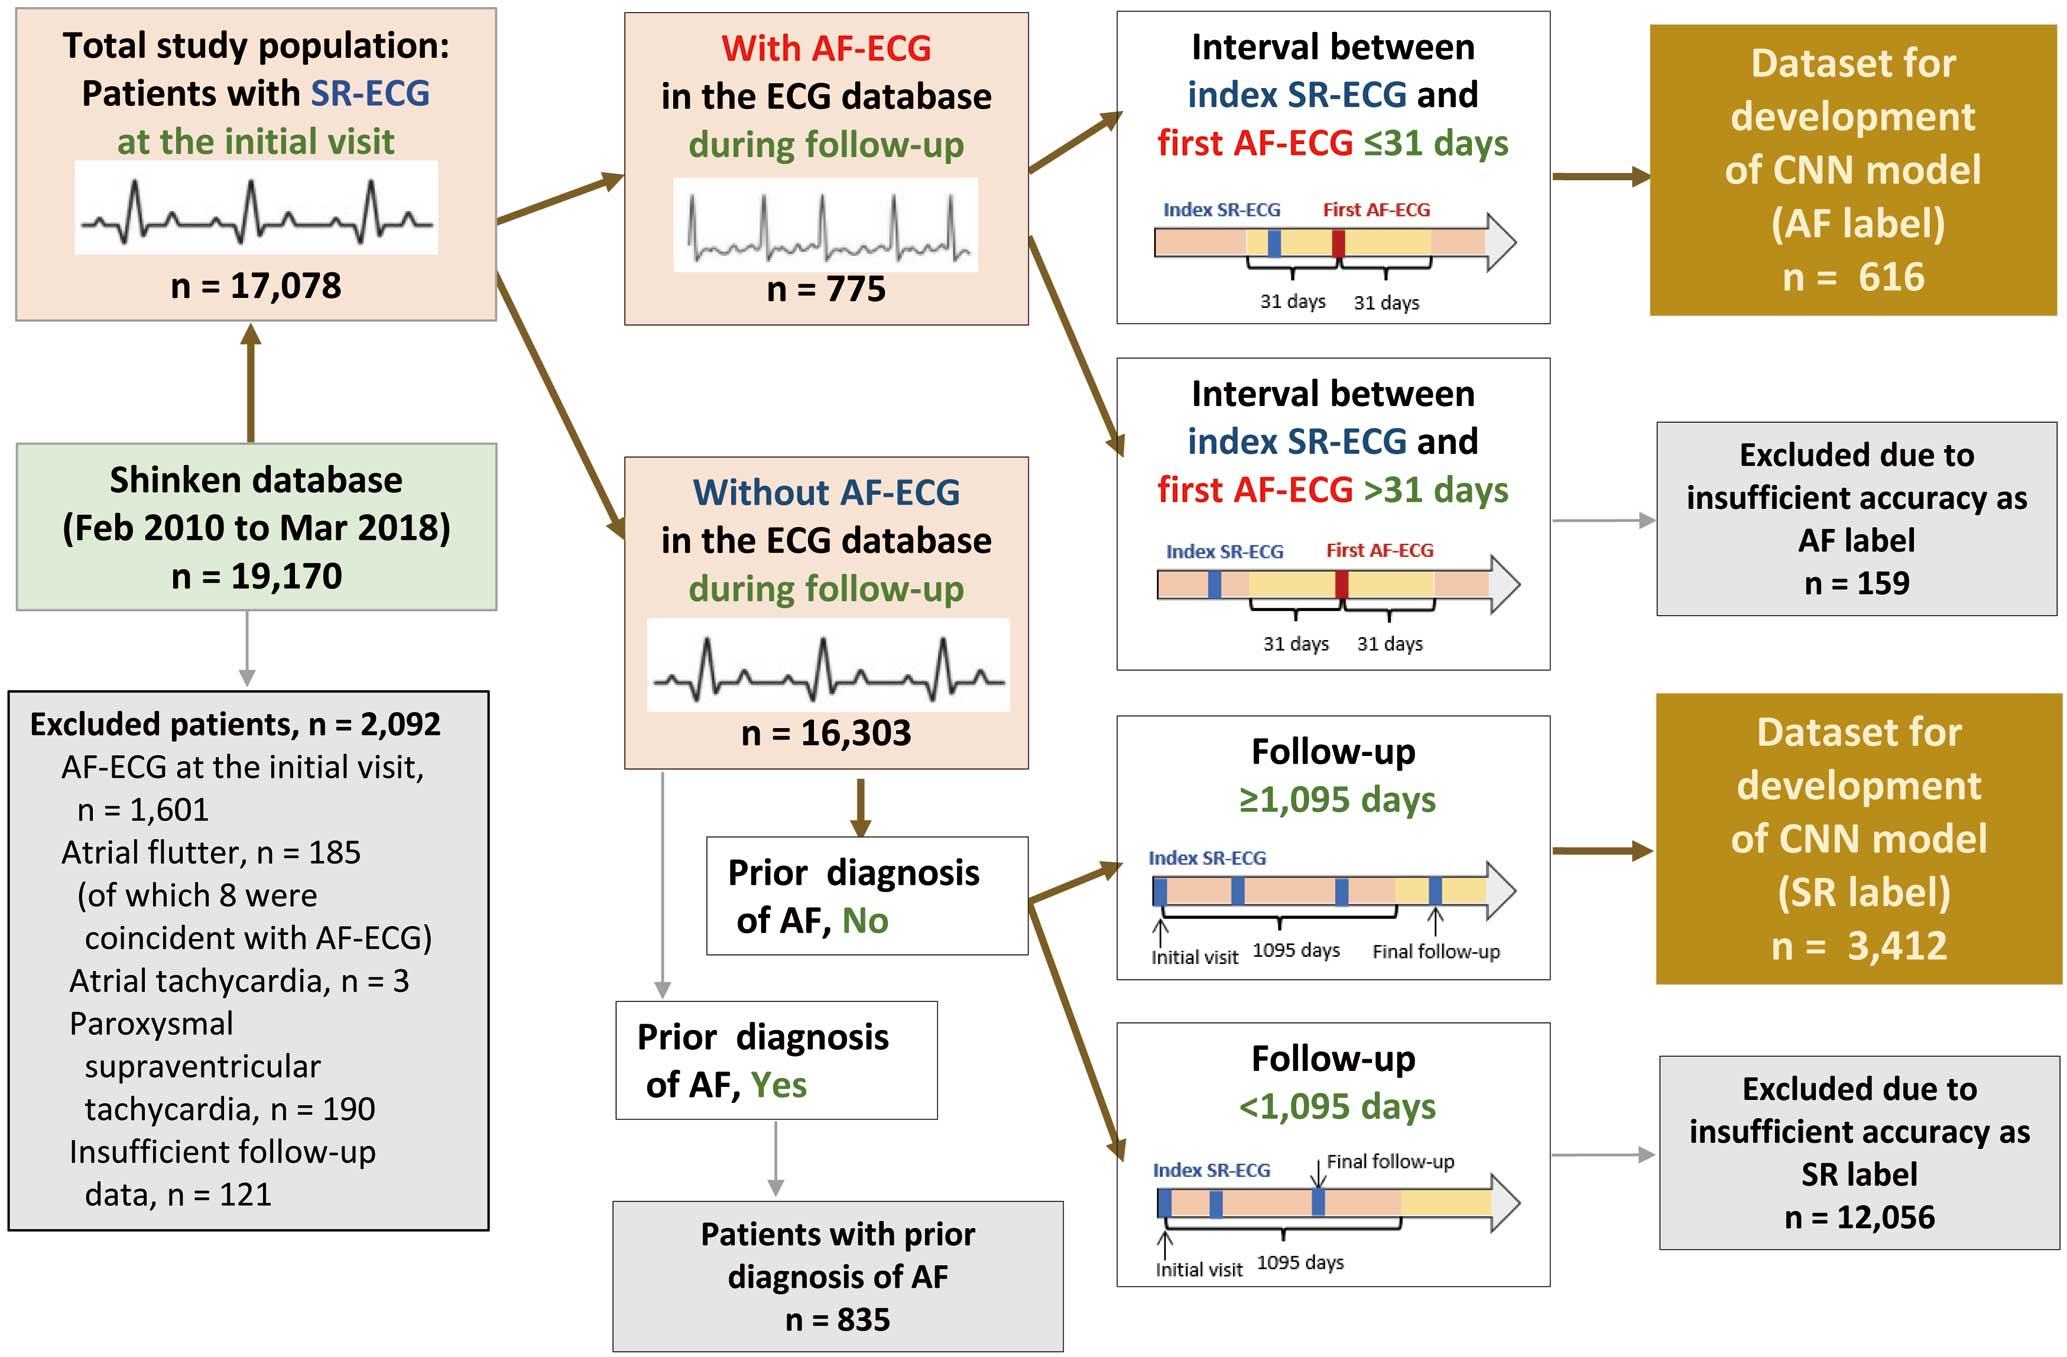
The Shinken database comprises all patients who newly visited the Cardiovascular Institute, Tokyo, Japan, excluding foreign travelers and patients with active cancer. This single-hospital database was established in June 2004, and further details have been described previously.13–15 For this study, we extracted data for 19,170 patients registered between February 2010 and March 2018, because a computerized ECG database has only been available since February 2010. We excluded 2,092 patients for at least 1 of the following reasons: presence of AF (n=1,601), atrial flutter (n=185; of which 8 were coincident with AF), atrial tachycardia (n=3), paroxysmal supraventricular tachycardia (n=190) on the initial-visit ECG, and insufficient follow-up data (n=121). The remaining dataset of 17,078 patients with a SR-ECG served as the main data source for CNN modeling in this study (Figure 1).
Development of the CNN Model
The 12-lead ECGs were recorded for 10 s while the patient was supine, using an ECG machine (MAC 5500 HD with GE CardioSoft V6.71; GE Healthcare, Chicago, IL, USA) at a sampling rate of 500 Hz. The raw digital records were stored using the MUSE data management system. From the total study population of 17,078 patients, we identified those with a SR-ECG who met the criteria for the “AF label” and “SR label” to develop the CNN models for AF detection.13 Subsequently, the CNN models for AF detection were constructed using the dataset of SR-ECGs.8,13
Selecting “AF Label” SR-ECGs Patients with SR-ECGs were included in the “AF label” group if they met both of the following criteria: (1) at least 1 AF-ECG recorded in the ECG database during follow-up, and (2) at least 1 SR-ECG within 31 days before or after the first AF-ECG. A total of 616 patients were selected, and their corresponding SR-ECGs were used for the “AF label” dataset (Figure 1). In the case of multiple SR-ECGs with AF labels being available for the same patient, the SR-ECG taken on the nearest day to the first AF-ECG was chosen.
Selecting “SR Label” SR-ECGs Patients with SR-ECGs were included in the “SR label” group if they met all of the following criteria: (1) no recorded AF-ECG in the ECG database during follow-up, (2) did not have a previous diagnosis of AF before the initial visit to hospital, and (3) an observation period ≥1,095 days. A total of 3,412 patients were selected, and their corresponding SR-ECGs were used for the “SR label” dataset (Figure 1). The SR-ECG taken at the initial visit was chosen for analysis.
Dataset Management Given the small number of positive cases (AF) in the present study, we used the 5-fold cross-validation method to enable all data to be included in the testing dataset.16 Management of the dataset with this validation method is shown in Supplementary Figure 1 and described briefly. First, the dataset was randomly divided into 5 groups, and then 1 of the 5 groups was set as the testing dataset, and the others as the training dataset in which 12.5% of the data were used as the internal-validation dataset. Finally, the model was run 5 times using different combinations of training and testing datasets. Accordingly, model output was obtained from 5 testing datasets of 5 different models, in which all data were included in the testing dataset.
CNN Modeling We constructed the CNN using the Keras Framework with a Tensorflow backend (Google, Mountain View, CA, USA) and Python. From the 12-lead ECG recordings with a 10-s duration, we selected 8 independent leads (leads I, II, and V1–6) for analysis.
The CNN modeling was based on the model developed by Attia et al.8,13 The conceptual architecture is shown in Figure 2, and the detailed architecture is shown in Supplementary Figure 2. The model comprised layers for both temporal and lead axes. The temporal axis layers consisted of a convolution part and a residual part. The convolution part included a convolution layer, a batch-normalization layer, a non-linear Rectified Linear Unit (ReLU) activation layer, and a maximum pooling layer. The residual part comprised 2 residual blocks based on the Residual Network (ResNet) and average pooling, which were repeated X times (X was determined to achieve optimal performance, as outlined below). The lead axis layers consisted of paired batch-normalization layers, non-linear ReLU activation layers, and convolutional layers. Thereafter, a second paired batch-normalization layer and a layer for non-linear ReLU activation were included. The configuration of the lead axis layers were designed in the context of multiple-lead ECG models. Therefore, when we applied this structure to models using a single-lead ECG only, a 1×1 convolution filter was applied in the lead axis convolution. Finally, the data passed through a dropout layer with global average pooling and were fed into the final output layer, activated by the softmax function, which generated the probability of AF.

The model was trained using the Keras software library on a computer with 128 GB RAM and a single Quadro P-2200 (NVIDIA) graphics processing unit. In the model training process, the Adam optimizer with categorical cross entropy as the loss function was used. The learning rate was set at 0.0001 and the maximum epochs was set at 500. Training was stopped if the loss did not decrease for 200 epochs in the internal-validation dataset, and the model with the lowest loss was selected. Considering the class imbalance between the positive and negative cases, we weighted the loss function n times higher for the positive class samples compared to the negative class samples, where n was determined based on the ratio of the number of negative to positive data in the training dataset (n=6).
Receiver operating characteristics (ROC) curves were generated, and the AUC was used to evaluate the performance of the CNN model in determining the presence or absence of AF using ECG data. By analyzing the ROC curve in the internal-validation dataset, we determined the number of repetitions (X) for the combination of the 2 residual blocks and average pooling described above. The probability threshold for classifying AF was determined as the point on the ROC curve closest to the (0,1) point17 in the internal-validation dataset for each of the 5 models in the 5-fold cross-validation method (thresholds are presented in Supplementary Table).
Outcome Measurement and Statistical Analysis
First, patient characteristics were summarized as mean±standard deviation [SD] for continuous variables and n (%) for categorical variables. Differences between the 2 groups were tested by unpaired t-tests for continuous variables and chi-squared tests for categorical variables. Second, the performance of the CNN models was assessed using 8-lead (I, II, V1–6), single-lead, and double-lead (I, II; I, V1 to I, V6; II, V1–II, V6) ECGs. The evaluation metrics included AUC, sensitivity, specificity, accuracy, and F1 score. The model performance data are presented as the mean (SD) of 5 model runs with 5-fold cross-validation. For AUC, 95% confidence intervals (CIs) were calculated considering 5-fold cross-validation.18 Third, the distribution of patients in the AF label and SR label groups, categorized by diagnostic probability levels determined by each CNN model, was described using the entire dataset. Fourth, odds ratios were calculated based on the CNN model’s diagnoses using 8-lead, single-lead, and double-lead ECGs. This calculation involved the ratio of true/false positives divided by the ratio of false/true negatives, utilizing the entire dataset. Fifth, the gradient-weighted class activation mapping (GradCAM) method was used for the multi-input models.19
The statistical analyses were performed using R version 4.0.3 (The R Foundation, Vienna, Austria) and SPSS version 28.0 (IBM Corp., Armonk, NY, USA).
Results
Patients’ Characteristics
The patients’ characteristics are presented in Table 1. The total dataset (n=4,028) included 616 AF-label and 3,412 SR-label patients. Among these, 404 (65.6%) and 2,125 (62.3%) were male in the AF-label and SR-label groups, respectively. The mean age was 67.0±12.4 years in the AF-label group and 61.4±13.2 years in the SR-label group (P<0.001). The mean left ventricular ejection fraction was 62.3±13.6% in the AF-label group and 65.5±10.7% in the SR-label group (P<0.001), and the respective mean left atrial diameters were 40.0±7.2 mm and 35.5±6.0 mm (P<0.001). The prevalence of congestive heart failure was 8.1% in the AF-label group and 2.0% in the SR-label group (P<0.001), and the respective prevalence of mitral regurgitation was 12.3% and 3.1% (P<0.001).
Table 1.
Patients’ Characteristics
| |
Total
(N=4,028) |
AF label
(N=616) |
SR label
(N=3,412) |
P value |
| Age, years |
62.2±13.3 |
67±12.4 |
61.4±13.2 |
<0.001 |
| Male, n (%) |
2,529 (62.8) |
404 (65.6) |
2,125 (62.3) |
0.123 |
| Height, cm |
162.8±9.6 |
162.7±10.1 |
162.8±9.5 |
0.346 |
| Weight, kg |
62.6±13.6 |
61.6±13.1 |
62.8±13.6 |
0.016 |
| BMI, kg/m2 |
23.5±3.9 |
23.1±3.6 |
23.5±3.9 |
0.005 |
| Systolic BP, mmHg |
131.2±20.1 |
130±20.6 |
131.4±20.0 |
0.077 |
| Diastolic BP, mmHg |
76.4±12.6 |
73.5±13.0 |
76.9±12.4 |
<0.001 |
| IVST, mm |
9.8±2.3 |
10.5±2.4 |
9.7±2.2 |
<0.001 |
| PWT, mm |
9.0±1.6 |
9.5±1.7 |
9.0±1.5 |
<0.001 |
| LVDd, mm |
46.8±6.4 |
48.7±8.1 |
46.4±6.0 |
<0.001 |
| LVDs, mm |
30.1±7.4 |
32.4±9.3 |
29.7±6.9 |
<0.001 |
| LVEF, % |
65.0±11.3 |
62.3±13.6 |
65.5±10.7 |
<0.001 |
| LAD, mm |
36.2±6.4 |
40.0±7.2 |
35.5±6.0 |
<0.001 |
| Congestive HF, n (%) (HF admission within 90 days) |
119 (3.0) |
50 (8.1) |
69 (2.0) |
<0.001 |
| HF with reduced EF, n (%) |
346 (8.6) |
89 (14.4) |
257 (7.5) |
<0.001 |
| Ischemic heart disease, n (%) (PCI within 90 days) |
888 (22.0) |
85 (13.8) |
803 (23.5) |
<0.001 |
| Asymptomatic ischemia, n (%) |
164 (4.1) |
24 (3.9) |
140 (4.1) |
0.911 |
| Old myocardial infarction, n (%) |
187 (4.6) |
26 (4.2) |
161 (4.7) |
0.677 |
| Acute coronary syndrome, n (%) |
308 (7.6) |
43 (7.0) |
265 (7.8) |
0.564 |
| Aortic stenosis, n (%) |
232 (5.8) |
87 (14.1) |
145 (4.2) |
<0.001 |
| Aortic regurgitation, n (%) |
153 (3.8) |
45 (7.3) |
108 (3.2) |
<0.001 |
| Mitral regurgitation, n (%) |
183 (4.5) |
76 (12.3) |
107 (3.1) |
<0.001 |
| Mitral stenosis, n (%) |
21 (0.5) |
12 (1.9) |
9 (0.3) |
<0.001 |
| Tricuspid regurgitation, n (%) |
58 (1.4) |
18 (2.9) |
40 (1.2) |
0.002 |
| Hypertrophic cardiomyopathy, n (%) |
54 (1.3) |
11 (1.8) |
43 (1.3) |
0.338 |
| Dilated cardiomyopathy, n (%) |
36 (0.9) |
6 (1.0) |
30 (0.9) |
0.815 |
| Dilated hypertrophic cardiomyopathy, n (%) |
6 (0.1) |
2 (0.3) |
4 (0.1) |
0.230 |
| Hypertensive cardiomyopathy, n (%) |
326 (8.1) |
84 (13.6) |
242 (7.1) |
<0.001 |
| Ischemic cardiomyopathy, n (%) |
99 (2.5) |
30 (4.9) |
69 (2.0) |
<0.001 |
| Aortic aneurysm, n (%) |
106 (2.6) |
26 (4.2) |
80 (2.3) |
0.012 |
| Aortic dissection, n (%) |
74 (1.8) |
33 (5.4) |
41 (1.2) |
<0.001 |
| Hypertension, n (%) |
2,396 (59.5) |
420 (68.2) |
1,976 (57.9) |
<0.001 |
| Diabetes, n (%) |
740 (18.4) |
150 (24.4) |
590 (17.3) |
<0.001 |
| Smoking history, n (%) |
1,791 (44.5) |
280 (45.5) |
1,511 (44.3) |
0.597 |
| Chronic kidney disease, n (%) |
905 (22.5) |
241 (39.1) |
664 (19.5) |
<0.001 |
Data are presented as the mean±standard deviation unless otherwise stated. AF, atrial fibrillation; BMI, body mass index; BP, blood pressure; HF, heart failure; IVST, intraventricular septum thickness; LAD, left atrial diameter; LVDd, left ventricular end-diastolic diameter; LVDs, left ventricular end-systolic diameter; LVEF, left ventricular ejection fraction; PCI, percutaneous coronary intervention; PWT, posterior left ventricular wall thickness; SR, sinus rhythm.
Evaluation of the Utility of the CNN Models to Detect AF
Basic Performance of the CNN Models The basic performance of the CNN models for detecting AF using 8-lead, single-lead, and double-lead ECGs is summarized in Table 2 (detailed information of the 5-model runs is shown in Supplementary Table). The AUC (95% CI) for the 8-lead ECG was 0.872 (0.856–0.888). The AUCs (95% CI) for single-lead ECGs were generally lower than that for the 8-lead ECG, but relatively higher for single-lead V1 (0.843 [0.826–0.860]) and V6 (0.845 [0.827–0.862]). The AUCs (95% CI) for double-lead ECGs were generally higher than for the single-lead ECGs, especially in combinations using lead I, and were highest for double-lead I, V1 (0.871 [0.856–0.886]).
Table 2.
Performance of the Convolutional Neural Network Model for Detecting Atrial Fibrillation on 8-Lead, Single-Lead, and Double-Lead Electrocardiograms
| Model pattern / Leads |
AUC (95% CI) |
Sensitivity |
Specificity |
F1 score |
Accuracy |
| All leads (8 leads) |
0.872 (0.856–0.888) |
0.760 |
0.828 |
0.565 |
0.818 |
| Single lead |
| I |
0.801 (0.781–0.820) |
0.703 |
0.739 |
0.447 |
0.733 |
| II |
0.806 (0.787–0.825) |
0.692 |
0.754 |
0.454 |
0.744 |
| V1 |
0.843 (0.826–0.860) |
0.736 |
0.792 |
0.512 |
0.783 |
| V2 |
0.815 (0.795–0.835) |
0.721 |
0.772 |
0.488 |
0.764 |
| V3 |
0.805 (0.785–0.825) |
0.703 |
0.757 |
0.461 |
0.749 |
| V4 |
0.757 (0.734–0.779) |
0.674 |
0.724 |
0.420 |
0.716 |
| V5 |
0.808 (0.788–0.827) |
0.732 |
0.739 |
0.463 |
0.738 |
| V6 |
0.845 (0.827–0.862) |
0.792 |
0.743 |
0.493 |
0.750 |
| Double leads |
| I, II |
0.862 (0.845–0.879) |
0.778 |
0.806 |
0.545 |
0.801 |
| I, V1 |
0.871 (0.856–0.886) |
0.782 |
0.800 |
0.543 |
0.797 |
| I, V2 |
0.863 (0.846–0.879) |
0.782 |
0.790 |
0.533 |
0.789 |
| I, V3 |
0.863 (0.847–0.880) |
0.784 |
0.797 |
0.542 |
0.795 |
| I, V4 |
0.862 (0.846–0.879) |
0.787 |
0.793 |
0.539 |
0.792 |
| I, V5 |
0.864 (0.848–0.880) |
0.787 |
0.783 |
0.528 |
0.784 |
| I, V6 |
0.865 (0.849–0.881) |
0.797 |
0.792 |
0.544 |
0.793 |
| II, V1 |
0.851 (0.834–0.868) |
0.750 |
0.790 |
0.519 |
0.784 |
| II, V2 |
0.860 (0.843–0.877) |
0.769 |
0.789 |
0.523 |
0.786 |
| II, V3 |
0.830 (0.811–0.849) |
0.726 |
0.800 |
0.513 |
0.788 |
| II, V4 |
0.824 (0.805–0.843) |
0.703 |
0.802 |
0.501 |
0.786 |
| II, V5 |
0.848 (0.830–0.865) |
0.778 |
0.782 |
0.521 |
0.782 |
| II, V6 |
0.857 (0.841–0.873) |
0.768 |
0.794 |
0.532 |
0.790 |
For each AUC, 95% CIs are calculated, taking into account the 5-fold cross-validation. AUC, area under the curve; CI, confidence interval; SD, standard deviation.
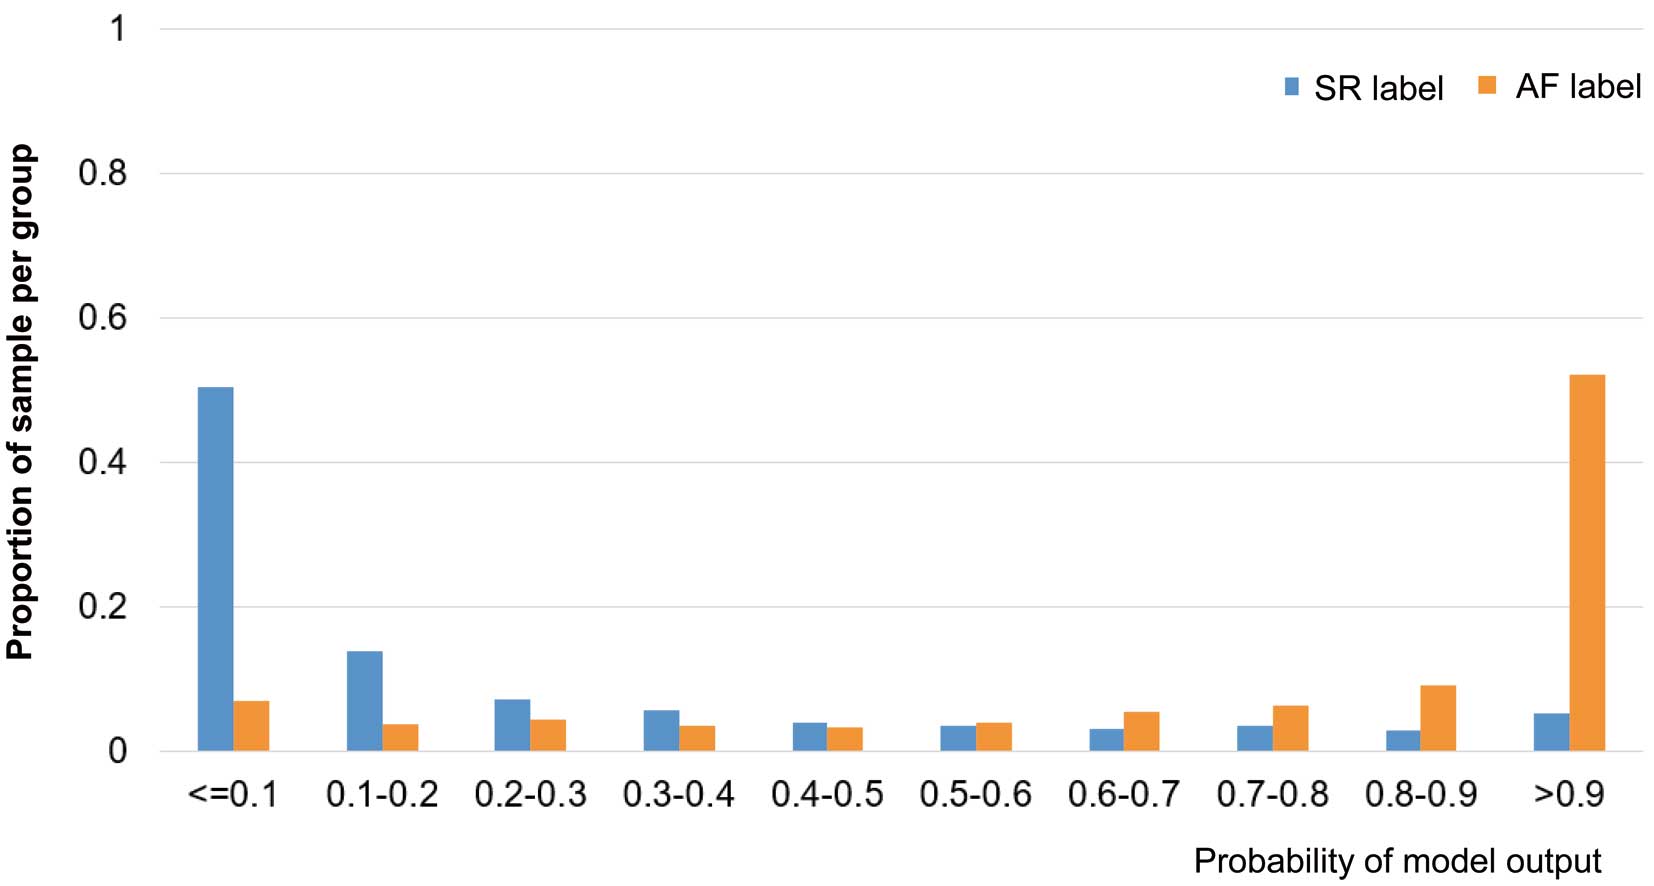
Distribution of Patients According to the CNN Model Outputs The distribution of patients in the CNN model outputs using the 8-lead ECG is shown in Figure 3. The proportion of patients in the AF-label group sharply increased with a high probability (model output >0.9), while the proportion of patients in the SR-label group sharply increased with a lower probability (model output <0.1).
The distribution of patients according to the CNN model outputs using single-lead and double-lead ECGs is shown in Supplementary Figure 3 and Supplementary Figure 4. In the models with single-lead ECGs, a sharp increase in the AF-label and SR-label patients in high and low probabilities, respectively, of the model output was observed in single-lead V1 and the double-leads I and II, which was similar to what was observed in the 8-lead ECG. Among the models with double-lead ECGs, a similar sharp increase was particularly observed when using lead I in the combination.
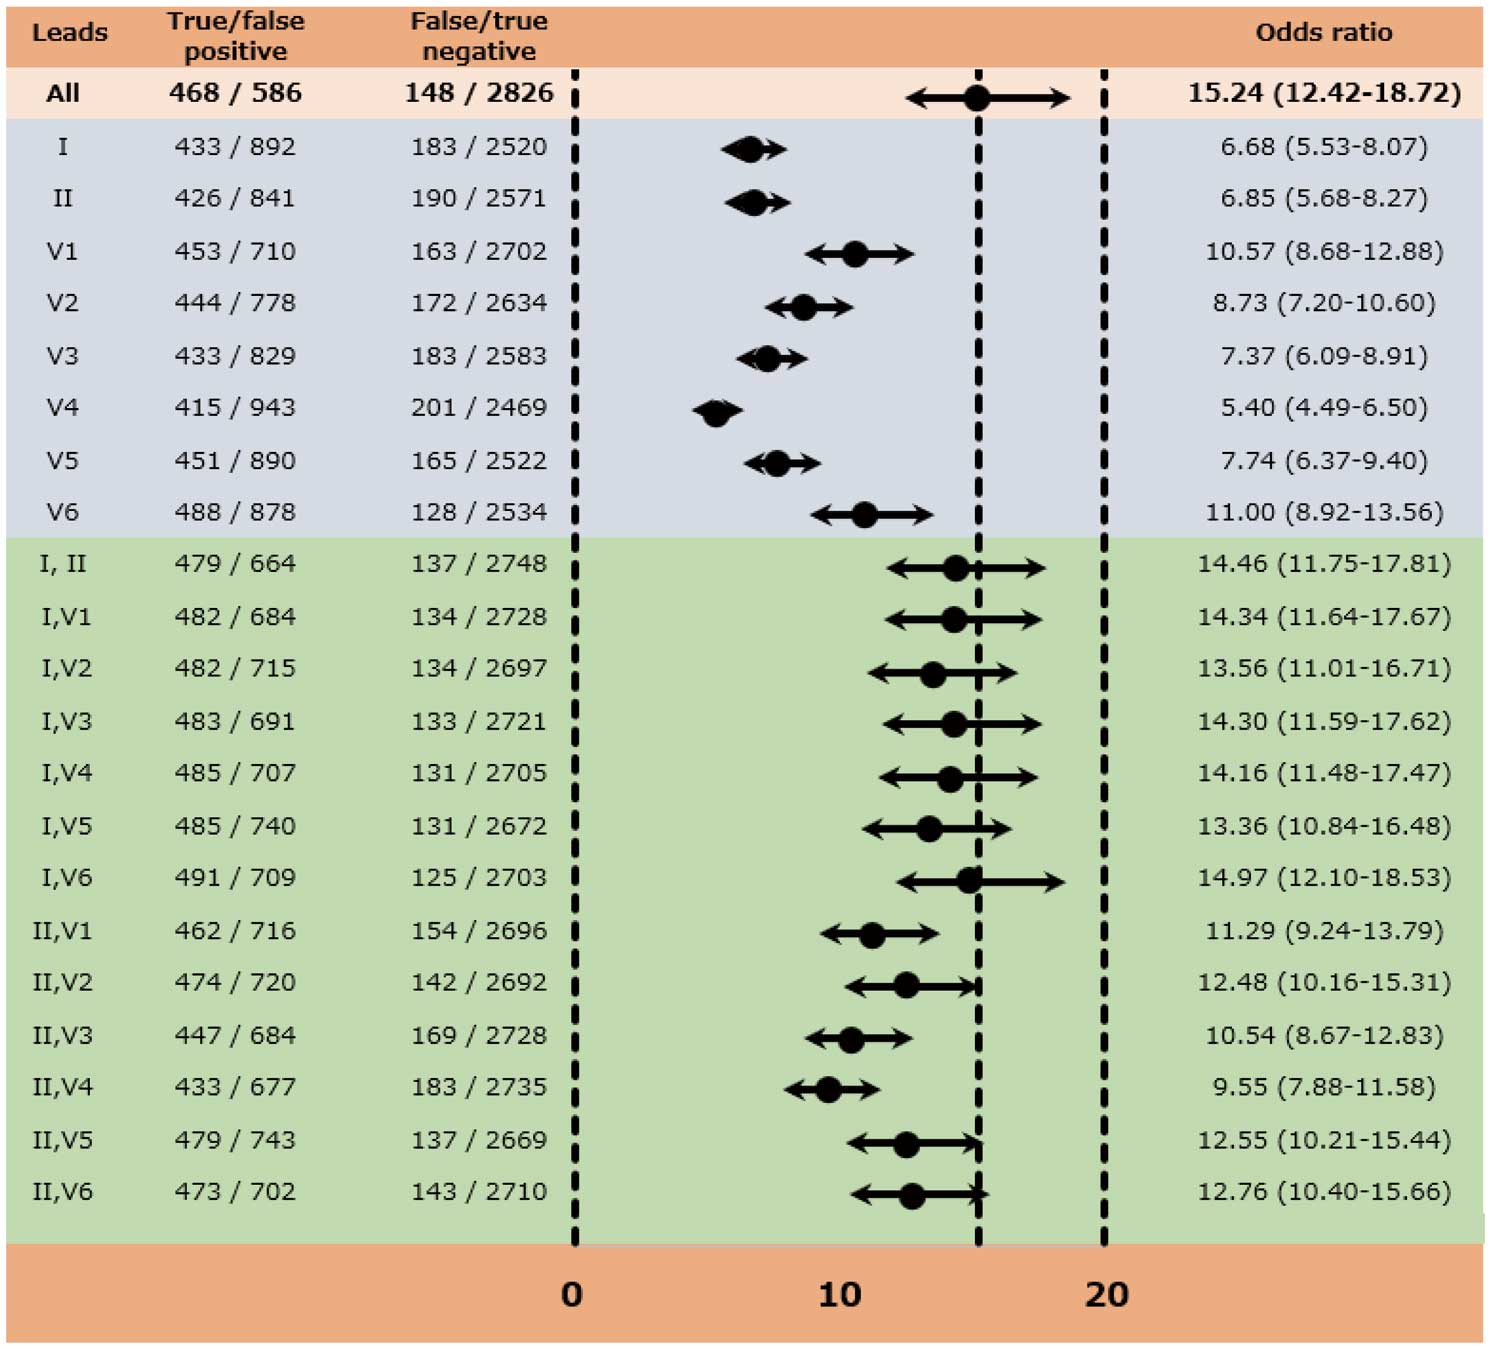
Odds Ratios Based on the Diagnosis of the CNN Models The odds ratio (95% CI) for the AF label, based on the diagnosis of the CNN model using the 8-lead ECG, was 15.24 (12.42–18.72) (Figure 4). Lower odds ratios were observed for the AF label in the CNN models using single-lead ECGs, whereas relatively higher odds ratios were observed in the model using double-lead ECGs, especially when using the combination with lead I. The odds ratio (95% CI) was 14.46 (11.75–17.81) for double-lead of I, II; 14.34 (11.64–17.67) for double-lead of I, V1; and 14.97 (12.10–18.53) for double-lead of I, V6, which were comparable to the 8-lead ECG (Figure 4).
GradCAM for the Diagnosis of AF in the CNN Models The GradCAM images corresponding to the 8-lead, single-lead and double-lead ECGs are displayed in Supplementary Figure 5, depicting the specific areas of focus identified by the CNN models in a patient with true positive results for the AF label. As shown in Supplementary Figure 5A, the GradCAM on the 8-lead ECG revealed that the CNN model placed strong emphasis on various segments in the I and II leads, as well as the P wave in the V1 lead, and the QRS and ST-T segments in the V6 lead. On the other hand, for both the single-lead and double-lead ECGs, the CNN models primarily focused on the P wave, with some attention given to the QRS and ST-T segments (Supplementary Figure 5B,C).
Discussion
Major Findings
We developed a CNN-derived algorithm using digital ECG to predict AF and there were 2 major findings for the performance of the model. (1) The AUC with the 8-lead ECG was 0.872 (95% CI: 0.856–0.888) and the odds ratio was 15.24 (95% CI: 12.42–18.72). (2) Among the single- and double-lead ECGs, the model performance was highest when using the double-leads of I and V1, with an AUC of 0.871 (95% CI: 0.856–0.886) and an odds ratio of 14.34 (95% CI: 11.64–17.67).
Comparison With Previous Studies
Using AI-enabled ECG to predict AF using the 12-lead SR-ECG has already been reported by other study groups,8–10,20 which found a high predictive ability for AF using the AUC: 0.90 in the study by Attia et al,11 and 0.87 in the studies by Raghunath et al9 and Gruwez et al.10 It is quite surprising that the SR-ECG can predict AF with such high predictive capability. In our previous study, in which we excluded patients with structural heart diseases, we obtained an AUC of 0.86,13 and in the present study without any exclusion criteria, we obtained an AUC of 0.872.
Although our model predicted AF using the SR-ECG, it showed relatively high sensitivity (0.760) and specificity (0.828). Moreover, the positive predictive ratio was 0.436 (= 468 / [468 + 586] in Figure 4), resulting in an F1 score of 0.565. Of course, the SR-ECG cannot provide an absolute diagnosis of AF. However, the diagnostic values of the CNN model would be satisfactory for determining possible candidates for further screening with long-term ambulatory ECG recordings.
Model Performance According to Differences in Lead Application
The models for predicting AF using the SR-ECG have been based on the hypothesis that the AF signature, resulting from structural changes in the atria, can be identified by 12-lead ECG during SR,8,21 because structural changes in the atria predispose to atrial arrhythmia.22 Furthermore, in our previous study that utilized hundreds of ECG parameters analyzed with a random forest algorithm, the importance of the ECG parameters in predicting AF was similar in the P wave, QRS complex, and ST-T segment.23 This suggests that structural changes in the ventricle, likely due to aging or atherosclerosis, may be also of importance, which gives rise to another hypothesis that the predictive ability of the CNN model may differ according to each single-lead ECG; however, no reports have addressed this issue. To the best of our knowledge, our study is the first to report lead-specific predictive ability of a CNN model for predicting AF using the SR-ECG.
In our CNN models, among the single-lead ECGs, the AUC was relatively high in leads V1 and V6, with AUCs of 0.843 and 0.845, respectively. Among the double-lead ECGs, the model’s performance was highest when using leads I and V1, achieving an AUC of 0.871 and an odds ratio of 14.34, followed by double-leads I and V6, with an AUC of 0.865 and an odds ratio of 14.97. It is widely acknowledged that structural changes in the atria are prominently detected in leads II and V1. Consequently, it is assumed that the CNN models placed strong emphasis on the P wave in leads II and V1, which was supported by the finding of the GradCAM analysis. Moreover, the GradCAM analysis indicated that the CNN models placed strong emphasis on the QRS and ST-T segments in lead V6, consistent with our previous findings in s machine-learning model analysis.23
However, it was an unexpected result that the model’s performance, in terms of both AUCs and odds ratios, was generally higher when using lead I than lead II in the double-lead ECGs. There are 2 reports that the amplitude of the P wave in lead I, rather than in lead II, is associated with progression of electrical remodeling in the left atrium.24,25 Park et al reported a significant correlation between the mean left atrial voltage measured before pulmonary vein isolation and the P wave amplitude in lead I (β=2.510, P=0.010), but not with that in lead II (β=0.714, P=0.250).24 Moreover, Schreiber et al reported that left atrial low voltage areas (as a percentage of the total left atrial area) were more associated with P-wave amplitude in lead I (R=−0.578, P<0.001) than in lead II (R=−0.450, P<0.001).25
Clinical Implications of the CNN Model and Future Perspective
Wearable devices, such as an Apple Watch, could potentially aid in detecting AF, but not everyone is using such devices. Moreover, they are not yet capable of providing continuous monitoring specifically for AF. Therefore, diagnosing early-phase AF still relies on long-term ECG monitoring. Determining which individuals are at high risk for AF and should undergo such examination remains a significant challenge.
The core concept of “AI-ECG on SR-ECG” arises from the question: “Who is at high risk for AF and should undergo long-term ECG monitoring?” The CNN models using SR-ECG, taking into account previous findings8–10,13 and those from the present study, could identify individuals at high risk of AF. It is noteworthy that the best performance for such screening was achieved with the all-lead ECG, available only in the clinical setting. Alternatively, fewer-lead ECGs could provide screening at home using a portable device. Additionally, in the hospital setting, a fewer-lead ECG is easier to record and can be particularly useful for patients who have difficulty undressing or moving to a bed. Given its ease of recording, it also could be valuable for mass screening or repeated checks.
Of note, our model demonstrated that the AUC for the double-lead ECG (I, V1) was comparable to that for the 8-lead ECG. The ECG with lead I is easy to record, albeit somewhat inconvenient. Strictly speaking, the V1 lead is not considered a “single lead” because it requires Wilson’s central terminal (determined by 3 potentials) as a reference potential. For clinical use with this double-lead ECG, adopting a specific lead that mimics V1 lead may be necessary, necessitating further studies.
Study Limitations
There are several to highlight. First, our CNN-derived model was constructed using only data from a single cardiovascular center in Japan. Given that the CNN models may detect subtle ECG morphologic changes to identify AF, the model may not be generalizable to other populations. Second, although we used data from 19,170 patients, the number of cases with AF (n=616) was relatively small, which may limit generalizability. Third, although we restricted SR-ECG recordings with the SR label to patients followed up for ≥1,095 days, there remains a possibility of undetected AF in patients with the SR label. Fourth, our AI-enabled ECG model should be validated against external datasets to confirm the generalizability. Finally, we could not completely understand how the model makes predictions.
Conclusions
We evaluated the performance of a CNN models for detecting AF using 8-lead, single-lead, and double-lead SR-ECGs. The performance of the model with a double-lead (I, V1) ECG was comparable to that of the 8-lead ECG, suggesting that an ECG with fewer leads can serve as an alternative for AF screening using SR-ECG.
Acknowledgments
We express our gratitude to Shiro Ueda and Nobuko Ueda from Medical Edge Company, Ltd., for their assistance in assembling the database using the Clinical Study Supporting System. Our thanks also go to Yurika Hashiguchi, Hiroaki Arai, and Takashi Osada for their dedicated work in data management and system administration. Additionally, we are grateful to Professor Hideki Origasa from the Data Science and AI Innovation Research Promotion Center at Shiga University, and Professor Satoshi Teramukai from the Department of Biostatistics at Kyoto Prefectural University of Medicine, for their invaluable advice on statistical analysis.
Funding
This study was partially supported by the Practical Research Project for Life-Style related Diseases including Cardiovascular Diseases and Diabetes Mellitus from the Japan Agency for Medical Research and Development, AMED (JP17ek0210082).
Disclosures
S.S. received lecture fees from Daiichi Sankyo and Bristol-Myers Squibb. T.Y. received research funds and/or lecture fees from Daiichi Sankyo, Bayer Yakuhin, Bristol-Myers Squibb, Pfizer, Nippon Boehringer Ingelheim, Eisai, Mitsubishi Tanabe Pharm, Ono Pharmaceutical, and Toa Eiyo. The remaining authors have nothing to disclose.
IRB Information
This study was approved by the Institutional Review Board of the Cardiovascular Institute (Reference number: 424).
Authors’ Contributions
S.S., J.M., and H.N. conceived the study concept and study design. W.M., T.T., and T. Umemoto analyzed the data. S.S., H.N., T.O., T.A., N.Y., and N.H. collected the data. S.S. and T. Umemoto drafted the manuscript. S.S., J.M., H.N., N.H., A.H., and K.S. checked the analyzed data. N.H., H.N., W.M., T.T., A.H., K.S., T.A., N.Y., M.K., H.S., H.K., S.M., Y.K., T.O., T.H., M.M., M.I., T. Uejima, Y.O., J.Y., and T.Y. checked the manuscript. All authors approved the final version of the manuscript.
Supplementary Files
Please find supplementary file(s);
https://doi.org/10.1253/circrep.CR-23-0068
References
- 1.
Okumura K, Tomita H, Nakai M, Kodani E, Akao M, Suzuki S, et al. A novel risk stratification system for ischemic stroke in Japanese patients with non-valvular atrial fibrillation. Circ J 2021; 85: 1254–1262.
- 2.
Yamauchi T, Okumura Y, Nagashima K, Watanabe R, Saito Y, Yokoyama K, et al. External validation of the HELT-E2S2 score in Japanese patients with nonvalvular atrial fibrillation: A pooled analysis of the RAFFINE and SAKURA registries. Circ J 2023; 87: 1777–1787.
- 3.
Yamashita T, Akao M, Atarashi H, Ikeda T, Koretsune Y, Okumura K, et al. Causes of death in elderly patients with non-valvular atrial fibrillation: Results from the ANAFIE registry. Circ J 2023; 87: 957–963.
- 4.
Hindricks G, Potpara T, Dagres N, Arbelo E, Bax JJ, Blomström-Lundqvist C, et al. 2020 ESC Guidelines for the diagnosis and management of atrial fibrillation developed in collaboration with the European Association for Cardio-Thoracic Surgery (EACTS): The Task Force for the diagnosis and management of atrial fibrillation of the European Society of Cardiology (ESC) Developed with the special contribution of the European Heart Rhythm Association (EHRA) of the ESC. Eur Heart J 2021; 42: 373–498.
- 5.
January CT, Wann LS, Calkins H, Chen LY, Cigarroa JE, Cleveland JC Jr, et al. 2019 AHA/ACC/HRS Focused Update of the 2014 AHA/ACC/HRS Guideline for the Management of Patients With Atrial Fibrillation: A Report of the American College of Cardiology/American Heart Association Task Force on Clinical Practice Guidelines and the Heart Rhythm Society in Collaboration With the Society of Thoracic Surgeons. Circulation 2019; 140: e125–e151.
- 6.
Sanna T, Diener HC, Passman RS, Di Lazzaro V, Bernstein RA, Morillo CA, et al. Cryptogenic stroke and underlying atrial fibrillation. N Engl J Med 2014; 370: 2478–2486.
- 7.
Gladstone DJ, Spring M, Dorian P, Panzov V, Thorpe KE, Hall J, et al. Atrial fibrillation in patients with cryptogenic stroke. N Engl J Med 2014; 370: 2467–2477.
- 8.
Attia ZI, Noseworthy PA, Lopez-Jimenez F, Asirvatham SJ, Deshmukh AJ, Gersh BJ, et al. An artificial intelligence-enabled ECG algorithm for the identification of patients with atrial fibrillation during sinus rhythm: A retrospective analysis of outcome prediction. Lancet 2019; 394: 861–867.
- 9.
Raghunath S, Pfeifer JM, Ulloa-Cerna AE, Nemani A, Carbonati T, Jing L, et al. Deep neural networks can predict new-onset atrial fibrillation from the 12-lead ECG and help identify those at risk of atrial fibrillation-related stroke. Circulation 2021; 143: 1287–1298.
- 10.
Gruwez H, Barthels M, Haemers P, Verbrugge FH, Dhont S, Meekers E, et al. Detecting paroxysmal atrial fibrillation from an electrocardiogram in sinus rhythm: External validation of the AI approach. JACC Clin Electrophysiol 2023; 9: 1771–1782.
- 11.
Attia ZI, Harmon DM, Behr ER, Friedman PA. Application of artificial intelligence to the electrocardiogram. Eur Heart J 2021; 42: 4717–4730.
- 12.
Siontis KC, Noseworthy PA, Attia ZI, Friedman PA. Artificial intelligence-enhanced electrocardiography in cardiovascular disease management. Nat Rev Cardiol 2021; 18: 465–478.
- 13.
Suzuki S, Motogi J, Nakai H, Matsuzawa W, Takayanagi T, Umemoto T, et al. Identifying patients with atrial fibrillation during sinus rhythm on ECG: Significance of the labeling in the artificial intelligence algorithm. Int J Cardiol Heart Vasc 2022; 38: 100954.
- 14.
Suzuki S, Yamashita T, Otsuka T, Sagara K, Uejima T, Oikawa Y, et al. Recent mortality of Japanese patients with atrial fibrillation in an urban city of Tokyo. J Cardiol 2011; 58: 116–123.
- 15.
Hirota N, Suzuki S, Arita T, Yagi N, Otsuka T, Yamashita T. Prediction of biological age and all-cause mortality by 12-lead electrocardiogram in patients without structural heart disease. BMC Geriatr 2021; 21: 460.
- 16.
Baecker L, Garcia-Dias R, Vieira S, Scarpazza C, Mechelli A. Machine learning for brain age prediction: Introduction to methods and clinical applications. EBioMedicine 2021; 72: 103600.
- 17.
Coffin M, Sukhatme S. Receiver operating characteristic studies and measurement errors. Biometrics 1997; 53: 823–837.
- 18.
LeDell E, Petersen M, van der Laan M. Computationally efficient confidence intervals for cross-validated area under the ROC curve estimates. Electron J Stat 2015; 9: 1583–1607.
- 19.
Selvaraju RR, Cogswell M, Das A, Vedantam R, Parikh D, Batra D. Grad-CAM: Visual explanations from deep networks via gradient-based localization. In: 2017 IEEE International Conference on Computer Vision (ICCV), Venice, Italy, 2017; 618–626.
- 20.
Christopoulos G, Graff-Radford J, Lopez CL, Yao X, Attia ZI, Rabinstein AA, et al. Artificial intelligence-electrocardiography to predict incident atrial fibrillation: A population-based study. Circ Arrhythm Electrophysiol 2020; 13: e009355.
- 21.
Hendriks JML, Fabritz L. AI can now identify atrial fibrillation through sinus rhythm. Lancet 2019; 394: 812–813.
- 22.
Kottkamp H. Human atrial fibrillation substrate: Towards a specific fibrotic atrial cardiomyopathy. Eur Heart J 2013; 34: 2731–2738.
- 23.
Hirota N, Suzuki S, Arita T, Yagi N, Otsuka T, Kishi M, et al. Prediction of current and new development of atrial fibrillation on electrocardiogram with sinus rhythm in patients without structural heart disease. Int J Cardiol 2020; 327: 93–99.
- 24.
Park JK, Park J, Uhm JS, Joung B, Lee MH, Pak HN. Low P-wave amplitude (<0.1 mV) in lead I is associated with displaced inter-atrial conduction and clinical recurrence of paroxysmal atrial fibrillation after radiofrequency catheter ablation. Europace 2016; 18: 384–391.
- 25.
Schreiber T, Kähler N, Tscholl V, Nagel P, Blaschke F, Landmesser U, et al. Correlation of P-wave properties with the size of left atrial low voltage areas in patients with atrial fibrillation. J Electrocardiol 2019; 56: 38–42.