Abstract
Background: Although the clinical factors that predict major bleeding in Western patients with acute coronary syndrome (ACS) are becoming elucidated, they have not been fully investigated, especially coronary lesion characteristics, in a Japanese population.
Methods and Results: ACS patients (n=1,840) were divided into a “bleeding group” and a “no-bleeding group,” according to whether they had major bleeding during the 2-year follow-up period, to investigate the prognostic effect of bleeding and the predictive factors of bleeding. Among them, patients who underwent primary percutaneous coronary intervention with optical coherence tomography (OCT) guidance (n=958) were examined to identify the effect of coronary lesion characteristics on bleeding. Of the 1,840 enrolled patients, 124 (6.7%) experienced major bleeding during the 2-year follow-up period. Incidence of cardiovascular death during the 2-year follow-up period was significantly higher among patients with major bleeding (26.4% vs. 8.5%, P=0.001). OCT examination showed that disrupted fibrous cap (DFC: 68% vs. 48%, P=0.014) and calcified plaque (63% vs. 42%, P=0.011) were more prevalent in the bleeding group. DFC was a predictor of major bleeding in the multivariate Cox proportional hazards analyses (hazard ratio 2.135 [95% confidence interval 1.070–4.263], P<0.001).
Conclusions: ACS patients with major bleeding had poorer cardiac outcomes. Advanced atherosclerosis at the culprit lesion influences the higher incidence of major bleeding in ACS patients.
Primary percutaneous coronary intervention (PCI) has improved the prognosis of acute coronary syndrome (ACS), but even though stent restenosis and thrombosis have decreased with the development of new-generation drug-eluting stents and the establishment of dual antiplatelet therapy, bleeding in patients with PCI is still a serious prognostic issue. East Asians are known to be at high risk for bleeding (HBR).1 The Academic Research Consortium (ARC) published a consensus document for evaluating bleeding risk by combining several bleeding risk assessment indices that have been reported.2 Clinical factors that predict major bleeding in Western patients with ischemic heart disease are becoming elucidated, but those in East Asian populations, especially coronary lesion characteristics, have not been fully investigated. Optical coherence tomography (OCT) is a high-resolution imaging technique that is useful for intravascular examination of the underlying plaque morphology of ACS culprit lesions.3,4 Because we considered that OCT findings would help to reveal the association between bleeding risk and the development of the atherosclerosis in patients with ACS, we performed the current study with the aims of (1) exploring the effect of bleeding incidence on ACS clinical outcomes in a Japanese population and (2) identifying the clinical and coronary lesional characteristics in Japanese patients with ACS who experienced major bleeding.
Methods
A total of 1,840 patients with ACS who were transferred to the emergency department at Nippon Medical School Chiba Hokusoh Hospital between July 2008 and October 2018 were enrolled in the current study as an “all-ACS cohort”. The patients were followed for 2 years after onset of ACS and were divided into a “bleeding group” and a “no-bleeding group” according to whether they experienced a major bleeding event during the follow-up period. Major bleeding was defined as Bleeding Academic Research Consortium (BARC) types 3 and 5.2 Similar to the exclusion of BARC type 4 bleeding (i.e., bleeding related to coronary artery bypass grafting [CABG]) from the criteria of major bleeding in our current study, bleeding related to venoarterial extracorporeal membrane oxygenation (VA-ECMO) use (i.e., intracranial hemorrhage, insertion site bleeding of venous drainage and arterial return cannulas, and red blood cell transfusion during VA-ECMO use) was excluded from major bleeding. An ACS diagnosis required ≥2 of the following criteria: (1) cardiac ischemia symptoms, such as prolonged chest pain (≥20 min); (2) new or presumed new significant ST-segment-T wave changes or a new left bundle branch block on ECG; and (3) elevated cardiac troponin T level. ACS patients with elevated cardiac troponin T (>99th percentile upper reference limit) on arrival or elevated peak creatine kinase-MB (>twice the local laboratory upper limit of normal) were diagnosed with myocardial infarction (MI). ST-segment elevation and non-ST-segment elevation MI were defined as MI with and without new (or presumably new) ST-segment elevation (≥0.1 mV) in ≥2 contiguous leads on ECG, respectively. ACS without elevated cardiac troponin T upon admission or peak creatine kinase-MB were diagnosed as unstable angina. Peripheral blood samples were obtained upon admission. To evaluate peak creatine kinase-MB values, blood samples were obtained serially every 6 h after admission until the creatine kinase-MB values began to decline. Baseline characteristics, clinical presentation (including Killip class), laboratory data, revascularization strategy (primary PCI, CABG, or none), and medical treatment at discharge were compared among groups. This study was conducted in compliance with the Declaration of Helsinki for investigations in human subjects and approved by the Ethics Committee of Nippon Medical School Chiba Hokusoh Hospital.
Angiographic analyses were performed for 1,580 patients who underwent primary PCI with analyzable angiographic images before and after PCI (Figure 1). Culprit lesions were identified based on coronary angiography, ECG, and echocardiography. Qualitative and quantitative coronary angiography analyses were performed for variables such as lesion location and length, pre- and post-intervention minimal lumen diameter, percent diameter stenosis, reference vessel diameter, and Thrombolysis in Myocardial Infarction (TIMI) flow grade.
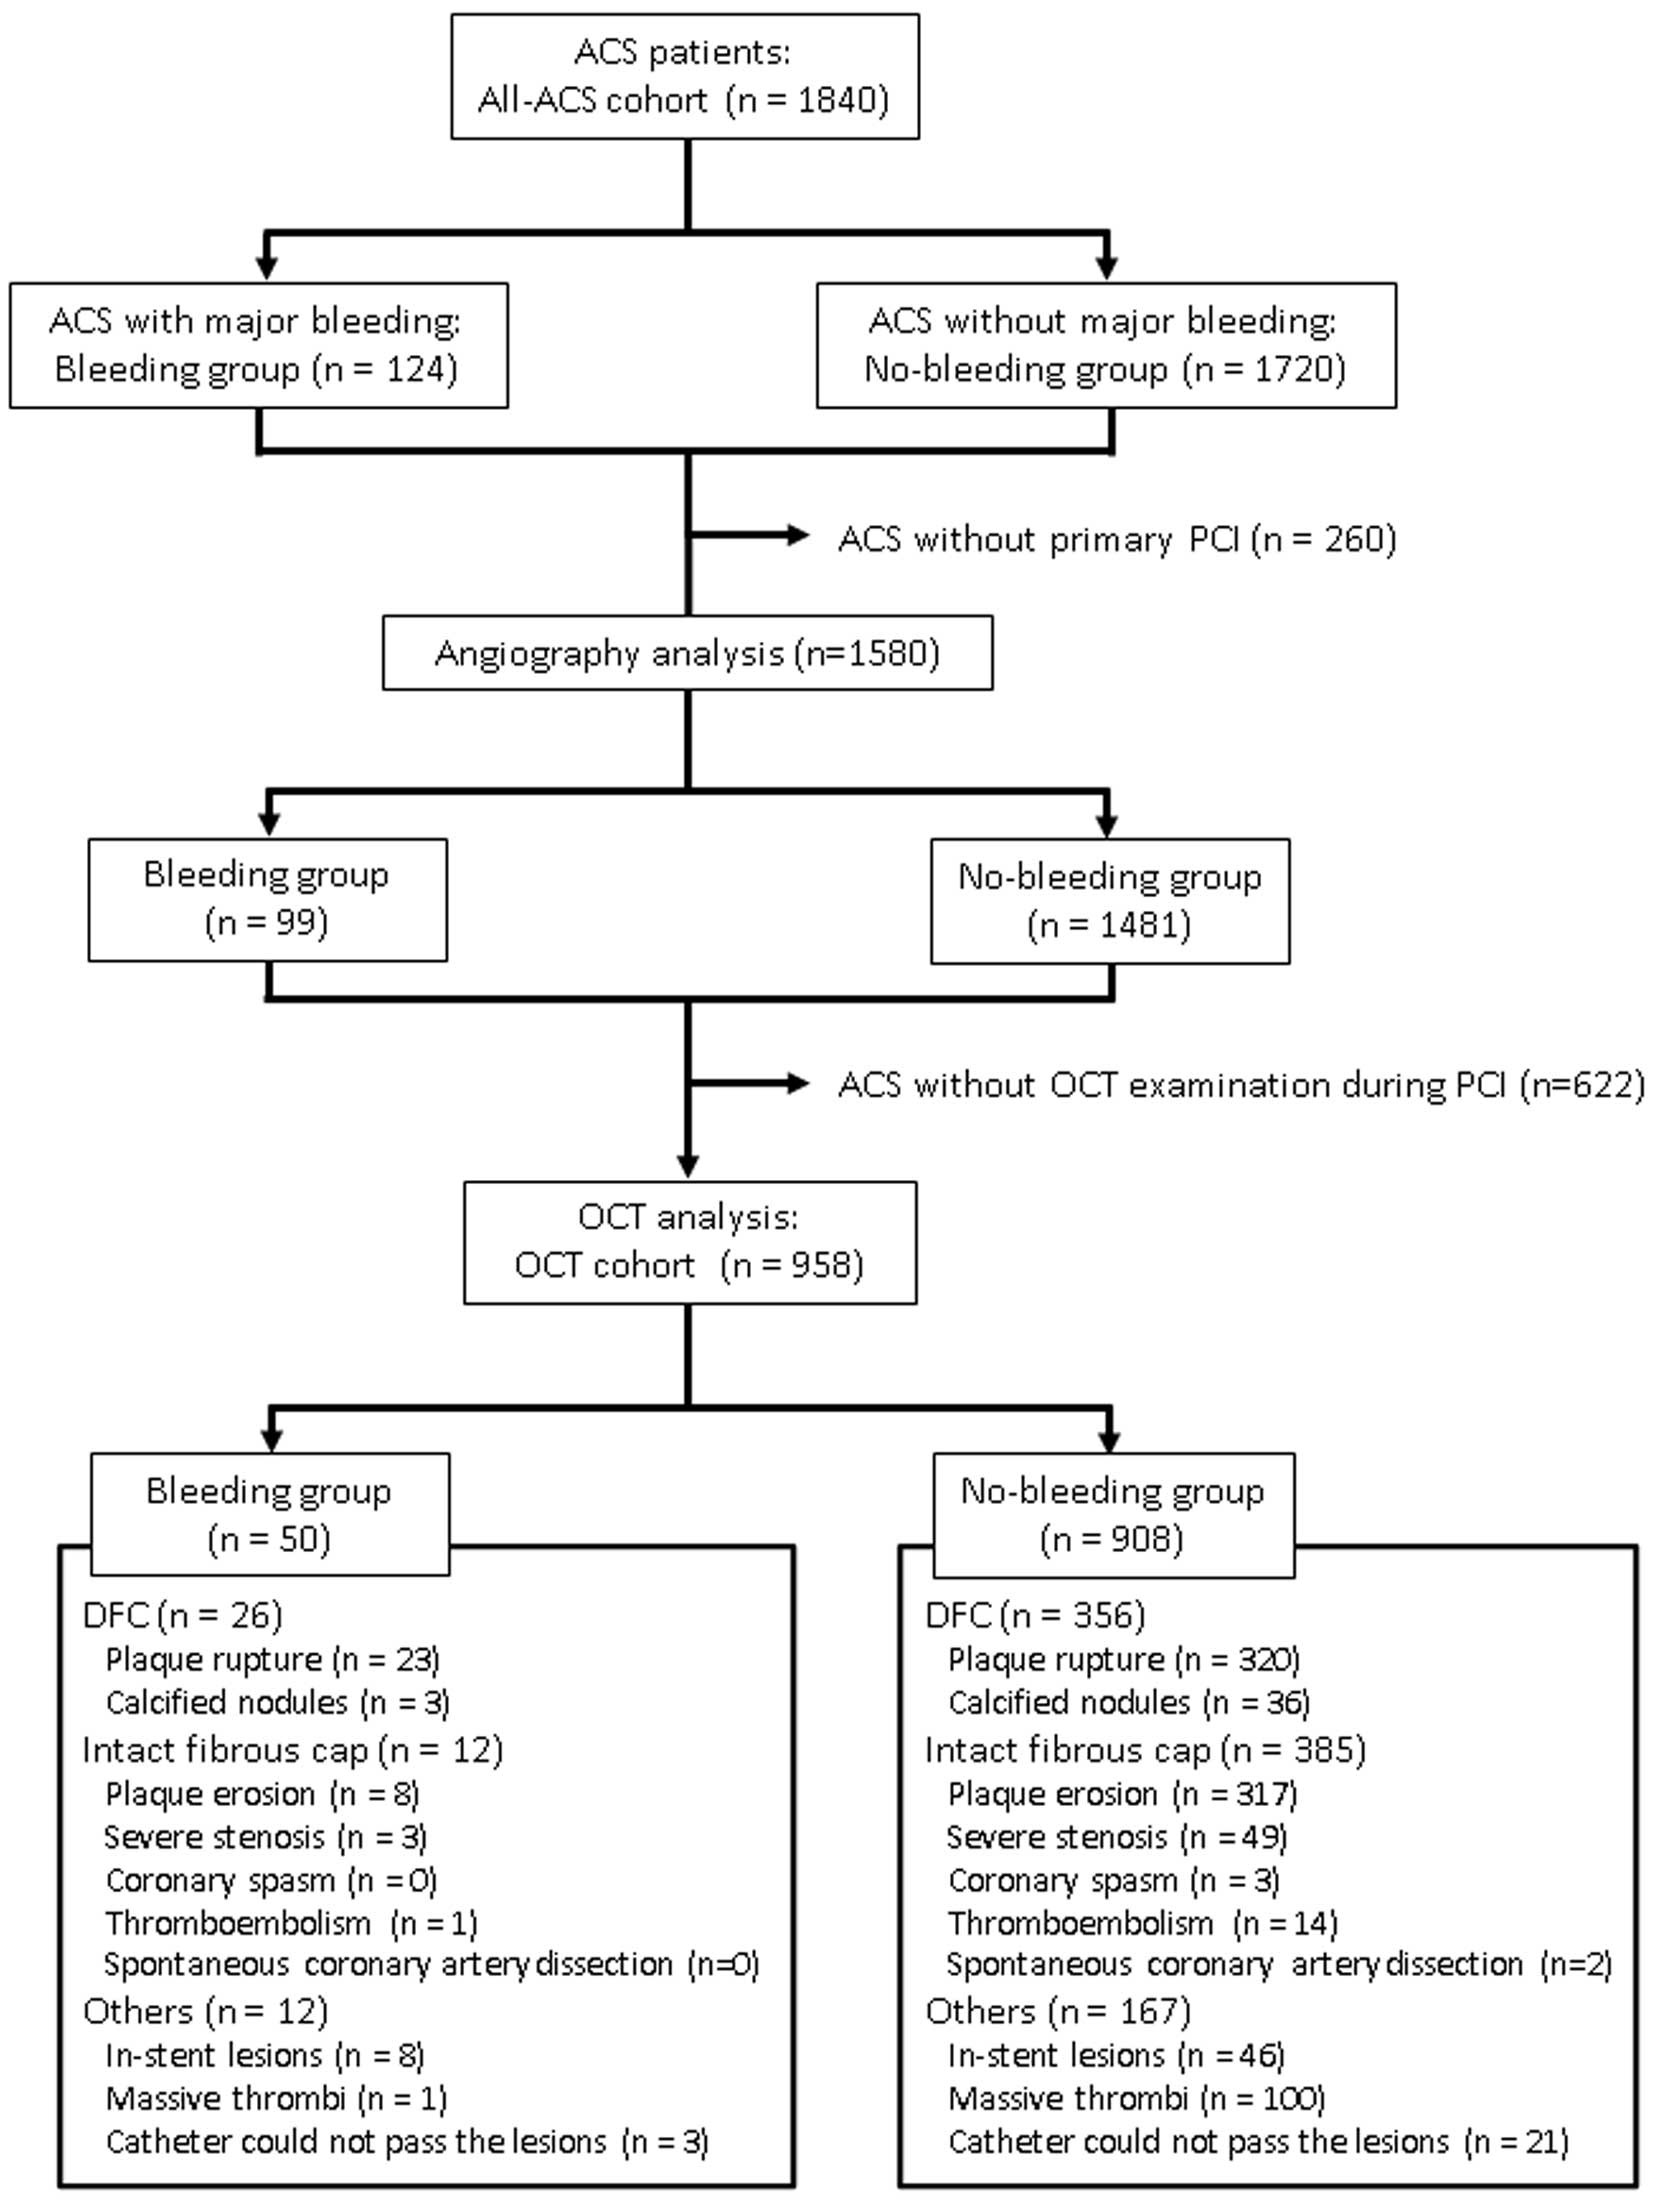
We performed primary PCI with OCT guidance in 838 patients (Figure 1). The OCT examination was performed at operator discretion. In cases of patients with a TIMI grade <2 for initial coronary angiography, intracoronary thrombectomy was performed prior to the OCT examination. OCT imaging of the culprit lesion was acquired using either a commercially available time-domain OCT (Model M3 Cardiology Imaging System, St. Jude Medical, Westford, MA, USA) or a frequency-domain OCT (Abbott Vascular, Santa Clara, CA, USA) after administering intracoronary nitroglycerin. The OCT image acquisition procedures have been reported previously.5,6 All OCT images were analyzed offline and classified following agreement between 2 independent cardiologists (who were blinded to the clinical presentation) based on previously established criteria.7,8
The morphology of the culprit lesion plaques was classified as disrupted fibrous cap (DFC) or intact fibrous cap (IFC), according to previously published criteria.9 DFC included plaque rupture and calcified nodules; IFC included plaque erosion and other lesion morphology such as severe stenosis, coronary vasospasm, spontaneous coronary artery dissection, and thromboembolism. Although spontaneous coronary artery dissection is morphologically classified as DFC based on the discontinuity of the fibrous cap, it was classified in this study as IFC from the viewpoint of atherosclerosis. In-stent restenosis lesions, bypass graft failure, and lesions not evaluable due to large amounts of residual thrombus were excluded from the current analysis. The definitions of plaque rupture, plaque erosion and calcified nodules were based on previously published literature.10 ACS patients with DFC or IFC at the culprit lesions were enrolled as the “OCT cohort” and further quantitative and qualitative OCT analyses were performed. Slices with the minimum lumen cross-sectional area (CSA) on post-thrombectomy and post-stenting OCT images were identified and assessed. From each stent edge, 5-mm proximal and distal segments preceding a significant side branch (>1.5 mm in diameter) were defined as the reference segments, and the slices with the smallest lumen CSA within each reference segment were identified. The type of underlying atherosclerotic plaque tissue was classified based on the OCT signal as fibrous, lipidic, or calcific. Masses with a diameter >250 μm and either attached to the luminal surface or floating within the lumen were defined as intracoronary thrombi, and classified as red or white thrombi. Definitions to classify culprit lesion morphology (rupture, erosion, calcified nodule or other), plaque characterization (lipidic, fibrous or calcified) and thrombi type (red or white) are described in our previous report.5
Clinical follow-up was performed for 2 years. The primary endpoint was defined as cardiac death (i.e., death from MI, heart failure, cardiac perforation, pericardial tamponade, arrhythmia, procedural complication, or any death for which a cardiac cause could not be ruled out). Secondary endpoints were ischemic stroke and rehospitalization for severe heart failure (defined as New York Heart Association class III or IV) and ACS during the 2-year follow-up period.
Statistical Analysis
Categorical variables are expressed as percentages and counts and were compared using chi-squared statistics or Fisher’s exact test where appropriate. Continuous variables are presented as median and interquartile range and were compared using the nonparametric Mann-Whitney U test. Time-to-event outcomes, including cardiac death, ischemic stroke, and rehospitalization for heart failure and ACS, were summarized as Kaplan-Meier estimates of cumulative incidence and compared between groups using a log-rank test. Cox proportional hazards regression models were conducted for the all-ACS cohort and the OCT cohort to determine predictors of cardiac death and major bleeding at 2 years while simultaneously controlling for potential confounders. Variables included in these models were initially selected based on data previously reported as predictors of major bleeding.1,11,12 Statistical analyses were conducted using the SPSS software package, version 22.0, with a P value <0.05 considered statistically significant.
Results
Of the 1,840 enrolled patients, 124 (6.7%) experienced a major bleeding event during the 2-year follow-up period (Figure 1). Comparison of the baseline characteristics between the bleeding and no-bleeding groups is shown in Table 1. Patients in the bleeding group were more likely to be female, older, underweight, and had lower hemoglobin and eGFR levels. Table 2 shows that patients with major bleeding had more frequently undergone primary PCI with transfemoral approach (59% vs. 39%, P<0.001).
Table 1.
Comparison of Patients’ Baseline Clinical Characteristics
| |
Bleeding group
(n=124) |
No-bleeding group
(n=1,716) |
P value |
| Female |
42/124 (34%) |
323/1,716 (19%) |
<0.001 |
| Age, years |
73 (65, 80) |
67 (59, 75) |
<0.001 |
| Diabetes mellitus |
52/124 (42%) |
651/1,713 (38%) |
0.757 |
| Hypertension |
88/124 (71%) |
1,171/1,721 (68%) |
0.552 |
| Dyslipidemia |
65/124 (52%) |
1,023/1,712 (60%) |
0.108 |
| Body height, cm |
162 (153, 168) |
165 (159, 170) |
<0.001 |
| Body weight, kg |
60 (49, 70) |
65 (56, 73) |
<0.001 |
| Body mass index, kg/m2 |
22.8 (20.4, 25.5) |
24.0 (21.7, 26.4) |
<0.001 |
| Previous medical history |
| MI |
25/124 (20%) |
203/1,713 (12%) |
0.007 |
| Peripheral artery disease |
6/123 (5%) |
56/1,712 (3%) |
0.303 |
| Atrial fibrillation |
14/123 (11%) |
114/1,712 (7%) |
0.047 |
| Cerebral infarction |
9/123 (7%) |
77/1,712 (4%) |
0.179 |
| Carcinoma |
6/123 (5%) |
67/1,712 (4%) |
0.629 |
| Liver disease |
5/123 (4%) |
20/1,712 (1%) |
0.026 |
| Family history of MI |
17/124 (14%) |
350/1,710 (20%) |
0.070 |
| Systolic blood pressure, mmHg |
120 (99, 150) |
138 (117, 157) |
<0.001 |
| Diastolic blood pressure, mmHg |
69 (56, 83) |
80 (64, 90) |
<0.001 |
| Heart rate, /min |
82 (65, 101) |
77 (64, 90) |
<0.001 |
| ECG findings |
| ST-segment elevation |
72 (58%) |
1,082 (63%) |
0.267 |
| Non-ST-segment elevation |
52 (42%) |
634 (37%) |
|
| ACS type |
| MI |
117 (7%) |
1,597 (93%) |
0.714 |
| Unstable angina pectoris |
7 (6%) |
119 (7%) |
|
| Killip class |
| I |
63 (51%) |
1,353 (79%) |
<0.001 |
| II, III, IV |
61 (49%) |
363 (21%) |
|
| Time from ACS onset to admission, min |
240 (70, 588) |
227 (90, 810) |
0.563 |
| Laboratory data |
| White blood cell, /μL |
9,090 (7,578, 11,520) |
9,070 (7,068, 11,470) |
0.937 |
| Hemoglobin, g/dL |
11.5 (9.9, 13.7) |
14.1 (12.7, 15.3) |
<0.001 |
| Platelet, ×104/μL |
19.1 (15.5, 24.0) |
20.1 (17.2, 24.5) |
0.029 |
| Creatinine, mg/dL |
1.10 (0.81, 1.58) |
0.84 (0.69, 1.06) |
<0.001 |
| eGFR, mL/min/1.73 m2 |
44.8 (30.1, 67.8) |
67.7 (52.6, 83.5) |
<0.001 |
| Blood glucose, mg/dL |
161 (126, 266) |
153 (121, 210) |
0.013 |
| Hemoglobin A1c, % |
5.9 (5.4, 6.7) |
5.9 (5.6, 6.7) |
0.200 |
| Non-HDL-C, mg/dL |
129 (99, 153) |
138 (113, 169) |
0.001 |
| HDL-C, mg/dL |
41 (35, 51) |
45 (37, 54) |
0.009 |
| Triglyceride, mg/dL |
97 (67, 149) |
108 (68, 166) |
0.282 |
| C-reactive protein, mg/dL |
0.18 (0.07, 1.25) |
0.16 (0.03, 0.52) |
0.087 |
| B-type natriuretic peptide, pg/mL |
265 (73, 528) |
70 (26, 206) |
<0.001 |
| High-sensitivity cardiac troponin T, ng/mL |
0.161 (0.048, 1.110) |
0.128 (0.032, 0.580) |
0.034 |
| Creatine kinase-MB on admission, U/L |
20 (12, 52) |
16 (11, 35) |
0.007 |
Values are shown as median (interquartile range) or n (%). ACS, acute coronary syndrome; eGFR, estimated glomerular filtration rate; HDL-C, high-density lipoprotein cholesterol; MI, myocardial infarction.
Table 2.
Therapeutic Strategies for the Bleeding and No-Bleeding Groups
| |
Bleeding group |
No-bleeding group |
P value |
| Revascularization therapy |
(n=124) |
(n=1,716) |
|
| Primary PCI |
99 (80%) |
1,481 (86%) |
0.003 |
| Staged PCI |
9 (7%) |
36 (2%) |
|
| CABG |
6 (5%) |
57 (3%) |
|
| No revascularization therapy |
10 (8%) |
142 (8%) |
|
| Approach site at the time of primary PCI |
(n=99) |
(n=1,481) |
|
| Transfemoral |
58 (59%) |
581 (39%) |
<0.001 |
| Transradial or transbrachial |
41 (41%) |
900 (61%) |
|
| Medical treatment at discharge |
(n=100) |
(n=1,599) |
|
| Aspirin |
76 (76%) |
1,484 (93%) |
<0.001 |
| P2Y12 receptor inhibitor |
78 (78%) |
1,389 (87%) |
0.012 |
| Cilostazol |
3 (3%) |
16 (1%) |
0.097 |
| Single antiplatelet therapy |
25 (25%) |
149 (9%) |
<0.001 |
| Dual antiplatelet therapy |
66 (66%) |
1,368 (86%) |
<0.001 |
| Oral anticoagulant |
16 (16%) |
160 (10%) |
0.056 |
| Oral anticoagulant+antiplatelet |
14 (14%) |
138 (9%) |
0.068 |
| β-blocker |
60 (60%) |
914 (57%) |
0.578 |
| ACE-I/ARB |
54 (54%) |
1,155 (72%) |
<0.001 |
| Statin |
81 (81%) |
1,460 (91%) |
<0.001 |
Values are shown as n (%). ACE-I, angiotensin-converting enzyme inhibitor; ARB, angiotensin-receptor blocker; CABG, coronary artery bypass grafting; PCI, percutaneous coronary intervention.
Angiography showed that multivessel vessel disease was more prevalent in ACS patients with major bleeding (75% vs. 54%, P<0.001) (Table 3). DFC (68% vs. 48%, P=0.014) and calcified plaque (63% vs. 42%, P=0.011) were more prevalent in the culprit lesions on OCT in patients with major bleeding (Table 4).
Table 3.
Comparison of Angiographic Findings in the Bleeding and No-Bleeding Groups
| |
Bleeding group
(n=99) |
No-bleeding group
(n=1,481) |
P value |
| Pre-intervention |
| Multivessel coronary disease* |
74 (75%) |
819 (54%) |
<0.001 |
| Culprit artery |
| Right |
27 (27%) |
520 (35%) |
<0.001 |
| Left anterior descending |
49 (49%) |
708 (48%) |
| Left circumflex |
14 (14%) |
222 (15%) |
| Left main trunk |
9 (9%) |
28 (2%) |
| Saphenous vein graft |
0 (0%) |
3 (0%) |
| ACC/AHA classification type B2/C |
96 (97%) |
1,407 (95%) |
0.626 |
| Lesion length, mm |
16.5 (11.5, 25.5) |
15.6 (11.4, 23.6) |
0.407 |
| Minimum lumen diameter, mm |
0.00 (0.00, 0.46) |
0.22 (0.00, 0.47) |
0.565 |
| Reference vessel diameter, mm |
2.67 (2.36, 3.13) |
2.64 (2.25, 3.13) |
0.551 |
| Diameter stenosis, % |
96.1 (82.9, 100) |
91.7 (82.1, 100) |
0.838 |
| TIMI flow grade |
| 0 or 1 |
56 (57%) |
772 (52%) |
0.392 |
| 2 or 3 |
43 (43%) |
709 (48%) |
|
| Post-intervention |
| Minimum lumen diameter, mm |
2.56 (2.10, 3.43) |
2.68 (2.30, 3.08) |
0.014 |
| Reference vessel diameter, mm |
3.05 (2.70, 3.43) |
3.02 (2.64, 3.64) |
0.938 |
| Diameter stenosis, % |
11.3 (7.5, 20.0) |
9.6 (6.3, 14.7) |
0.007 |
| TIMI flow grade |
| 0, 1, or 2 |
14 (14%) |
141 (10%) |
0.135 |
| 3 |
85 (86%) |
1,340 (90%) |
|
Values are shown as median (interquartile range) or n (%). *Defined as the presence of ≥2 diseased vessels (diameter stenosis ≥50%). ACC, American College of Cardiology; AHA, American Heart Association; TIMI, Thrombolysis in Myocardial Infarction.
Table 4.
Comparison of OCT Findings in Patients With Disrupted or Intact Fibrous Cap
| |
Bleeding group
(n=38) |
No-bleeding group
(n=741) |
P value |
| Initial or post-thrombectomy |
| Lesion length, mm |
15.7 (12.8, 24.9) |
18.2 (14.2, 26.2) |
0.219 |
| Minimum lumen CSA, mm2 |
1.28 (1.00, 1.76) |
1.00 (0.81, 1.27) |
0.001 |
| Distal reference lumen CSA, mm2 |
4.31 (3.40, 7.36) |
4.66 (3.40, 6.50) |
0.669 |
| Proximal reference lumen CSA, mm2 |
5.54 (4.31, 7.12) |
6.64 (5.05, 8.66) |
0.037 |
| Plaque morphology |
| Plaque disruption |
26 (68%) |
356 (48%) |
0.014 |
| Intact fibrous cap |
12 (32%) |
385 (52%) |
| Lipid plaque |
30/741 (79%) |
617/741 (83%) |
0.479 |
| Maximum lipid plaque arc, ° |
249 (184, 278) |
239 (189, 279) |
0.938 |
| Lipid plaque length, mm |
12.0 (8.4, 14.1) |
12.6 (8.7, 18.0) |
0.233 |
| Fibrous cap thickness, mm |
0.077 (0.063, 0.10) |
0.077 (0.063, 0.097) |
0.980 |
| Calcification |
24/38 (63%) |
312/741 (42%) |
0.011 |
| Thrombus |
33/38 (87%) |
649/741 (88%) |
0.893 |
| Red thrombus/white thrombus |
17 (52%)/16 (52%) |
310 (48%)/429 (52%) |
0.177 |
| Post-stenting |
| Minimum lumen CSA, mm2 |
4.90 (3.51, 6.01) |
5.03 (3.89, 6.46) |
0.260 |
| Distal reference lumen CSA, mm2 |
4.51 (3.34, 5.82) |
5.25 (3.69, 7.03) |
0.135 |
| Proximal reference lumen CSA, mm2 |
5.80 (4.93, 7.62) |
6.96 (5.27, 9.04) |
0.079 |
Values are shown as median (interquartile range) or n (%). CSA, cross-sectional area; OCT, optical coherence tomography.
The incidence of cardiovascular death during the 2-year follow-up period was significantly higher among patients with major bleeding (26.4% vs. 8.5%, P=0.001) (Figure 2). Univariate, but not multivariate Cox proportional hazards analyses showed that major bleeding in patients with ACS was a predictor of cardiac death within 2 years (hazard ratio 3.640 [95% confidence interval 2.444–5.422], P<0.001) (Table 5). DFC was a predictor of major bleeding in the multivariate Cox proportional hazards analyses (hazard ratio 2.135 [95% confidence interval 1.070–4.263], P<0.001) (Table 6).
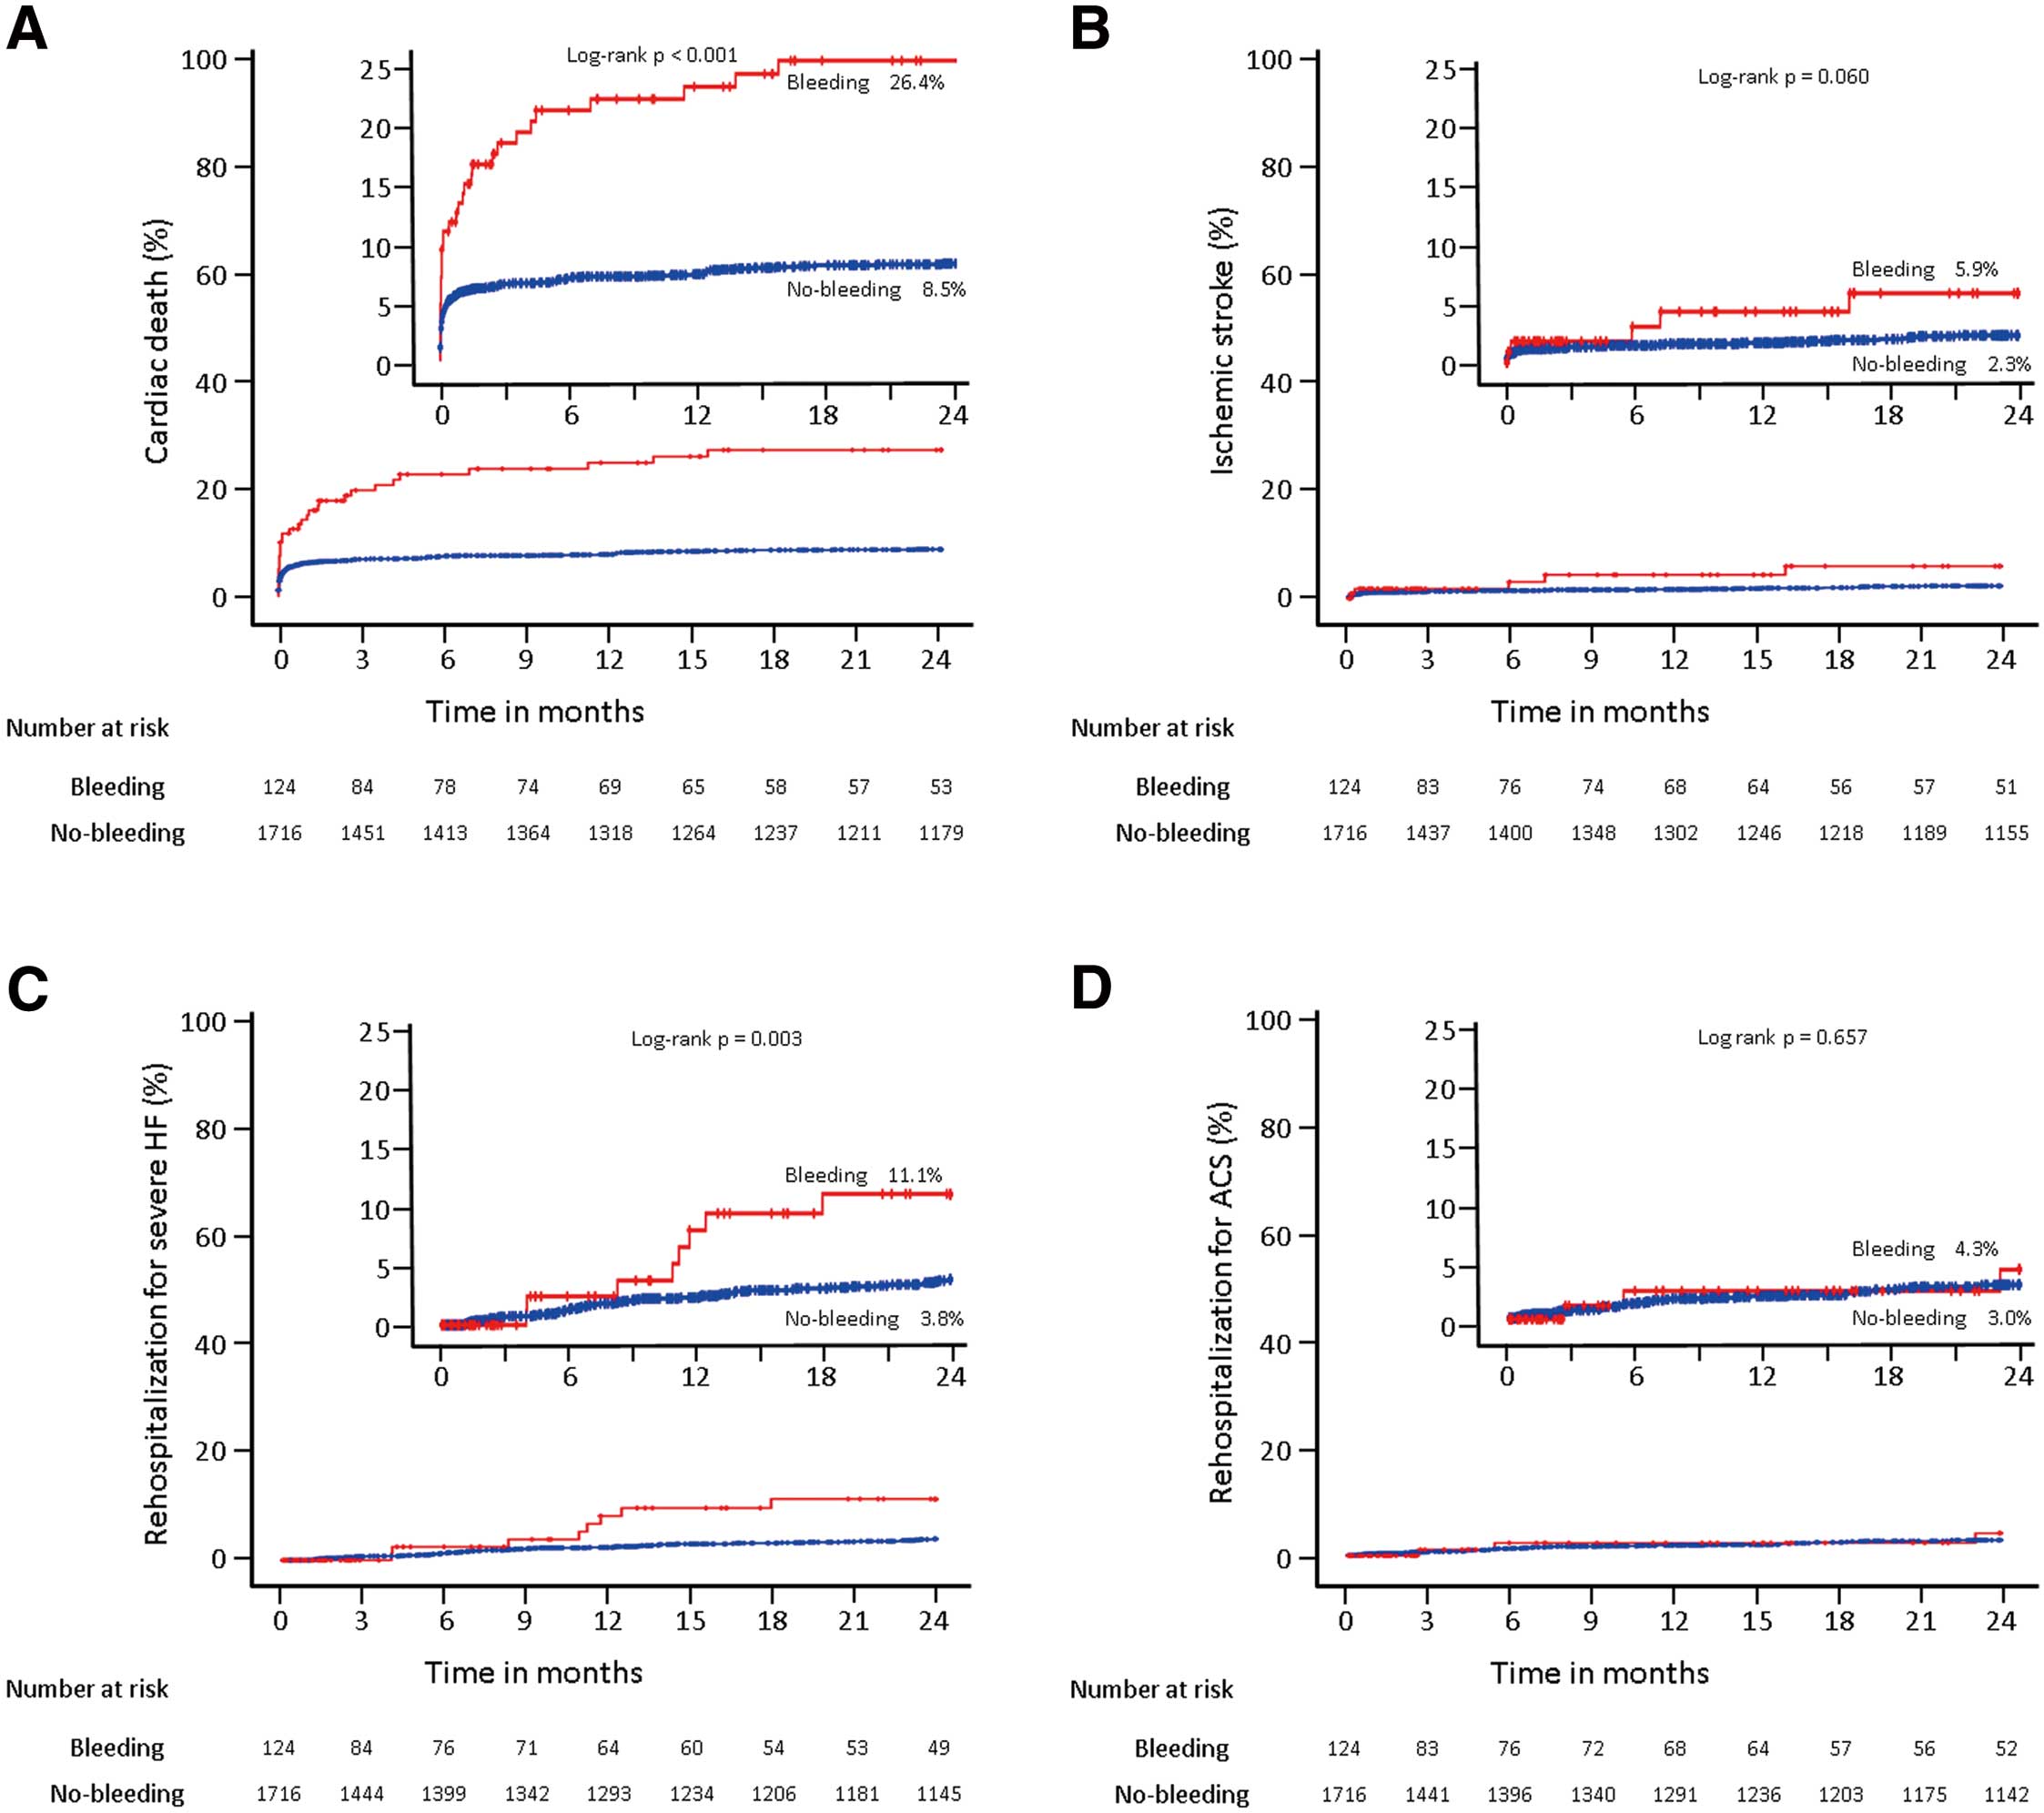
Table 5.
Cox Proportional Hazards Analysis for Predictors of Cardiac Death Within 2 Years After Major Bleeding
| |
Univariate analysis |
Multivariate analysis |
| HR (95% CI) |
P value |
HR (95% CI) |
P value |
| All-ACS cohort |
| Major bleeding |
3.640 (2.444–5.422) |
<0.001 |
1.183 (0.751–1.863) |
0.468 |
| Female |
1.086 (0.739–1.594) |
0.675 |
0.809 (0.470–1.390) |
0.442 |
| Age ≥75 years |
2.021 (1.467–2.783) |
<0.001 |
1.485 (1.020–2.162) |
0.039 |
| Diabetes mellitus |
1.828 (1.335–2.502) |
<0.001 |
1.391 (0.988–1.961) |
0.059 |
| Hypertension |
0.981 (0.700–1.376) |
0.913 |
0.743 (0.518–1.067) |
0.108 |
| Body height, 10 cm increase |
0.818 (0.688–0.973) |
0.023 |
0.879 (0.645–1.197) |
0.414 |
| Body weight, 1.0 kg increase |
0.991 (0.979–1.003) |
0.128 |
1.003 (0.988–1.019) |
0.675 |
| Hemoglobin <11.0 g/dL |
4.252 (2.991–6.043) |
<0.001 |
1.373 (0.875–2.154) |
0.167 |
| Platelet <10.0×10⁴/μL |
8.478 (5.392–13.331) |
<0.001 |
2.986 (1.794–4.969) |
<0.001 |
| eGFR <30 mL/min/1.73 m2 |
4.540 (3.186–6.470) |
<0.001 |
2.175 (1.412–3.350) |
<0.001 |
| Killip II/III/IV (vs. Killip I) |
11.920 (8.317–17.083) |
<0.001 |
9.010 (6.204–13.085) |
<0.001 |
| History of atrial fibrillation |
1.942 (1.202–3.138) |
0.007 |
1.092 (0.666–1.792) |
0.726 |
| History of peripheral artery disease |
1.584 (0.778–3.228) |
0.205 |
0.571 (0.269–1.208) |
0.143 |
| History of cerebral infarction |
2.793 (1.687–4.622) |
<0.001 |
2.007 (1.184–3.403) |
0.010 |
| OCT cohort |
| Major bleeding |
4.556 (1.886–11.009) |
0.001 |
2.256 (0.829–6.135) |
0.111 |
| Disrupted vs. intact fibrous cap |
1.506 (0.761–2.981) |
0.240 |
1.072 (0.538–2.137) |
0.843 |
| Hemoglobin <11.0 g/dL |
1.911 (0.584–6.252) |
0.284 |
0.610 (0.162–2.296) |
0.465 |
| Killip II/III/IV (vs. Killip I) |
12.965 (6.067–26.562) |
<0.001 |
10.767 (5.034–23.029) |
<0.001 |
ACS, acute coronary syndrome; CI, confidence interval; eGFR, estimated glomerular filtration rate; HR, hazard ratio; OCT, optical coherence tomography.
Table 6.
Cox Proportional Hazards Analysis for Predictors of Major Bleeding Within 2 Years
| |
Univariate analysis |
Multivariate analysis |
| HR (95% CI) |
P value |
HR (95% CI) |
P value |
| All-ACS cohort |
| Female |
2.175 (1.500–3.155) |
<0.001 |
1.714 (0.977–3.008) |
0.060 |
| Age ≥75 years |
2.119 (1.481–3.031) |
<0.001 |
1.218 (0.807–1.840) |
0.348 |
| Diabetes mellitus |
1.190 (0.833–1.699) |
0.340 |
0.875 (0.593–1.293) |
0.504 |
| Hypertension |
1.105 (0.750–1.628) |
0.614 |
0.891 (0.962–1.149) |
0.219 |
| Body height, 10 cm increase |
0.655 (0.542–0.790) |
<0.001 |
1.157 (0.811–1.651) |
0.420 |
| Body weight, 1.0 kg increase |
0.965 (0.951–0.980) |
<0.001 |
0.981 (0.962–1.000) |
0.047 |
| Hemoglobin <11.0 g/dL |
8.610 (6.003–12.350) |
<0.001 |
4.833 (3.074–7.599) |
<0.001 |
| Platelet <10.0×10⁴/μL |
5.698 (3.134–10.359) |
<0.001 |
1.453 (0.749–2.820) |
0.420 |
| eGFR <30 mL/min/1.73 m2 |
4.285 (2.851–6.441) |
<0.001 |
1.705 (1.045–2.783) |
0.033 |
| Killip II/III/IV (vs. Killip I) |
4.136 (2.905–5.889) |
<0.001 |
3.223 (2.228–4.663) |
<0.001 |
| History of atrial fibrillation |
1.786 (1.024–3.114) |
0.041 |
1.204 (0.680–2.130) |
0.524 |
| History of peripheral artery disease |
1.493 (0.657–3.392) |
0.338 |
0.574 (0.244–1.352) |
0.204 |
| History of cerebral infarction |
1.802 (0.914–3.552) |
0.089 |
1.867 (0.930–3.749) |
0.079 |
| OCT cohort |
| Disrupted vs. intact fibrous cap) |
2.292 (1.156–4.542) |
0.014 |
2.135 (1.070–4.263) |
0.031 |
| Hemoglobin <11.0 g/dL |
12.396 (6.327–24.285) |
<0.001 |
9.890 (4.949–19.762) |
<0.001 |
| Killip II/III/IV (vs. Killip I) |
4.393 (2.315–8.335) |
<0.001 |
2.702 (1.400–5.214) |
<0.001 |
| Transfemoral intervention |
3.789 (1.989–7.215) |
<0.001 |
2.947 (1.534–5.660) |
0.001 |
Abbreviations as in Table 5.
Discussion
In the present study, we focused on major bleeding events in Japanese patients with ACS. The major findings were: (1) Japanese patients with ACS who experienced major bleeding had poor outcomes; (2) predictors of major bleeding in Japanese ACS patients were consistent with the ARC’s HBR factors; and (3) more advanced atherosclerosis (i.e., DFC and calcified plaque) were more prevalent by OCT in ACS patients with major bleeding, and DFC observed on OCT was a predictor of major bleeding in ACS patients.
Although ACS patients are generally more thrombophilic than patients with stable coronary artery disease (CAD), optimal antithrombotic strategies, including periprocedural anticoagulant and peri-and postprocedural dual antiplatelet therapy, have reduced thrombotic events after primary PCI for patients with ACS. On the other hand, hemorrhagic complications due to the effects of potent antithrombotic therapy have become a problem. The incidence of stent thrombosis during 1 year is <1.0%,13,14 which is much lower than the incidence of major bleeding. Frequency of major bleeding at 30 days in the ACUTY and HORIZONS-AMI trials was 3.8% and 6.2%, respectively.15 Recent PCI registries from Switzerland (BERN registry) and from Japan (PENFULUM registry) reported a frequency of major bleeding at 1-year follow-up period of 3.7%16 and 2.6%,12 respectively. In the PARIS registry from the USA and Europe, the incidence of major bleeding at 2 years was 3.3%.17 In our study, the incidence of major bleeding during a 2-year follow-up period was 6.7%. The frequency of major bleeding complications varies among reports, partly because of differences in clinical backgrounds. The trend toward higher bleeding rates in the present study compared with previous study is consistent with previous findings that East Asians are at higher risk for bleeding than Westerners. It is also well known that the incidence of major bleeding is higher in ACS patients.1 All patients in the ACUTY and HORIZON-AMI registries were ACS cases, and the BERN, PENDULUM and PARIS registries contained 56%, 32% and 38%, respectively, of ACS cases. All patients in our study had ACS, and therefore the frequency of major bleeding was likely to be high.
In patients with CAD, major bleeding after stenting has been reported to be a prognostic factor of death.15,18–20 Consistent with previous studies, our study showed that Japanese patients with ACS experiencing major bleeding had a higher cardiac mortality rate in the 2-year follow-up period. In our univariate analysis, the hazard ratio of 3.64 indicated that major bleeding was an important contributor to cardiac death, although our multivariate analysis including patient background and ACS severity did not show major bleeding an independent predictor of cardiac death. Instead study, increased severity of ACS (Killip II, III, IV) was a determinant of major bleeding, and this correlation may explain why major bleeding was not an independent prognostic factor in these ACS patients.
The ARC has developed a consensus document summarizing previous reports on predictors of bleeding in CAD.1 It defines the criteria for HBR and advocates that Japanese guidelines assess bleeding risk based on the same criteria.11 A study based on a Japanese PCI registry showed that the major ARC-HBR criteria were consistent in Japanese patients, and that the femoral artery approach during PCI and ACS as the underlying CAD may influence the incidence of major bleeding. In our study, patients with major bleeding had chronic kidney disease, low hemoglobin levels, low platelet counts, older age, and high use of oral anticoagulant drugs, all of which were consistent with ARC-HBR criteria. Multivariate analysis showed that low body weight was an independent determinant of major bleeding in addition to anemia and chronic kidney disease, which are included in the ARC-HBR criteria. These results are consistent with previous reports from Japan.12 We have also shown in our previous reports that among patients with ACS, those with low body mass index have a higher incidence of bleeding, more atherosclerotic changes, and poorer outcomes.21
In this study, which included only ACS cases, severity at presentation was a predictor of major bleeding. The reasons for the increased risk of major bleeding in severe ACS have not been studied, but one may be that patients with severe ACS are more likely to undergo the transfemoral approach for primary PCI. Consistent with previous reports,22,23 our study showed that patients who underwent transfemoral primary PCI more prevalently suffered major bleeding. However, in the multivariate analysis of the OCT cohort, ACS severity was a predictor of major bleeding independent of the access site.
Therefore, we focused on the relationship between advanced atherosclerosis and major bleeding. The originality of this study is that we examined the relationship between atherosclerosis progression in the ACS culprit coronary artery lesion and the incidence of major bleeding. Patients with major bleeding during the follow-up period had a higher frequency of multivessel disease on angiography, as well as more DFC and calcified plaque on OCT at the time of index PCI. In the multivariate analysis including ACS severity, DFC was an independent predictor of major bleeding. These results suggested that patients with advanced atherosclerosis may be more prone to major bleeding. Yatskar et al found that access site bleeding was associated with advanced atherosclerosis in the affected lesion.24 Many other reports document a relationship between advanced atherosclerosis and intracerebral hemorrhage,25,26 diverticular hemorrhage,27,28 and bleeding from ischemic colitis.29 The contribution of atherosclerosis to increased bleeding frequency may partially explain the higher incidence of bleeding in patients with renal dysfunction (especially on hemodialysis), those with ACS (compared with stable CAD), and those with more severe ACS. In this study, we retrospectively examined the progression of coronary atherosclerosis in patients with bleeding complications. Future comparisons of the progression of atherosclerotic findings by bleeding risk may lead to consideration of measures to prevent future bleeding.
Study Limitations
First, this study had an observational, retrospective, single-center design. We were therefore unable to include all potential risk factors for major bleeding, such as duration of dual antiplatelet therapy or oral anticoagulant medication, previous history of bleeding and transfusion, long-term oral nonsteroidal anti-inflammatory drug or steroid use and frailty, which would affect the frequency of major bleeding. Second, we enrolled ACS cases from 2008 to 2018, which does not necessarily reflect contemporary ACS treatment, including the type and duration of antiplatelet and anticoagulant therapies, stent type, and approach site during PCI. Third, the OCT subcohort generated selection bias by not representing patients with severe ACS, because the indication for OCT examination was defined according to operator discretion. Fourth, the number of ACS patients who underwent OCT was small relative to all ACS patients, and the study had insufficient statistical power with respect to less frequently occurring OCT findings, such as calcified nodules. Further investigation for the effect of the presence of calcified nodules and detailed findings of calcified lesions on the incidence of hemorrhage is warranted. Finally, the statistical power of comparisons between patients with and without bleeding was low, especially in the OCT cohort. In addition to the small number of cases in the OCT cohort, selection bias may be responsible for the low number of major bleeding cases in the OCT cohort. In the OCT cohort, major bleeding during the 2-year follow-up period occurred in only 38 patients and thus multivariable analysis was unable to include enough variables to identify independent predictors for major bleeding.
Conclusions
In a Japanese population, ACS patients with major bleeding had poorer outcomes. In addition to known bleeding risk factors such as anemia, renal dysfunction, and low body weight, ACS severity was a predictor of major bleeding in patients with ACS. Atherosclerotic changes such as DFC and calcified plaque were more frequently observed on OCT in patients with major bleeding during the 2-year follow-up period after ACS, and DFC on OCT was an independent predictor of major bleeding.
Disclosures
The authors have no conflicts of interest to declare in association with the present study.
IRB Information
This study was approved by the Ethics Committee of Nippon Medical School Chiba Hokusoh Hospital (Reference no. 752).
Data Availability
The deidentified participant data will not be shared.
References
- 1.
Urban P, Mehran R, Colleran R, Angiolillo DJ, Byrne RA, Capodanno D, et al. Defining high bleeding risk in patients undergoing percutaneous coronary intervention. Circulation 2019; 140: 240–261.
- 2.
Mehran R, Rao SV, Bhatt DL, Gibson CM, Caixeta A, Eikelboom J, et al. Standardized bleeding definitions for cardiovascular clinical trials: A consensus report from the Bleeding Academic Research Consortium. Circulation 2011; 123: 2736–2747.
- 3.
Kubo T, Imanishi T, Takarada S, Kuroi A, Ueno S, Yamano T, et al. Assessment of culprit lesion morphology in acute myocardial infarction: Ability of optical coherence tomography compared with intravascular ultrasound and coronary angioscopy. J Am Coll Cardiol 2007; 50: 933–939.
- 4.
Liu D, Lei F, Yu H, Li L, Wei G, Liu Y, et al. Morphological characteristics of culprit plaques in acute myocardial infarction patients with different scores of type A personality: An intravascular optical coherence tomography study. Circ J 2023; 87: 1654–1660.
- 5.
Kobayashi N, Hata N, Tsurumi M, Shibata Y, Okazaki H, Shirakabe A, et al. Relation of coronary culprit lesion morphology determined by optical coherence tomography and cardiac outcomes to serum uric acid levels in patients with acute coronary syndrome. Am J Cardiol 2018; 122: 17–25.
- 6.
Kobayashi N, Shibata Y, Okazaki H, Shirakabe A, Takano M, Miyauchi Y, et al. A novel technique of low molecular weight dextran infusion followed by catheter push (D-PUSH) for optical coherence tomography. EuroIntervention 2021; 17: e149–e151.
- 7.
Tearney GJ, Regar E, Akasaka T, Adriaenssens T, Barlis P, Bezerra HG, et al. Consensus standards for acquisition, measurement, and reporting of intravascular optical coherence tomography studies: A report from the International Working Group for Intravascular Optical Coherence Tomography Standardization and Validation. J Am Coll Cardiol 2012; 59: 1058–1072.
- 8.
Prati F, Regar E, Mintz GS, Arbustini E, Di Mario C, Jang IK, et al. Expert review document on methodology, terminology, and clinical applications of optical coherence tomography: Physical principles, methodology of image acquisition, and clinical application for assessment of coronary arteries and atherosclerosis. Eur Heart J 2010; 31: 401–415.
- 9.
Niccoli G, Montone RA, Di Vito L, Gramegna M, Refaat H, Scalone G, et al. Plaque rupture and intact fibrous cap assessed by optical coherence tomography portend different outcomes in patients with acute coronary syndrome. Eur Heart J 2015; 36: 1377–1384.
- 10.
Jia H, Abtahian F, Aguirre AD, Lee S, Chia S, Lowe H, et al. In vivo diagnosis of plaque erosion and calcified nodule in patients with acute coronary syndrome by intravascular optical coherence tomography. J Am Coll Cardiol 2013; 62: 1748–1758.
- 11.
Nakamura M, Kimura K, Kimura T, Ishihara M, Otsuka F, Kozuma K, et al. JCS 2020 Guideline focused update on antithrombotic therapy in patients with coronary artery disease. Circ J 2020; 84: 831–865.
- 12.
Nakamura M, Kadota K, Nakao K, Nakagawa Y, Shite J, Yokoi H, et al. High bleeding risk and clinical outcomes in East Asian patients undergoing percutaneous coronary intervention: The PENDULUM registry. EuroIntervention 2021; 16: 1154–1162.
- 13.
Asano T, Ono M, Dai Z, Saito A, Kanie T, Takaoka Y, et al. Temporal trends in clinical outcomes after percutaneous coronary intervention: A systematic review of 66,327 patients from 25 all-comers trials. EuroIntervention 2022; 17: 1318–1329.
- 14.
Collet JP, Cuisset T, Rangé G, Cayla G, Elhadad S, Pouillot C, et al. Bedside monitoring to adjust antiplatelet therapy for coronary stenting. N Engl J Med 2012; 367: 2100–2109.
- 15.
Mehran R, Pocock SJ, Nikolsky E, Clayton T, Dangas GD, Kirtane AJ, et al. A risk score to predict bleeding in patients with acute coronary syndromes. J Am Coll Cardiol 2010; 55: 2556–2566.
- 16.
Ueki Y, Bär S, Losdat S, Otsuka T, Zanchin C, Zanchin T, et al. Validation of the Academic Research Consortium for High Bleeding Risk (ARC-HBR) criteria in patients undergoing percutaneous coronary intervention and comparison with contemporary bleeding risk scores. EuroIntervention 2020; 16: 371–379.
- 17.
Baber U, Mehran R, Giustino G, Cohen DJ, Henry TD, Sartori S, et al. Coronary thrombosis and major bleeding after PCI with drug-eluting stents: Risk scores from PARIS. J Am Coll Cardiol 2016; 67: 2224–2234.
- 18.
Nikolsky E, Stone GW, Kirtane AJ, Dangas GD, Lansky AJ, McLaurin B, et al. Gastrointestinal bleeding in patients with acute coronary syndromes: Incidence, predictors, and clinical implications: Analysis from the ACUITY (Acute Catheterization and Urgent Intervention Triage Strategy) trial. J Am Coll Cardiol 2009; 54: 1293–1302.
- 19.
Verheugt FW, Steinhubl SR, Hamon M, Darius H, Steg PG, Valgimigli M, et al. Incidence, prognostic impact, and influence of antithrombotic therapy on access and nonaccess site bleeding in percutaneous coronary intervention. JACC Cardiovasc Interv 2011; 4: 191–197.
- 20.
Généreux P, Giustino G, Witzenbichler B, Weisz G, Stuckey TD, Rinaldi MJ, et al. Incidence, predictors, and impact of post-discharge bleeding after percutaneous coronary intervention. J Am Coll Cardiol 2015; 66: 1036–1045.
- 21.
Kobayashi N, Shibata Y, Kurihara O, Todoroki T, Tsutsumi M, Shirakabe A, et al. Impact of low body mass index on features of coronary culprit plaques and outcomes in patients with acute coronary syndrome. Am J Cardiol 2021; 158: 6–14.
- 22.
Meijers TA, Aminian A, van Wely M, Teeuwen K, Schmitz T, Dirksen MT, et al. Randomized comparison between radial and femoral large-bore access for complex percutaneous coronary intervention. JACC Cardiovasc Interv 2021; 14: 1293–1303.
- 23.
Ferrante G, Rao SV, Jüni P, Da Costa BR, Reimers B, Condorelli G, et al. Radial versus femoral access for coronary interventions across the entire spectrum of patients with coronary artery disease: A meta-analysis of randomized trials. JACC Cardiovasc Interv 2016; 9: 1419–1434.
- 24.
Yatskar L, Selzer F, Feit F, Cohen HA, Jacobs AK, Williams DO, et al. Access site hematoma requiring blood transfusion predicts mortality in patients undergoing percutaneous coronary intervention: Data from the National Heart, Lung, and Blood Institute Dynamic Registry. Catheter Cardiovasc Interv 2007; 69: 961–966.
- 25.
Boulouis G, Charidimou A, Auriel E, Haley KE, van Etten ES, Fotiadis P, et al. Intracranial atherosclerosis and cerebral small vessel disease in intracerebral hemorrhage patients. J Neurol Sci 2016; 369: 324–329.
- 26.
Al-Shahi Salman R, Labovitz DL, Stapf C. Spontaneous intracerebral haemorrhage. BMJ 2009; 339: b2586.
- 27.
Jansen A, Harenberg S, Grenda U, Elsing C. Risk factors for colonic diverticular bleeding: A Westernized community based hospital study. World J Gastroenterol 2009; 15: 457–461.
- 28.
Yanai H, Ohashi K, Otani K, Koyama T. Colonic diverticular haemorrhage is associated with atherosclerosis. QJM 2005; 98: 915–916.
- 29.
Yadav S, Dave M, Edakkanambeth Varayil J, Harmsen WS, Tremaine WJ, Zinsmeister AR, et al. A population-based study of incidence, risk factors, clinical spectrum, and outcomes of ischemic colitis. Clin Gastroenterol Hepatol 2015; 13: 731–738.e1–e6; quiz e741.
