Abstract
Background:
Patients with cardiogenic shock due to acute myocardial infarction (AMI) can rapidly undergo veno-arterial extracorporeal membrane oxygenation (VA-ECMO) therapy to recover cardiac output and decrease mortality. However, the clinical indicators predictive of mortality in these patients remain unknown.
Methods and Results:
We conducted a single-center retrospective cohort study targeting AMI patients undergoing VA-ECMO. All 63 patients undergoing VA-ECMO for AMI at the Japanese Red Cross Kumamoto Hospital between January 1, 2010 and June 30, 2020 were enrolled. An exploratory analysis was conducted using a survival tree model and variables selected in a univariate Cox proportional hazard model. The median survival time from the start of VA-ECMO was 6.3 days, and 77.8% (n=49) of patients died. Survival analysis divided patients into 3 groups based on 2 parameters at the initial medical examination: Group 1, patients with neither hyperglycemia (blood glucose ≥213 mg/dL) nor thrombocytopenia (platelets ≤145,100/μL); Group 2, patients with hyperglycemia; and Group 3, patients with hyperglycemia plus thrombocytopenia. Relative to Group 1, the risk of in-hospital mortality was significantly increased in Group 2 (hazard ratio [HR] 2.25; 95% confidence interval [CI] 1.13–4.46), and that risk further increased in Group 3 (HR 7.60; 95% CI 3.21–17.95).
Conclusions:
Hyperglycemia plus thrombocytopenia on initial medical examination combinatorially increase the risk of mortality in patients with cardiogenic shock due to AMI undergoing VA-ECMO.
Ischemic heart disease (IHD) is a global health problem, with an increasing prevalence and poor prognosis.1
The World Health Organization estimated that more than 9 million people died of IHD in 2016.1
In particular, prognosis is poor (70–80% death rate) in patients with cardiogenic shock due to acute myocardial infarction (AMI), even if those patients receive high-quality cardiopulmonary resuscitation (CPR).2
If patients with cardiogenic shock show potential of recovering cardiac output, veno-arterial extracorporeal membrane oxygenation (VA-ECMO) therapy can be rapidly applied as a way to reduce mortality.3–8
However, VA-ECMO therapy has little effect in some AMI patients, suggesting a need for more intensive therapy and/or care. These outcomes also strongly suggest the importance of predictive clinical evaluation of the prognosis of AMI patients with cardiac shock on admission to hospital and before receiving VA-ECMO therapy. Previously, most studies investigated risk factors relevant to severe outcomes following VA-ECMO therapy in AMI patients based on the assumption that risk factors were independent.9–12
What has not been done to date is the evaluation of risk using a statistical model considering combinations of clinical parameters.
Here, to evaluate an association between risk factors and patient mortality risk, we conducted a single center retrospective cohort study in Japan targeting patients receiving VA-ECMO with myocardial infarction, which is the most common cause of cardiogenic shock.13,14
Using this clinical data, we performed data-driven exploratory analysis of combinatorial factors predictive of mortality of AMI patients receiving VA-CEMO therapy. We also discuss the clinical implications of our results.
Methods
Study Design
This study was an observational single-center retrospective cohort study targeting a population aged ≥20 years receiving VA-ECMO treatment for AMI at the Japanese Red Cross Kumamoto Hospital in Japan. In all, 63 patients who underwent VA-ECMO at that medical center after experiencing AMI between January 1, 2010 and June 30, 2020 were enrolled in the study. All patients enrolled in the study were Japanese. No patients were excluded from the analysis, and all patients who received VA-ECMO treatment were listed in the dataset for statistical analysis. The diagnosis of AMI was made according to the Japanese Circulation Society’s guidelines on the diagnosis and treatment of acute coronary syndrome, and was based on electrocardiograms, elevated myocardial biomarkers, and angiography.15
All-cause mortality during the in-hospital period was set as the primary endpoint.
The study was performed in accordance with the Declaration of Helsinki and was approved by the ethics committees for clinical research at the Japanese Red Cross Kumamoto Hospital (No. 396) and Kumamoto University (Rinri No. 2153). Written informed consent was obtained from each participant before they were enrolled in the study. Participants and their families confirmed their consent for inclusion of their data in this manuscript via an opt-out method.
Extracorporeal Membrane Oxygenation (ECMO) Systems and Management Methods
The ECMO circuit consisted of a cannula, centrifugal pump, heat exchanger, and membrane oxygenator. Patients were treated using 1 of 2 ECMO systems: Capiox Custom Pack EBS Heart Lung Kit (Terumo, Tokyo, Japan) or Endumo (Heiwa Bussan, Tokyo, Japan). The target flow rate of ECMO was set within a perfusion index of 2.0–2.6 L/min/m2. Cardiotonic and vasopressor agents were used to control mean blood pressure and maintain it above 65 mmHg. Activated clotting time was maintained at 150–200 s by continuous heparin infusion to avoid complications from clotting and bleeding. Continuous renal replacement therapy (CRRT) was also used when patients’ renal function decreased during ECMO. Patients were weaned from ECMO if cardiac function was not exacerbated, even if the ECMO flow rate was maintained at 1.0 L/min.15
If VA-ECMO weaning was deemed difficult, a medical team consisting of cardiologists, cardiovascular surgeons, clinical engineers, and nurses made treatment decisions as to whether ventricular assist device (VAD) therapy was needed.
Clinical Evaluation and Laboratory Testing
Clinical information, including age and sex, was collected from patients. Smoking and drinking habits were assessed as current or not. Body mass index (BMI) was calculated by dividing body weight by height squared. Hypertension, diabetes, dyslipidemia, and chronic kidney disease were each assessed as past history.
In blood examinations, arterial pH, arterial blood base excess (BE), arterial blood bicarbonate, hemoglobin, hematocrit, blood glucose, potassium, lactic acid, and calcium were determined from blood collected from the radial or femoral artery on initial examination. We also evaluated blood urea nitrogen (BUN), serum creatinine, estimated glomerular filtration rate (eGFR), creatine kinase (CK), CK-MB, lactate dehydrogenase (LDH), C-reactive protein (CRP), aspartate aminotransferase (AST), alanine aminotransferase (ALT), total bilirubin, and platelet and leukocyte counts in the emergency room.
Information was also collected regarding the location of the cardiac arrest, and the cardiac arrest time was defined as the time from CPR to the start of VA-ECMO in minutes. Electrocardiogram data (asystole, pulseless electrical activity [PEA], ventricular fibrillation/ventricular tachycardia, bradycardia or sinus rhythm) were collected before VA-ECMO was started. CRRT was defined as use of continuous hemodiafiltration during the hospital admission period. Information relevant to the degree of stenosis of the coronary artery lesion causing the myocardial infarction was also collected. We evaluated the use of antiplatelet therapy (aspirin, clopidogrel, and/or prasugrel), heparin, and epinephrine or norepinephrine during the period between the first medical examination and the start of VA-ECMO. During this period, subjects were not treated with insulin, platelet infusions, or revascularization therapy, such as stenting.
At the start of VA-ECMO, pump speed (in r.p.m.), the perfusion index, the fraction of inspiratory oxygen (FiO2), and the oxygen flow rate of exchange oxygenation were recorded.
Statistical Analysis
To prepare for the statistical analysis of data from the 63 patients, missing information for categorical variables was analyzed. Information was missing for the following variables: hypertension (n=2), diabetes (n=3), dyslipidemia (n=2), smoking (n=5), alcohol use (n=6), and chronic kidney disease (n=1). Median imputation was performed to complement missing information for the following continuous variables: BMI (n=4), CK-MB (n=2), total bilirubin (n=8), pH (n=6), BE (n=6), blood glucose (n=3), lactate (n=12), calcium levels (n=9), CRP (n=6), pump speed (n=2), perfusion index (n=2), FiO2
(n=2), and oxygen flow (n=2). All variables were examined visually, and data for creatinine, BUN, eGFR, CK, CK-MB, LDH, AST, ALT, leukocyte count, lactate, and CRP were log-transformed to correct for a skewed distribution.
To identify candidate variables with a significant association with outcomes, a univariate Cox proportional hazards (PH) model was used to analyze all 43 routine clinical parameters during the period between the first medical examination at the hospital and the start of VA-ECMO. The associations between these parameters and patients’ mortality risk after starting VA-ECMO were then assessed (Supplementary Figure). We then selected 12 variables evaluated as significant risk factors in the univariate Cox PH model. Next, in survival tree analyses, we used a classification and regression tree to decrease the number of variables and stratify subjects based on combinatorial risk factors. In these analyses, we used age, sex, and 8 clinical categories of 12 variables found to be statistically significant in the univariate Cox PH model as explanatory variables. Outcomes were evaluated as time to event survival data.16–18
The classification tree groups subjects on the basis of minimizing the impurity of the data in view of the association with outcome. This analysis decreased the number of parameters from 14 to 2, based on mortality risk, enabling patients to be stratified into 3 groups. Kaplan-Mayer curves were then used to estimate the median survival time or the survival rate for each group. The Cox PH model and 10,000 bootstrap replications were then used to evaluate associations between these groups and all-cause mortality. Wald tests were used to compare the coefficients of each group obtained in the Cox PH models.
Analyses were performed using Stata/MP 16.0 (StataCorp, College Station, TX, USA). Two-sided P<0.05 was considered significant.
Results
Clinical information relevant to the patients’ background at baseline is presented in
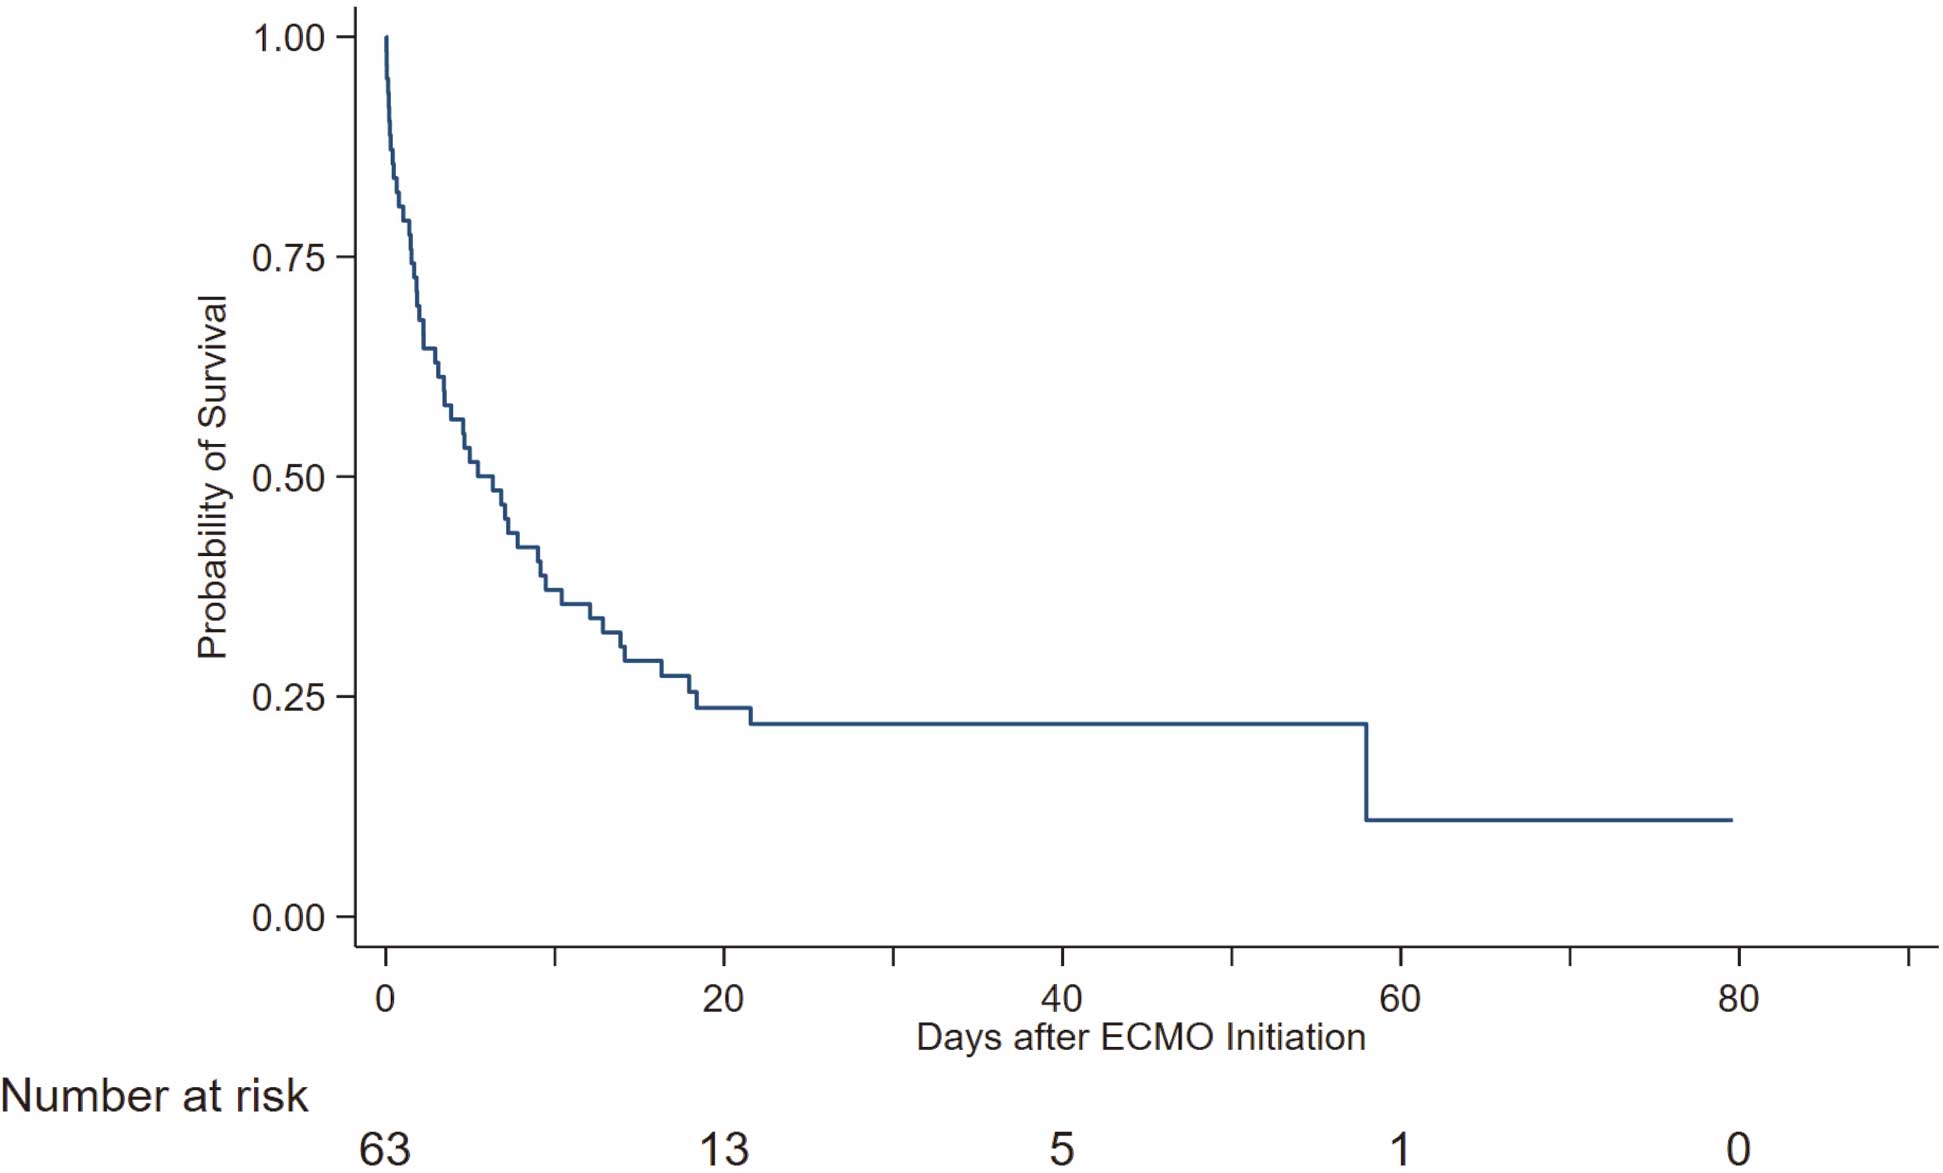
Table 1. The prognosis of all patients was followed during the in-hospital period, and Kaplan-Meier analysis revealed that the median survival time from the start of VA-ECMO was 6.3 days (95% confidence interval [CI] 2.9–9.5 days). Overall, 77.8% (n=49) of patients died (Figure 1), with 25 (51.0%) dying of AMI, 5 (10.2%) dying of ventricular fibrillation, and 5 (10.2%) dying of heart failure according to information contained in the death certificates.
Table 1.
Patient Characteristics Before Veno-Arterial Extracorporeal Membrane Oxygenation (Categorical Variables) and Results From Univariate Analysis Using Cox Proportional Hazard Models
| Categorical variable |
Percentage |
Number |
HR (95% CI) |
P value |
| Male sex |
69.8 |
44 |
1.03 (0.55, 1.92) |
0.927 |
| Smoking |
39.7 |
25 |
0.73 (0.36, 1.47) |
0.374 |
| Alcohol use |
38.1 |
24 |
0.96 (0.52, 1.76) |
0.897 |
| Diabetes |
46 |
29 |
0.82 (0.46, 1.46) |
0.503 |
| Hypertension |
69.8 |
44 |
0.92 (0.48, 1.75) |
0.799 |
| Dyslipidemia |
49.2 |
31 |
0.89 (0.50, 1.58) |
0.681 |
| Chronic kidney disease |
17.5 |
11 |
1.48 (0.73, 2.98) |
0.278 |
| Continuous renal replacement therapy |
25.4 |
16 |
1.29 (0.70, 2.39) |
0.414 |
| Location of cardiac arrest |
| No cardiac arrest |
4.8 |
3 |
1 |
– |
| IHCA |
49.2 |
31 |
2.1 (0.50, 8.89) |
0.313 |
| OHCA |
46 |
29 |
1.36 (0.32, 5.81) |
0.681 |
| ECG immediately before VA-ECMO induction |
| Asystole |
20.6 |
13 |
1 |
– |
| PEA |
31.7 |
20 |
1.14 (0.53, 2.45) |
0.729 |
| VT/VF |
39.7 |
25 |
0.7 (0.33, 1.51) |
0.367 |
| Bradycardia |
3.2 |
2 |
0 (0.00, 0.00) |
1 |
| Sinus rhythm |
4.8 |
3 |
0.89 (0.25, 3.21) |
0.861 |
| Infarct-related artery |
| Single vessel |
25.5 |
16 |
1 |
– |
| Double vessels |
30.3 |
19 |
0.97 (0.46, 2.06) |
0.938 |
| Triple vessels |
11.1 |
7 |
0.76 (0.29, 2.02) |
0.586 |
| Left main trunk |
6.4 |
4 |
1.36 (0.44, 4.19) |
0.597 |
| Left main trunk+multiple vessels |
22.2 |
14 |
0.66 (0.28, 1.56) |
0.342 |
| Unknown |
4.7 |
3 |
0.87 (0.18, 4.08) |
0.855 |
| Antiplatelet drugs |
| None |
36.4 |
23 |
1.00 |
– |
| Single |
8.0 |
5 |
0.46 (0.13, 1.54) |
0.206 |
| DAPT |
55.6 |
35 |
0.40 (0.22, 0.72) |
0.002 |
CI, confidence interval; DAPT, dual antiplatelet therapy; ECG, electrocardiogram; HR, hazard ratio; IHCA, in-hospital cardiac arrest; OHCA, out-of-hospital cardiac arrest; PEA, pulseless electrical activity; VA-ECMO, veno-arterial extracorporeal membrane oxygenation; VF, ventricular fibrillation; VT, ventricular tachycardia.
To evaluate potential associations between clinical parameters and mortality risk, we performed univariate analysis using the Cox PH model. These analyses revealed that circulating creatinine concentrations, eGFR, glucose, potassium, and platelet counts at the time of the initial medical examination were associated with mortality risk (Table 2). Of the arterial blood gas analysis parameters, pH, BE, and lactate at the initial medical examination were significantly associated with mortality risk (Table 2). The perfusion index at the start of VA-ECMO was also associated with mortality (Table 2). The use of dual antiplatelet therapy and treatment with heparin and low-dose epinephrine were associated with a benign prognosis.
Table 2.
Patient Characteristics Prior to Induction of Veno-Arterial Extracorporeal Membrane Oxygenation (Continuous Variables) and Results of Univariate Analyses Using Cox Proportional Hazard Models
| Continuous variable |
Median [IQR] |
HR (95% CI) |
P value |
| Age (years) |
68 [52, 74] |
1.01 (0.98, 1.03) |
0.617 |
| BMI (kg/m2) |
24.5 [22.2, 27.8] |
1.03 (0.97, 1.10) |
0.335 |
| Creatinine (mg/dL) |
1.19 [0.84, 1.68] |
1.7 (1.13, 2.54) |
0.011 |
| BUN (mg/dL) |
19 [14.5, 30.2] |
1.16 (0.73, 1.83) |
0.534 |
| eGFR (mL/min/1.73 m2) |
45.4 [30.5, 60.9] |
0.63 (0.44, 0.91) |
0.013 |
| CK (U/L) |
188 [104, 828] |
0.88 (0.71, 1.07) |
0.195 |
| CK-MB (U/L) |
20 [3.5, 55] |
0.94 (0.80, 1.09) |
0.399 |
| LDH (U/L) |
472 [303, 730] |
1.04 (0.77, 1.41) |
0.785 |
| AST (U/L) |
96 [37, 257] |
0.99 (0.82, 1.21) |
0.954 |
| ALT (U/L) |
48 [31, 136] |
1.02 (0.83, 1.24) |
0.848 |
| T-Bil (mg/dL) |
0.4 [0.3, 0.7] |
0.92 (0.68, 1.23) |
0.561 |
| Leucocytes (/μL) |
11,660 [9,900, 15,840] |
1.36 (0.66, 2.79) |
0.4 |
| Platelets (×104/μL) |
18.6 [12.6, 23.9] |
0.96 (0.92, 1.00) |
0.046 |
| pH |
7.19 [6.94, 7.30] |
0.21 (0.05, 0.81) |
0.023 |
| BE (mmol/L) |
−10.2 [−17.6, −5.2] |
0.96 (0.93, 1.00) |
0.029 |
| HCO3− (mEq/L) |
17.6 [12.5, 20.6] |
0.96 (0.91, 1.00) |
0.064 |
| Hb (g/dL) |
12.1 [10.5, 13.9] |
0.97 (0.86, 1.10) |
0.648 |
| Hct (%) |
37.2 [30.8, 42.4] |
1.01 (0.82, 1.24) |
0.921 |
| Blood glucose (mg/dL) |
234.5 [162, 342] |
1.03 (1.01, 1.05) |
0.015 |
| Lactic acid (mmol/L) |
9.1 [5.2, 12.4] |
1.66 (1.07, 2.56) |
0.023 |
| K (mEq/L) |
4.3 [3.8, 5.3] |
1.4 (1.04, 1.89) |
0.026 |
| Ca (mmol/L) |
1.13 [1.02, 1.18] |
1.64 (0.12, 22.59) |
0.713 |
| CRP (mg/dL) |
0.49 [0.12, 3.79] |
0.97 (0.85, 1.11) |
0.66 |
| Arrest time (min) |
52 [35, 78] |
1.02 (0.96, 1.07) |
0.545 |
| Pump speed (r.p.m.) |
2,147 [1,933, 2,405] |
0.96 (0.89, 1.04) |
0.32 |
| Perfusion Index (L/min/m2) |
1.88 [1.54, 2.23] |
0.48 (0.26, 0.88) |
0.017 |
| FiO2 (%) |
100 [100, 100] |
1.02 (0.98, 1.05) |
0.354 |
| Oxygen flow (L/min) |
3 [3, 3] |
0.82 (0.50, 1.36) |
0.447 |
| Heparin (1,000 units) |
7 [5, 10] |
0.90 (0.83, 0.99) |
0.026 |
| Norepinephrine (mg) |
0 [0, 1] |
1.07 (0.81, 1.40) |
0.643 |
| Epinephrine (mg) |
4 [1, 8] |
1.11 (1.03, 1.20) |
0.008 |
Creatinine, blood urea nitrogen (BUN), estimated glomerular filtration rate (eGFR), creatine kinase (CK), CK-MB, lactate dehydrogenase (LDH), aspartate aminotransferase (AST), alanine aminotransferase (ALT), leukocyte count, lactic acid, and C-reactive protein (CRP) data were log transformed and put in each univariate Cox proportional hazard model. Hazard ratios (HRs) were estimated for 5% increases in hematocrit (Hct), 10-mg/dL increases in blood glucose, 10-min increases in length in arrest time, and 100-r.p.m. increases in pump speed. BE, blood base excess concentration; BMI, body mass index; CI, confidence interval; FiO2, fraction of inspiratory oxygen; Hb, hemoglobin; Hct, hematocrit; IQR, interquartile range; T-Bil, total bilirubin.
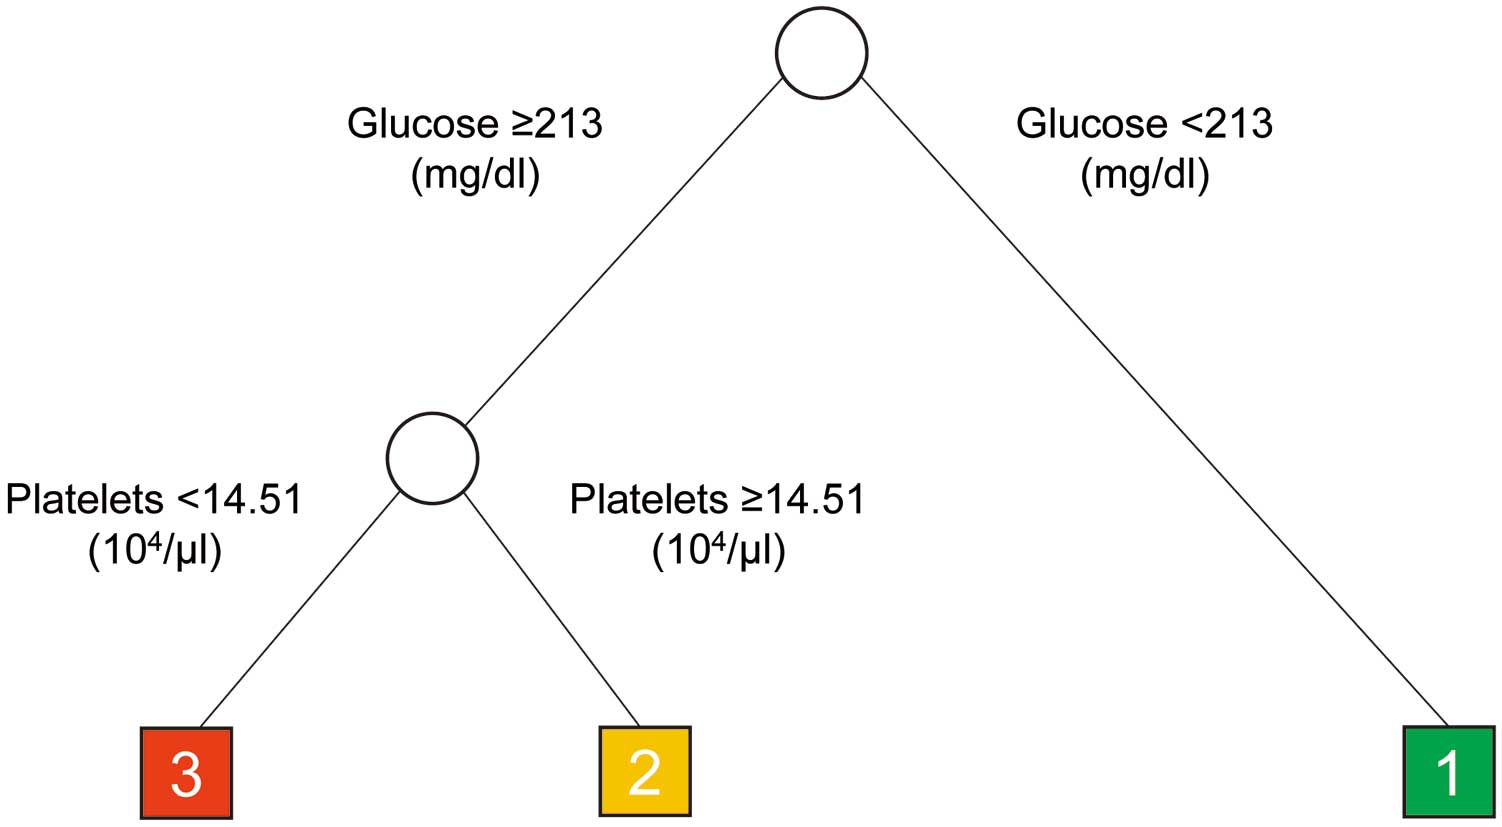
Next, patients were assigned to subgroups based on mortality risk using survival tree methodology with age, sex, and 8 categories of 12 selected parameters that were significantly associated with mortality risk based on a univariate Cox PH model. Those 8 categories were renal function (eGFR or serum creatinine), circulating glucose concentrations, potassium levels, platelet counts, levels of acidosis-related parameters (pH, BE, or lactate) at the initial medical examination, VA-ECMO perfusion index, antiplatelet therapy or heparin use, and low-dose epinephrine use. This analysis reduced the number of explanatory variables to 2, and hierarchically categorized patients into 3 groups based on combinatorial effects of risk factors on patient mortality (Figure 2). Specifically, in this analysis, patients were divided at the first node into hyperglycemic (glucose ≥213 mg/dL) and normal blood glucose prognostic groups (Figure 2). Patients with high glucose levels (≥213 mg/dL) were then divided into groups based on the presence of mild thrombocytopenia (platelets ≤145,100/μL) as the second node of the tree (Figure 2). At that point branching stopped, and only these 2 parameters were used as nodes to further subgroup patients, leading to the creation of 3 groups: Group 1, patients with neither hyperglycemia nor thrombocytopenia; Group 2, patients with hyperglycemia; and Group 3, patients with hyperglycemia plus thrombocytopenia. The subgroups remained unchanged even when alternative survival tree analyses were performed, replacing eGFR with serum creatinine levels, pH with BE or lactate, or antiplatelet therapy with heparin use.
Kaplan-Meier curves for each of the subgroups defined by survival tree analysis are shown in
Figure 3. The median survival time was estimated to be 16.3 days (95% CI 4.65 days–upper bound not reached) for Group1, 7.8 days (95% CI 2.2–12.8 days) for Group 2, and 1.5 days (95% CI 0.4–2.9 days) for Group 3.
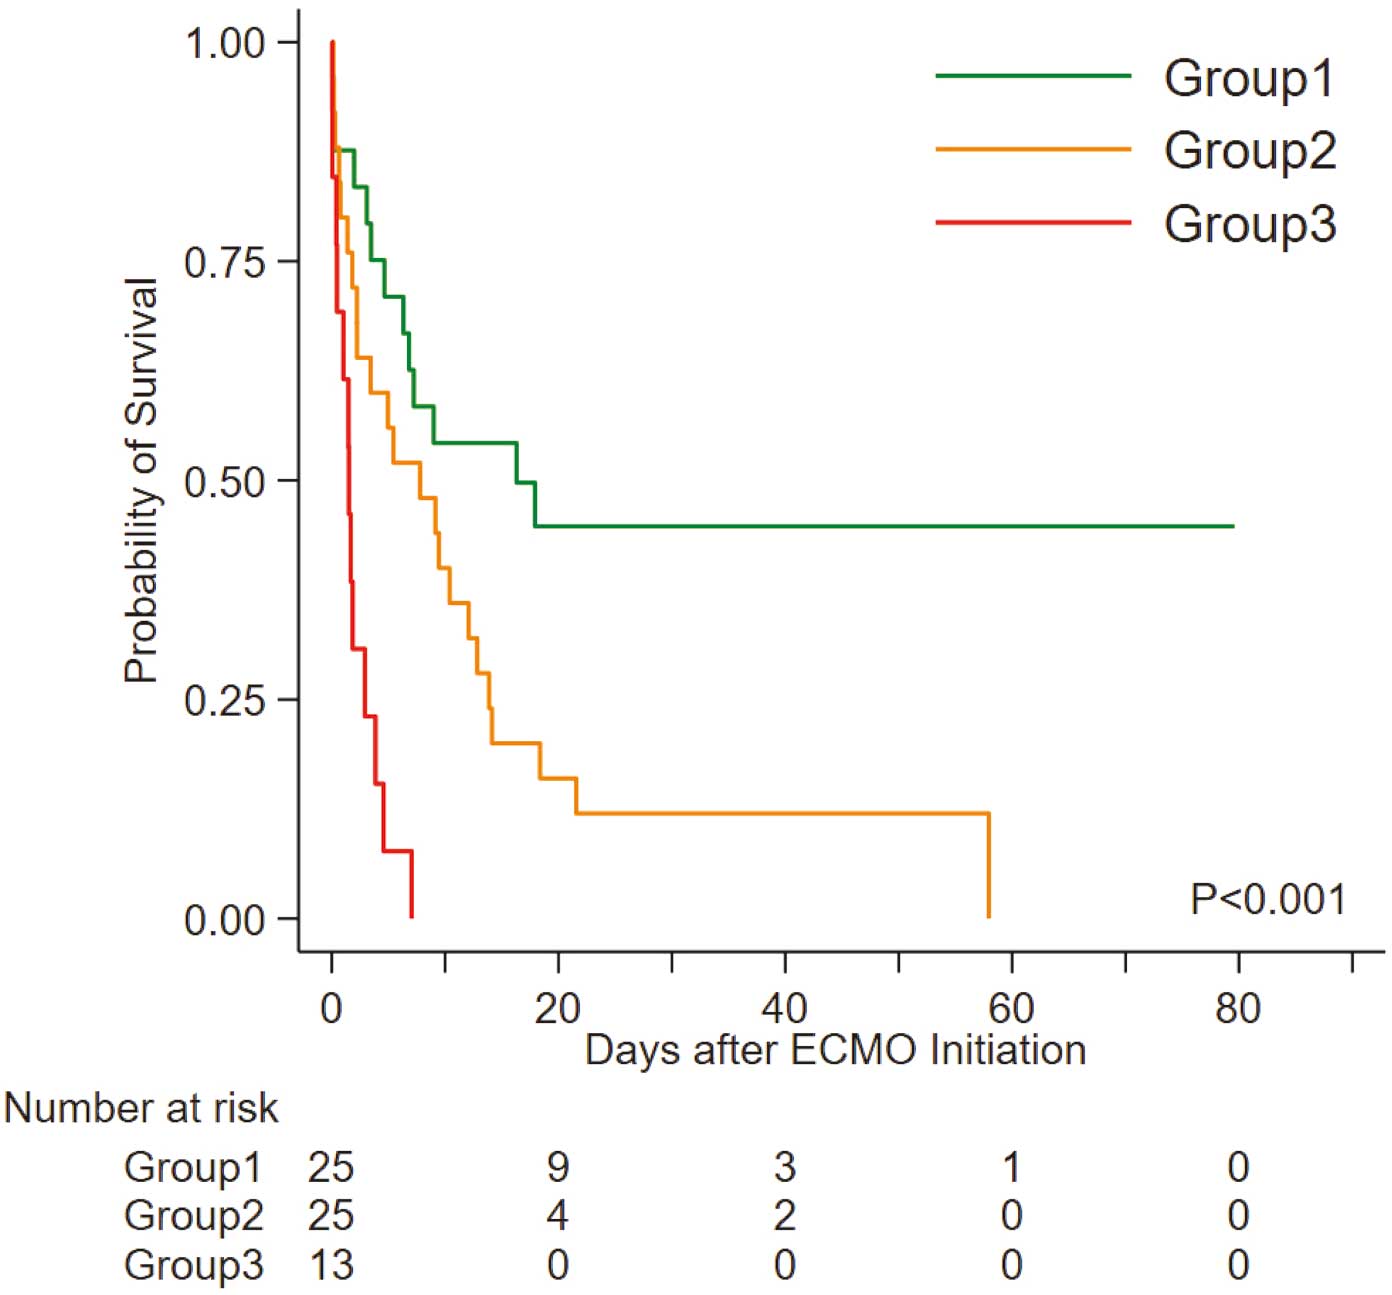
The Cox PH model revealed that the hazard ratio (HR) for all-cause mortality in each group increased with increasing category number (Table 3). Specifically, compared with Group 1, Group 2 had a significantly higher risk of in-hospital mortality (HR 2.25; 95% CI 1.13–4.46), and that risk increased further in Group 3 (HR 7.60; 95% CI 3.21–17.95; P=0.0016, Wald test comparing coefficients of Groups 2 and 3;
Table 3). Internal validation using bootstrap replication analysis of the Cox PH model indicated that the categories significantly associated with mortality risk in patients undergoing VA-ECMO were Group 2 (HR 2.24; 95% CI 1.12–4.84) and Group 3 (HR 7.91; 95% CI 3.61–7.91;
Table 3). In addition, using the Cox PH model to analyze 46 subjects who underwent revascularization therapy (stenting) revealed that subgrouping (Figure 2) was significantly associated with increased mortality risk (Supplementary Table 1), whereas these associations were not significant when 18 subjects who did not undergo revascularization therapy were analyzed (Supplementary Table 2).
Table 3.
Relationships Between Risks for All-Cause Mortality in Each Group Based on Group Classification and Regression Tree Survival Analysis (n=63)
| |
No. at risk |
No. deaths |
HR (95% CI) |
P value |
Bootstrap replication
HR (95% CI) |
| Group 1 |
25 |
13 |
1.00 |
– |
1.00 |
| Group 2 |
25 |
23 |
2.25 (1.13, 4.46) |
0.021 |
2.24 (1.12, 4.84) |
| Group 3 |
13 |
13 |
7.60 (3.21, 17.95) |
<0.001 |
7.91 (3.61, 20.69) |
Patients were divided into different groups based on the presence of hyperglycemia and thrombocytopenia: Group 1, patients with neither hyperglycemia nor thrombocytopenia; Group 2, patients with hyperglycemia; and Group 3, patients with hyperglycemia plus thrombocytopenia. CI, confidence interval; HR, hazard ratio.
In addition to survival tree analysis with hierarchical subgrouping, a different type of survival analysis was performed using hyperglycemia (≥213 mg/dL) and thrombocytopenia (platelets ≤145,100/μL) as independent risk factors for mortality in patients undergoing VA-ECMO. That analysis confirmed that these 2 risk factors have a combinatorial effect in terms of patients’ mortality risk (Supplementary Table 3).
Discussion
This single-center retrospective cohort study analyzed survival data of patients to identify clinical factors significantly associated with mortality after VA-ECMO in patients with AMI. The estimated median survival time of patients was 6.3 days, and the estimated survival rate during the in-hospital period was 22.2%. In this study, a reported history of diabetes or chronic kidney disease was not significantly associated with mortality, nor was AMI location. It is possible that these parameters are common risk factors for mortality in all AMI patients, including those with lethal conditions requiring VA-ECMO and those with non-lethal conditions not requiring VA-ECMO.15
We note that our results are in accord with previous studies analyzing only patients with lethal conditions who underwent VA-ECMO.9,19
Exploratory survival tree analysis after variable selection using univariate Cox PH models revealed 3 patient groups based on mortality risk after VA-ECMO started. These categories were determined by first subdividing patients based on circulating glucose concentrations, with patients with serum glucose concentrations ≥213 mg/dL categorized as having a relatively poorer prognosis (Figure 3). We then further subdivided the high-glucose group based on platelet counts at the time of initial examination. Subjects with combined hyperglycemia (glucose ≥213 mg/dL) and thrombocytopenia (platelet count ≤145,100/μL) were classified as having the worst prognosis (Group 3 in
Figure 3). Hyperglycemia is often clinically defined as circulating glucose concentrations ≥200 mg/dL and thrombocytopenia is defined as platelet counts <150,000/μL.20,21
Thus, our criteria represent reasonable values relative to the clinical situation. We conclude that our model could be used to predict outcomes of patients receiving VA-ECMO due to AMI. Interestingly, an association between groups defined here and mortality risk was relatively clear, particularly in patients who underwent revascularization therapy after successful induction of VA-ECMO, as opposed to those who were unable to undergo revascularization therapy.
Clinically, patients with high blood glucose concentrations are reportedly more likely to have a higher incidence of coronary no reflow by echocardiography after successful reperfusion by percutaneous coronary intervention, regardless of diabetes complications.22,23
Furthermore, whether patients are diagnosed with diabetes or not, increased blood glucose concentrations at the time of hospital admission are significantly associated with a high risk of in-hospital mortality in patients with AMI.23–28
In our survival tree model, increased circulating glucose concentrations (≥213 mg/dL) at the initial medical examination were the first node used to determine patient mortality. Others have reported that hyperglycemia (blood glucose ≥200 mg/dL) is associated with increased mortality in AMI,20,23,26
indicating that, overall, high blood glucose is a crucial predictor of mortality in patents with myocardial infarction, including those undergoing VA-ECMO.
Transient increases in blood glucose due to disease-dependent severe stress are known as “stress hyperglycemia”.20,29
Cardiac arrest observed in patients with myocardial infarction also causes stress hyperglycemia by increasing stress hormone levels, including catecholamines and cortisol, as well as various inflammatory cytokines and circulating fatty acids.20,25,30,31
Acute transient hyperglycemia can lead to endothelial dysfunction and vascular constriction.32,33
Acute hyperglycemia also activates a prothrombogenic cascade by shortening the half-life of fibrinogen and increasing concentrations of prothrombin fragments and Factor VII.34–37
Furthermore, stress hyperglycemia promotes platelet activation in patients with diabetes and accelerates platelet-dependent thrombosis in patients with coronary artery disease.38,39
Thus, microcirculation dysfunction induced by stress hyperglycemia can cause tissue damage in vivo.22,38
However, because stress hyperglycemia-induced conditions are not well-managed, hospitalized patients with hyperglycemia are often treated with insulin to lower blood glucose.20,40
Future clinical investigations are needed to determine whether insulin therapy enhances the survival of AMI patients undergoing VA-ECMO.
There are several reports that even mild thrombocytopenia (a platelet count of <15×104/μL) is significantly associated with increased mortality risk in patients with AMI or IHD after percutaneous coronary intervention using a drug-eluting stent.21,41–43
These reports suggest that the mechanism underlying increased mortality risk by thrombocytopenia involves increased bleeding and complications. In particularly, during VA-ECMO treatment, circulating platelet counts can decrease even further in some patients due to the adsorption of platelets to the ECMO circuits or the lumen of hollow fibers in an artificial lung.44–47
Thus, in the present study, given that patients with and without thrombocytopenia underwent the same VA-ECMO procedure, ECMO-associated acceleration of thrombocytopenia may also increase the risk of complications, such as bleeding from the cannulation site, gastrointestinal hemorrhage, or intracranial hemorrhage.48–50
The mechanisms involved in the development of thrombocytopenia after cardiogenic shock due to myocardial infarction are not yet fully clarified, because multiple complex comorbidities or aging are likely correlated with thrombocytopenia.51
However, we speculate that disseminated intravascular coagulation after cardiogenic shock,52,53
the loss of circulating platelets due to platelet activation,39,54
or impaired vascular function,20,55
all likely induced by stress hyperglycemia, could trigger thrombocytopenia. Given the sequential relationship between stress hyperglycemia and thrombocytopenia, we feel that our hierarchical subgrouping shown in
Figure 2
is biologically relevant.
Limitations of this study include the single-center retrospective design and small sample size. In addition, although the locations of the cardiac arrest (IHCA vs. OHCA) and the absence of cardiac arrest did not differ significantly across our prognostic groups (Supplementary Table 4; P=0.817, Fisher’s exact test), a study enrolling subjects with comparable clinical backgrounds may be preferable. Finally, we did not assess an association between subgroups and mortality risk in patients who did not undergo revascularization therapy after the induction of VA-ECMO because of the small sample size. Thus, additional multicenter studies with large sample sizes are needed to validate our findings.
Conclusions
In the present study targeting patients receiving VA-ECMO for cardiogenic shock due to AMI, we found that hyperglycemia and thrombocytopenia at the initial medical examination were combinatorial risks for increased mortality, especially in subjects who underwent revascularization therapy after successful induction of VA-ECMO.
Acknowledgments
The authors thank the staff of the Department of Molecular Genetics, Kumamoto University, for their support. The authors also thank Tomokazu Ikemoto, MD, PhD, Ryo Hirayama, MD, and Takeshi Sakaguchi, MD (Japanese Red Cross Kumamoto Hospital) for their support with data collection.
Sources of Funding
This study was supported by a grant from the Project for Elucidating and Controlling Mechanisms of Aging and Longevity of the Japan Agency for Medical Research and Development (AMED) to Y. Oike (Grant no. JP19 gm5010002).
Disclosures
The authors declare that they have no conflicts of interest.
IRB Information
This study was approved by the ethics committees for clinical research at the Japanese Red Cross Kumamoto Hospital (No. 396) and Kumamoto University (Rinri No. 2153).
Data Availability
The datasets generated and/or analyzed in this study are not publicly available because they contain sensitive information. However, data are available from the corresponding authors on reasonable request.
Supplementary Files
Please find supplementary file(s);
http://dx.doi.org/10.1253/circrep.CR-21-0043
References
- 1.
World Health Organization. Global health estimates 2016: Deaths by cause, age, sex, by country and by region, 2000–2016. 2018. http://www.who.int/healthinfo/global_burden_disease/estimates/en/ (accessed December 1, 2020).
- 2.
Lurie KG, Nemergut EC, Yannopoulos D, Sweeney M. The physiology of cardiopulmonary resuscitation. Anesth Analg 2016; 122: 767–783.
- 3.
Yannopoulos D, Bartos J, Raveendran G, Walser E, Connett J, Murray TA, et al. Advanced reperfusion strategies for patients with out-of-hospital cardiac arrest and refractory ventricular fibrillation (ARREST): A phase 2, single centre, open-label, randomised controlled trial. Lancet 2020; 396: 1807–1816.
- 4.
Kim SJ, Kim HJ, Lee HY, Ahn HS, Lee SW. Comparing extracorporeal cardiopulmonary resuscitation with conventional cardiopulmonary resuscitation: A meta-analysis. Resuscitation 2016; 103: 106–116.
- 5.
Sung PH, Wu CJ, Yip HK. Is extracorporeal membrane oxygenator a new weapon to improve prognosis in patients with profound cardiogenic shock undergoing primary percutaneous coronary intervention? Circ J 2016; 80: 572–578.
- 6.
Choi KH, Yang JH, Hong D, Park TK, Lee JM, Song YB, et al. Optimal timing of venoarterial-extracorporeal membrane oxygenation in acute myocardial infarction patients suffering from refractory cardiogenic shock. Circ J 2020; 84: 1502–1510.
- 7.
Sasson C, Rogers MA, Dahl J, Kellermann AL. Predictors of survival from out-of-hospital cardiac arrest: A systematic review and meta-analysis. Circ Cardiovasc Qual Outcomes 2010; 3: 63–81.
- 8.
Keebler ME, Haddad EV, Choi CW, McGrane S, Zalawadiya S, Schlendorf KH, et al. Venoarterial extracorporeal membrane oxygenation in cardiogenic shock. JACC Heart Fail 2018; 6: 503–516.
- 9.
Muller G, Flecher E, Lebreton G, Luyt CE, Trouillet JL, Brechot N, et al. The ENCOURAGE mortality risk score and analysis of long-term outcomes after VA-ECMO for acute myocardial infarction with cardiogenic shock. Intensive Care Med 2016; 42: 370–378.
- 10.
Vallabhajosyula S, Prasad A, Bell MR, Sandhu GS, Eleid MF, Dunlay SM, et al. Extracorporeal membrane oxygenation use in acute myocardial infarction in the United States, 2000 to 2014. Circ Heart Fail 2019; 12: e005929.
- 11.
Mizuguchi Y, Konishi T, Nagai T, Sato T, Takenaka S, Tada A, et al. Prognostic value of admission serum magnesium in acute myocardial infarction complicated by malignant ventricular arrhythmias. Am J Emerg Med 2021; 44: 100–105.
- 12.
Choi KH, Yang JH, Park TK, Lee JM, Song YB, Hahn JY, et al. Risk prediction model of in-hospital mortality in patients with myocardial infarction treated with venoarterial extracorporeal membrane oxygenation. Rev Esp Cardiol (Engl Ed) 2019; 72: 724–731.
- 13.
Werdan K, Gielen S, Ebelt H, Hochman JS. Mechanical circulatory support in cardiogenic shock. Eur Heart J 2014; 35: 156–167.
- 14.
Waldmann V, Bougouin W, Karam N, Albuisson J, Cariou A, Jouven X, et al. Sudden cardiac death: A better understanting for a better prevention. Ann Cardiol Angeiol (Paris) 2017; 66: 230–238 (in French).
- 15.
Kimura K, Kimura T, Ishihara M, Nakagawa Y, Nakao K, Miyauchi K, et al; on behalf of the Japanese Circulation Society Joint Working Group. JCS 2018 guideline on diagnosis and treatment of acute coronary syndrome. Circ J 2019; 83: 1085–1196.
- 16.
Zhang H, Singer B. Risk-factor analysis using tree-based stratification. In: Recursive partitioning in the health sciences. Statistics for biology and health. New York: Springer, 1999; 61–69.
- 17.
Morinaga J, Kakuma T, Fukami H, Hayata M, Uchimura K, Mizumoto T, et al. Circulating angiopoietin-like protein 2 levels and mortality risk in patients receiving maintenance hemodialysis: A prospective cohort study. Nephrol Dial Transplant 2020; 35: 854–860.
- 18.
van Putten W. CART: Stata module to perform classification and regression tree analysis, statistical software component S456776. Boston College Department of Economics. 2016. https://econpapers.repec.org/RePEc:boc:bocode:s456776 (accessed September 30, 2021).
- 19.
Sugiura A, Abe R, Nakayama T, Hattori N, Fujimoto Y, Himi T, et al. Predictors of successful weaning from veno-arterial extracorporeal membrane oxygenation after coronary revascularization for acute myocardial infarction complicated by cardiac arrest: A retrospective multicenter study. Shock 2019; 51: 690–697.
- 20.
Dungan KM, Braithwaite SS, Preiser JC. Stress hyperglycaemia. Lancet 2009; 373: 1798–1807.
- 21.
Wang TY, Ou FS, Roe MT, Harrington RA, Ohman EM, Gibler WB, et al. Incidence and prognostic significance of thrombocytopenia developed during acute coronary syndrome in contemporary clinical practice. Circulation 2009; 119: 2454–2462.
- 22.
Iwakura K, Ito H, Ikushima M, Kawano S, Okamura A, Asano K, et al. Association between hyperglycemia and the no-reflow phenomenon in patients with acute myocardial infarction. J Am Coll Cardiol 2003; 41: 1–7.
- 23.
Fujino M, Ishihara M, Honda S, Kawakami S, Yamane T, Nagai T, et al. Impact of acute and chronic hyperglycemia on in-hospital outcomes of patients with acute myocardial infarction. Am J Cardiol 2014; 114: 1789–1793.
- 24.
Capes SE, Hunt D, Malmberg K, Gerstein HC. Stress hyperglycaemia and increased risk of death after myocardial infarction in patients with and without diabetes: A systematic overview. Lancet 2000; 355: 773–778.
- 25.
Deedwania P, Kosiborod M, Barrett E, Ceriello A, Isley W, Mazzone T, et al. Hyperglycemia and acute coronary syndrome: A scientific statement from the American Heart Association Diabetes Committee of the Council on Nutrition, Physical Activity, and Metabolism. Circulation 2008; 117: 1610–1619.
- 26.
Ishihara M, Kojima S, Sakamoto T, Asada Y, Tei C, Kimura K, et al. Acute hyperglycemia is associated with adverse outcome after acute myocardial infarction in the coronary intervention era. Am Heart J 2005; 150: 814–820.
- 27.
Timmer JR, van der Horst IC, Ottervanger JP, Henriques JP, Hoorntje JC, de Boer MJ, et al. Prognostic value of admission glucose in non-diabetic patients with myocardial infarction. Am Heart J 2004; 148: 399–404.
- 28.
Straumann E, Kurz DJ, Muntwyler J, Stettler I, Furrer M, Naegeli B, et al. Admission glucose concentrations independently predict early and late mortality in patients with acute myocardial infarction treated by primary or rescue percutaneous coronary intervention. Am Heart J 2005; 150: 1000–1006.
- 29.
McCowen KC, Malhotra A, Bistrian BR. Stress-induced hyperglycemia. Crit Care Clin 2001; 17: 107–124.
- 30.
Marfella R, Siniscalchi M, Esposito K, Sellitto A, De Fanis U, Romano C, et al. Effects of stress hyperglycemia on acute myocardial infarction: Role of inflammatory immune process in functional cardiac outcome. Diabetes Care 2003; 26: 3129–3135.
- 31.
Mizock BA. Alterations in carbohydrate metabolism during stress: A review of the literature. Am J Med 1995; 98: 75–84.
- 32.
Kawano H, Motoyama T, Hirashima O, Hirai N, Miyao Y, Sakamoto T, et al. Hyperglycemia rapidly suppresses flow-mediated endothelium-dependent vasodilation of brachial artery. J Am Coll Cardiol 1999; 34: 146–154.
- 33.
Williams SB, Goldfine AB, Timimi FK, Ting HH, Roddy MA, Simonson DC, et al. Acute hyperglycemia attenuates endothelium-dependent vasodilation in humans in vivo. Circulation 1998; 97: 1695–1701.
- 34.
Sakamoto T, Ogawa H, Kawano H, Hirai N, Miyamoto S, Takazoe K, et al. Rapid change of platelet aggregability in acute hyperglycemia: Detection by a novel laser-light scattering method. Thromb Haemost 2000; 83: 475–479.
- 35.
Ceriello A, Giacomello R, Stel G, Motz E, Taboga C, Tonutti L, et al. Hyperglycemia-induced thrombin formation in diabetes: The possible role of oxidative stress. Diabetes 1995; 44: 924–928.
- 36.
Ceriello A, Giugliano D, Quatraro A, Dello Russo P, Marchi E, Torella R. Hyperglycemia may determine fibrinopeptide A plasma level increase in humans. Metabolism 1989; 38: 1162–1163.
- 37.
Ceriello A, Giugliano D, Quatraro A, Dello Russo P, Torella R. Blood glucose may condition Factor VII levels in diabetic and normal subjects. Diabetologia 1988; 31: 889–891.
- 38.
Gresele P, Guglielmini G, De Angelis M, Ciferri S, Ciofetta M, Falcinelli E, et al. Acute, short-term hyperglycemia enhances shear stress-induced platelet activation in patients with type II diabetes mellitus. J Am Coll Cardiol 2003; 41: 1013–1020.
- 39.
Shechter M, Merz CN, Paul-Labrador MJ, Kaul S. Blood glucose and platelet-dependent thrombosis in patients with coronary artery disease. J Am Coll Cardiol 2000; 35: 300–307.
- 40.
Malmberg K, Ryden L, Efendic S, Herlitz J, Nicol P, Waldenstrom A, et al. Randomized trial of insulin-glucose infusion followed by subcutaneous insulin treatment in diabetic patients with acute myocardial infarction (DIGAMI study): Effects on mortality at 1 year. J Am Coll Cardiol 1995; 26: 57–65.
- 41.
Park S, Ahn JM, Kim TO, Park H, Cho SC, Kang DY, et al. Incidence and impact of thrombocytopenia in patients undergoing percutaneous coronary intervention with drug-eluting stents. Am J Cardiol 2020; 134: 55–61.
- 42.
Rubinfeld GD, Smilowitz NR, Berger JS, Newman JD. Association of thrombocytopenia, revascularization, and in-hospital outcomes in patients with acute myocardial infarction. Am J Med 2019; 132: 942–948.e945.
- 43.
Ito S, Watanabe H, Morimoto T, Yoshikawa Y, Shiomi H, Shizuta S, et al. Impact of baseline thrombocytopenia on bleeding and mortality after percutaneous coronary intervention. Am J Cardiol 2018; 121: 1304–1314.
- 44.
Millar JE, Fanning JP, McDonald CI, McAuley DF, Fraser JF. The inflammatory response to extracorporeal membrane oxygenation (ECMO): A review of the pathophysiology. Crit Care 2016; 20: 387.
- 45.
Usui A, Hiroura M, Kawamura M. Heparin coating extends the durability of oxygenators used for cardiopulmonary support. Artif Organs 1999; 23: 840–844.
- 46.
Gemmell CH, Ramirez SM, Yeo EL, Sefton MV. Platelet activation in whole blood by artificial surfaces: Identification of platelet-derived microparticles and activated platelet binding to leukocytes as material-induced activation events. J Lab Clin Med 1995; 125: 276–287.
- 47.
Mammen EF, Koets MH, Washington BC, Wolk LW, Brown JM, Burdick M, et al. Hemostasis changes during cardiopulmonary bypass surgery. Semin Thromb Hemost 1985; 11: 281–292.
- 48.
Atkinson TM, Ohman EM, O’Neill WW, Rab T, Cigarroa JE, Interventional Scientific Council of the American College of Cardiology. A practical approach to mechanical circulatory support in patients undergoing percutaneous coronary intervention: An interventional perspective. JACC Cardiovasc Interv 2016; 9: 871–883.
- 49.
Abrams D, Combes A, Brodie D. Extracorporeal membrane oxygenation in cardiopulmonary disease in adults. J Am Coll Cardiol 2014; 63: 2769–2778.
- 50.
Paden ML, Conrad SA, Rycus PT, Thiagarajan RR, Registry E. Extracorporeal life support organization registry report 2012. ASAIO J 2013; 59: 202–210.
- 51.
Yadav M, Genereux P, Giustino G, Madhavan MV, Brener SJ, Mintz G, et al. Effect of baseline thrombocytopenia on ischemic outcomes in patients with acute coronary syndromes who undergo percutaneous coronary intervention. Can J Cardiol 2016; 32: 226–233.
- 52.
Gando S, Wada T. Disseminated intravascular coagulation in cardiac arrest and resuscitation. J Thromb Haemost 2019; 17: 1205–1216.
- 53.
Wada T. Coagulofibrinolytic changes in patients with post-cardiac arrest syndrome. Front Med (Lausanne) 2017; 4: 156.
- 54.
Stegenga ME, van der Crabben SN, Levi M, de Vos AF, Tanck MW, Sauerwein HP, et al. Hyperglycemia stimulates coagulation, whereas hyperinsulinemia impairs fibrinolysis in healthy humans. Diabetes 2006; 55: 1807–1812.
- 55.
Risso A, Mercuri F, Quagliaro L, Damante G, Ceriello A. Intermittent high glucose enhances apoptosis in human umbilical vein endothelial cells in culture. Am J Physiol Endocrinol Metab 2001; 281: E924–E930.
