Ectopic Expression of Syntaxin3 Affects Behaviors of B16 Melanoma by Controlling Actin Dynamics
2013 年 38 巻 1 号 p. 97-107

詳細
2013 年 38 巻 1 号 p. 97-107
The melanin granules are synthesized in melanocytes in the epidermal basal layer and the hair matrix. For the effective passage of melanin granules to the adjacent keratinocytes, melanocytes utilize unique cytoplasmic delivery system in which cytoskeletal network is prominently involved. Here, we show that the t-SNARE protein syntaxin3, a member of a family of key mediators of the cytoplasmic vesicle fusion and potent modulators of cytoskeletal dynamics, dramatically affects melanocyte cell behavior. Although plasmalemmal syntaxin3 has been detected also on the melanosomes of normal human melanocytes, we noticed that mouse melanoma B16 cells had completely lost endogenous syntaxin3. In response to the forcible expression of syntaxin3, B16 cells formed well-developed dendritic filopodia and accumulated melanin granules in the cytoplasm. We found that exogenous syntaxin3 was not expressed at the plasma membrane, but rather, localized with non-fibrous F-actin and melanin-packed melanosomes in the cytoplasm, by which the assembly/polymerization of actin was dramatically impacted and the melanosome secretion was severely suppressed. The syntaxin3-triggered phenotypic changes were also induced by a syntaxin3 mutant lacking SNARE and transmembrane domains, and they were completely reverted by the subsequent knockdown of exogenous syntaxin3. This t-SNARE protein may act as a regulator of the actin dynamics, rather than a direct vesicle fusion mediator, to determine the fundamental properties of melanocytes.
Melanocytes are scattered about basal layer of skin epidermis and the hair matrix in hair bulbs. They produce melanin granules and transfer the granule-containing melanosomes to adjacent keratinocytes, thus inducing epidermal/hair pigmentation (Hirobe, 1995; Kondo and Hearing, 2011). In the melanocyte cytoplasm, melanin exerts an intrinsically cohesive effect which gives rise to the large granules in a lysosome-related organelle melanosome. The melanosome is enclosed in lipid bilayer membrane in melanocyte cytoplasm, and various processes for its transfer to keratinocytes have been demonstrated, e.g., endocytosis of melanosomes secreted from melanocytes (Swift, 1964; Yamamoto and Bhawan, 1994), phagocytosis of the pigmented dendritic protrusions of melanocytes (Mottaz and Zelickson, 1967; Seiberg, 2001) and the free diffusion of cytoplasmic granules upon cell fusion of these cell types (Van Den Bossche et al., 2006). In this regard, the melanocyte cell shape and the scaffolding for melanosome delivery are considered crucial for subsequent intercellular transport (Wu and Hammer, 2000). The nascent melanosomes, which are associated with a GTP-bound form of Rab27A, are bound by the synaptotagmin-like effectors Slac2a and Slp2a and delivered to the cell periphery along microtubules and F-actin (Fukuda and Kuroda, 2002; Kuroda and Fukuda, 2005). At the peripheral dendritic filopodia, the locomotion of the melanosome-Slac2a complexes is strictly controlled by actin fibers (Kuroda and Fukuda, 2005; Passeron et al., 2004). Slp2a has C2 domains that enable an interaction with phos-phatidylserine and phosphatidylinositol 4,5-bisphosphate as well as certain t-SNARE syntaxins at the plasma membrane (Gaffaney et al., 2008; Stein et al., 2007). Recent investigations have demonstrated an association of certain syntaxins, such as syntaxin2 and 4, to the actin cytoskeleton in addition to direct interaction with v-SNARE proteins in various cell types (Band et al., 2002; Jewell et al., 2008; Woronowicz et al., 2010). For example, syntaxin4 was shown to interact with F-actin-severing protein gelsolin via its N-terminal helical domain to regulate the exocytosis of insulin granules (Kalwat et al., 2012). Thus, syntaxins potentially have the capacity to impact the peripheral transport of melanosomes as well as the morphological appearance of melanocytes.
The t-SNARE syntaxins comprise a large protein family, the members of which participate in the membrane fusion that occurs between cytoplasmic intracellular vesicles, or an intracellular vesicle and cell membrane (Blakely and Sung, 2000; Mostov et al., 2000). Among the plasmalemmal syntaxins, syntaxin1 is highly specific to nerve cells while syntaxin2, 3, and 4 display a rather ubiquitous distribution pattern in tissues and cells (Bennett et al., 1993). Previous analyses showed syntaxin3 to be selectively detectable at the lipid bilayer of zymogen granules in pancreatic acinar cells and melanosomes in normal melanocytes (Chi et al., 2006; Gaisano et al., 1996). While the subpopulations of syntaxin2 and 4 have been thought to translocate across the membrane in response to external stimuli to activate signaling functions (Hirai et al., 2007, 2001, 1992; Kadono et al., 2012; Radisky et al., 2003, 2009), the extracellular presentation and function of syntaxin3 has not yet been detected.
In the present study, we noticed the absence of endogenous syntaxin3 in B16 melanoma cells that are characterized by sparse dendritic projections with an active secretion of pigmented melanosomes into the medium. Using this cell type and also the syntaxin3-possessing melanoma cell line HMVII, we analyzed the role of syntaxin3 in this melanocyte behavior. We found that syntaxin3 dramatically impacted the cell morphology and the melanosome secretion profile along with an effect on actin polymerization dynamics. These results provide new insight into the molecular mechanisms underlying the intercellular transport and extracellular secretion of melanin particles which result in keratinocyte pigmentation.
Mouse melanoma B16 cells (Riken RCB 0557) and human melanoma HMV-II cells (Riken RCB 0777) were grown in phenol red-free DMEM/Ham F12 medium (Life Technologies, Tokyo, Japan) supplemented with 10% FCS (rfDH10) along with penicillin and streptomycin as described previously (Gabri et al., 2009). Normal human melanocytes Hermes 1 cells (Sviderskaya et al., 2003) were obtained from St George’s Cell Bank (Bennett et al., 1985) and maintained in RPMI-1640 medium supplemented with 10% fetal calf serum, 200 nM 12-O-tetradecanoylphorbol-13-acetate, 200 pM cholera toxin (Sigma-Aldrich, St. Louis, MO), 10 ng/ml human stem cell factor (QIAGEN, Tokyo, Japan) and 10 nM endothelin 2 (Sigma-Aldrich, St. Louis, MO).
Constructs and transfectionTo construct the expression vector for syntaxin3 or that lacking the SNARE and transmembrane domain, the cDNA encoding mouse syntaxin3 (NCBI-GeneID: 20908) or its deletion mutant (amino acid 1∼187) linked to T7-tag was generated by PCR and subcloned into the EcoR I site of the mammalian expression vector pQCXIN (Life Technologies, Tokyo, Japan) as previously described for syntaxin2 and 4 (Hirai et al., 2007; Kadono et al., 2012). The mouse melanoma B16 cells, which lack endogenous syntaxin3, were transfected with the mouse syntaxin3 expression plasmid with the Lipofectamine 2000 (Life Technologies, Tokyo, Japan) following the manufacturer’s protocol. The surviving cell populations in 400 μg/ml G418-containing medium, which should express both neomycin resistant and syntaxin3 genes connected by an IRES sequence, were collected and expanded without cloning so as to avoid the clonal artifacts. To construct a shRNA plasmid for syntaxin3 knockdown, the following DNAs phosphorylated at the 5′ end were synthesized and annealed. The synthesized DNAs for human syntaxin3 knockdown were 5′-GATCCGCAGCTCACGACTGAGATTAATTCAAGAGATTAATCTCAGTCGTGAGCTGCTTTTTTG-3′ and 5′-AATTCAAAAAAGCAGCTCACGACTGAGATTAATCTCTTGAATTAATCTCAGTCGTGAGCTGCG-3′. Those for mouse syntaxin3 knockdown were 5′-GATCCGCACCAATCAACTGTTTATTATTCAAGAGATTAATCTCAGTCGTGAGCTGCTTTTTTG-3′ and 5′-AATTCAAAAAAGCACCAATCAACTGTTTATTATCTCTTGAATAATAAACAGTTGATTGGTGCG-3′. The obtained double-stranded DNA was then subcloned into the Bam HI/Eco RI site of a shRNA vector pSIREN (Takara Bio, Japan). To knockdown syntaxin3 in B16 cells that has been introduced with mouse syntaxin3 or in human HMV-II cells, the cells were transfected with the mouse or human syntaxin3-shRNA plasmid, respectively, and clones which survived in DH10 medium containing puromycin (2 μg/ml) were isolated. Among the isolated clones, those which appeared to down-modulate the expression of syntaxin3 were mixed for each category. As controls, B16 and HMV-II cells transfected with the empty pQCXIN (for the expression plasmid) or pSIREN (for the shRNA plasmid) were generated and used for the following experiments. The expression level of syntaxin3 in these transfectants was analyzed by Western blotting.
RT-PCRThe total RNAs extracted from the cells using an RNeasy™ mini kit (QIAGEN, Tokyo, Japan) were converted to cDNA with RNA-PCR kit (Takara Bio, Japan). The cDNA fragments of the target genes were amplified by PCR for 30 cycles. The primer pairs used for mouse syntaxin1, 2, 3, 4 and GAPDH were 5′-GAACAAAGTTCGCTCCAAGC-3′ and 5′-ATTCCTCACTGGTCGTGGTC-3′, 5′-CATAGCCAGGATTGCTCAGC-3′ and 5′-CCATGAACATCTCGTGCAGC-3′, 5′-GATACCAAAAAGGCGGTCAA-3′ and 5′-TGAGGAAGACTGAGGGGAGA-3′, 5′-GTCTGACGAGGAGCTGGAAC-3′ and 5′-CCGAGCTCAGGATGTTCTTC-3′, and 5′-GGATTTGGCCGTATTGG-3′ and 5′-TCATGGATGACCTTGGC-3′, respectively.
Immunodetection procedureImmunocytochemistry and Western blotting were carried out as described previously (Hirai et al., 2007, 1989). For immunocytochemistry, cells cultured on a chamber slide (Thermo Scientific, Japan) coated with 0.1% gelatin were fixed with 4% paraformaldehyde and permeabilized with −20°C methanol or 0.1% Triton X100. The pretreated cells on the chamber slides or PVDF membranes onto which protein bands in SDS-PAGE gel had been transferred, were incubated with Tris-buffered saline (TBS) containing 5% skim milk (STBS), primary antibody solution in STBS and the secondary antibodies in STBS, with an extensive washing with TBS at each interval. The primary antibodies include antibodies to T7-tag (Novagen-Merck, Japan), syntaxin2 (Hirai et al., 1998), syntaxin3, syntaxin4 (MBL, Nagoya, Japan) and β-actin (Sigma-Aldrich, St. Louis, MO). The secondary antibodies were Cye3-, Alexa488- (for immunocytochemistry) or HPR-labeled anti-mouse or -rabbit antibodies (GE Healthcare, UK). For the anti-β-actin antibody, the HRP-labeled or unlabeled form of the same monoclonal antibody (Sigma-Aldrich, clone AC-15) that had been shown to dominantly recognize monomeric G-actin (Hotulainen et al., 2005) was used. To detect polymerized F-actin in the cells, Alexsa488-labeled phalloidin (Life Technologies, Japan) was used instead of the primary and secondary antibodies. The cell nuclei were counterstained with DAPI (Sigma-Aldrich, St. Louis, MO) in some of the cell samples.
Quantification of the length of the filopodia and the number of intracellular stress fibersCells stained with Alexa488-phalloidin were photographed and filopodium length and stress fiber number were analyzed in 70 randomly selected cells for each category. The thin (less than 0.1 μm in diameter) phalloidin-positive protrusions that extended at least 0.75 μm from the cell margin were defined as filopodia, as described previously (Berg and Cheney, 2002; Gerhardt et al., 2003; Raines et al., 2012). The phalloidin-stained fiber structures greater than 1 μm in diameter that extended at least 20 μm-long across the cell body, and not those at the cell periphery, were treated as stress fibers in this study.
Cell mobility and adhesion assayFor the cell mobility assay, part of the monolayer cultured-cells was scraped and the cellular migratory distance from the edge of the remaining cell area was measured after 58 hours. For cell adhesion assay, 5×10⁴ cells suspended in rfDH10 were seeded onto 6-well plate. After incubation for one hour, the wells were gently washed once with PBS and cells bound to and spread on the substrate were counted in randomly selected four areas (6 mm2). The ratio of the spreading cells in fifty adherent cells were calculated for each category.
Determination of the ratio of monomeric G-actinThe samples from the same number of B16 derivatives were loaded into Native polyacrylamide gel electrophoresis (Native-PAGE) using NativePAGE™ Novex Bis-Tris Gel system (Life Technologies, Japan), following the manufacturer’s protocol. The gels were then soaked in SDS-PAGE running buffer for 10 minutes and the protein bands in the gel were transferred to PVDF membrane. The monomeric form of actin in each sample was detected with a monoclonal antibody to monomeric G-actin (anti-β-actin antibody; Sigma-Aldrich, cloneAC-15) on the blot. The rest of the samples were mixed with the same volume of X2 SDS-sample buffer containing 2-mercaptethanol, and the total actin including depolymerized F-actin was analyzed using the conventional SDS-PAGE and Western blotting. The amount of monomeric and total actin on the blots was quantified using a Las1000Plus image analyzer (Fuji film, Japan).
Melanosome secretion from B16 melanoma cellsThe secretion of melanin granules was quantified by analyzing the turbidity (measuring the O.D. at 450 nm in this study) of samples in rfDH10 containing 1% triton X-100 (rfDH10-T1). The cells were seeded onto 6-well plates (2.0×10⁵ cells/well) and incubated for seven days without medium change. To prepare the supernatant samples, the supernatant of the B16 derivatives was centrifuged at 1,000 rpm for 1 minute to remove cell debris and mixed with 1/9 volume of rfDH10 containing 10%/triton X-100. For the cell samples, the cells remaining on each dish were washed with PBS, lysed in 1 ml of rfDH10-T1 for 10 minutes, sonicated and centrifuged to remove the remaining insoluble materials. Based on the calibration curve prepared with a certain amount of melanin (Sigma-Aldrich, MO) suspended in rfDH10-T1, all the O.D. values in cell and supernatant samples should reflect the concentration of melanin granules. The amounts of secreted melanosomes from supernatant and non-secreted melanosomes from the cell lysate were calculated for each category, and the secreted proportion in total melanosomes and the relative ratio of secreted/non-secreted melanosomes were calculated.
Statistical analysesThe results are expressed as the mean±S.D. of at least three independent experiments. Data were analyzed using Mann-Whitney U-test, and a p-value of <0.1 was considered statistically significant.
The following cell types were used as model melanocyte cells: Hermes 1, which is a normal human melanocyte having a spindle-like shape with two long dendrites towards the opposite direction of the cell body. They grew very slowly and had very few pigmented melanin granules. B16 cells from a malignant mouse melanoma exhibited a relatively compact morphology along with the production of a large number of pigmented melanosomes. HMV-II cells obtained from a human vaginal melanoma displayed a very low level of pigmented granules (Fig. 1A). To address the relationship between these phenotypic features and the expression profile of the canonical plasmalemmal syntaxins, we first tested the endogenous expression of the canonical syntaxins 2, 3 and 4 by Western blot analysis. We found Hermes1 and HMV-II cells expressed both syntaxin2 and 3, but not syntaxin4, whereas B16 cells possessed abundant syntaxin4 but no expression of syntaxin3 (Fig. 1B). The transcription in this cell type of syntaxin4, but not syntaxin3, was confirmed by RT-PCR analysis (Fig. 1C). The difference in the expression profile of syntaxin3 and 4 implies an involvement of these syntaxins in melanocyte cell behavior. As the previous proteomic analyses had demonstrated the selective existence of syntaxin3 in the melanosome of normal human melanocytes (Chi et al., 2006), we decided to characterize the role of syntaxin3 using B16 cells.

Model cells. A, Phase contrast (left panel) and bright field (right panel) images of human normal melanocyte Hermes1 (upper), mouse melanoma B16 (middle) and human melanoma HMV-II (Lower) cells. Bar, 100 μm. B, Western blot analyses of the expression of plasmalemmal syntaxins in the model cells with anti-syntaxin2, 3 and 4 antibodies. The syntaxin3 protein was undetectable in B16 cells. C, RT-PCR analysis confirmed the lack of endogenous syntaxin3 in B16 cells.
At first, B16-derived transfectants were generated in which exogenous mouse syntaxin3 was stably expressed in an N-terminally tagged form and the expression of the transgene was again suppressed by shRNA-mediated knockdown (Fig. 2A). While expression level of syntaxin3 was satisfactory changed in these transfectants (Fig. 2A), that of other plasmalemmal syntaxins, syntaxin2 or 4, was not altered (supplementary Fig. 1). HMV-II cells with a reduction of endogenous syntaxin3 were also prepared (Fig. 2A). Although G-actin in the control B16 cells was distributed uniformly in the cytoplasm and F-actin formed well-developed longitudinal stress fibers across the cell body, dramatic changes in the morphological appearances were induced when these cells were introduced with exogenous syntaxin3. The syntaxin3-expressing B16 cells often formed thick sprouts, the tips of which contained G-actin (about 30% cells), with a striking accumulation of F-actin at the cell periphery (Fig. 2B and Fig. 3D). Concomitantly, F-actin-filled filopodia vigorously sprouted out and the stress fiber structures across the cell body soon disappeared (Fig. 2B and Fig. 3D). Accompanying the actin fiber rearrangement, cell mobility and substrate adherence were significantly enhanced in these syntaxin3-expressing cells, and all of these phenotypic features were clearly receded when synatxin3 expression was suppressed again by shRNA-mediated knockdown (Fig. 2B and Fig. 3A, B and D). Similar, but much weaker morphological changes were observed when the same cells were introduced with syntaxin2 (data not shown). In HMV-II cells, syntaxin3 knockdown also resulted in the retraction of the G-actin-containing thick sprouts (Fig. 2C). It is noteworthy that the forcibly expressed syntaxin3 was partly co-localized with the non-fibrous F-actin recognized by phalloidin in the cytoplasm (Fig. 2D), although this protein is widely recognized as a plasma membrane-anchored t-SNARE protein in other cell types (Sharma et al., 2006; Torres et al., 2011).

Effect of forced expression and gene knockdown of syntaxin3 in the model cells. A, (Upper), schematic images of the experimental procedure. To generate B16 cells expressing T7-tagged syntaxin3 (stx3), cells were transfected with an expression vector having T7-syntaxin3 transgene, the neomycin-resistance gene and the IRES sequence nested between them, followed by selection using by G418. For syntaxin3-knockdown, B16 cells that have been introduced with syntaxin3 or HMV-II cells that possess endogenous syntaxin3 were transfected with the shRNA plasmid for mouse syntaxin3 or human syntaxin3, respectively, and selected with puromycin followed by the isolation of the clonal populations. Lower, the expression of syntaxin3 in the generated cells was analyzed by Western blotting, using an anti-T7 antibody (for B16 cells) or anti-syntaxin3 antibodies (for HMV-II cells). As B16 derivatives, cells expressing exogenous syntaxin3 (stx3) and those in which the introduced transgene was effectively deregulated (stx3-▴stx3) were obtained. Left, different amounts of the cell lysates were analyzed for each category. HMV-II derivatives, in which endogenous syntaxin3 was knocked down were also isolated (▴stx3). As controls, the empty pQCXIN or pSIREN plasmid was introduced into the parent cells (empty). B, Localization of G-actin (upper) and F-actin (lower) in the generated B16 derivatives. In response to the forced expression of syntaxin3, some cells formed thick sprouts containing G-actin (about 30% of B16-stx3 vs. 0% of B16-empty and B16-stx3-▴stx3) (arrows), whereas F-actin which was spread across the cell body (arrow heads), but not that in the cell periphery, disappeared. The fiber actin assembly was reconstructed again by the deregulation of syntaxin3. Syntaxin3 expression also accelerated the formation and elongation of the dendritic filopodial structures (*). Bar, 20 μm. C, The syntaxin3-expressing HMV-II cells (empty) exhibited G-actin-accumulated sprouts (arrows) as observed in syntaxin3-introduced B16 cells (B, upper middle), which were vanished by the stntaxin3-knockdown (▴stx3). Bar, 20 μm. D, Dark background with high contrast images of syntaxin3-expressing B16 cells demonstrated the partial co-localization of syntaxin3 (red) and the non-fibrous F-actin (green) (arrows). Bar, 20 μm. Right most panel, the magnified image from the boxed region in the middle panel.
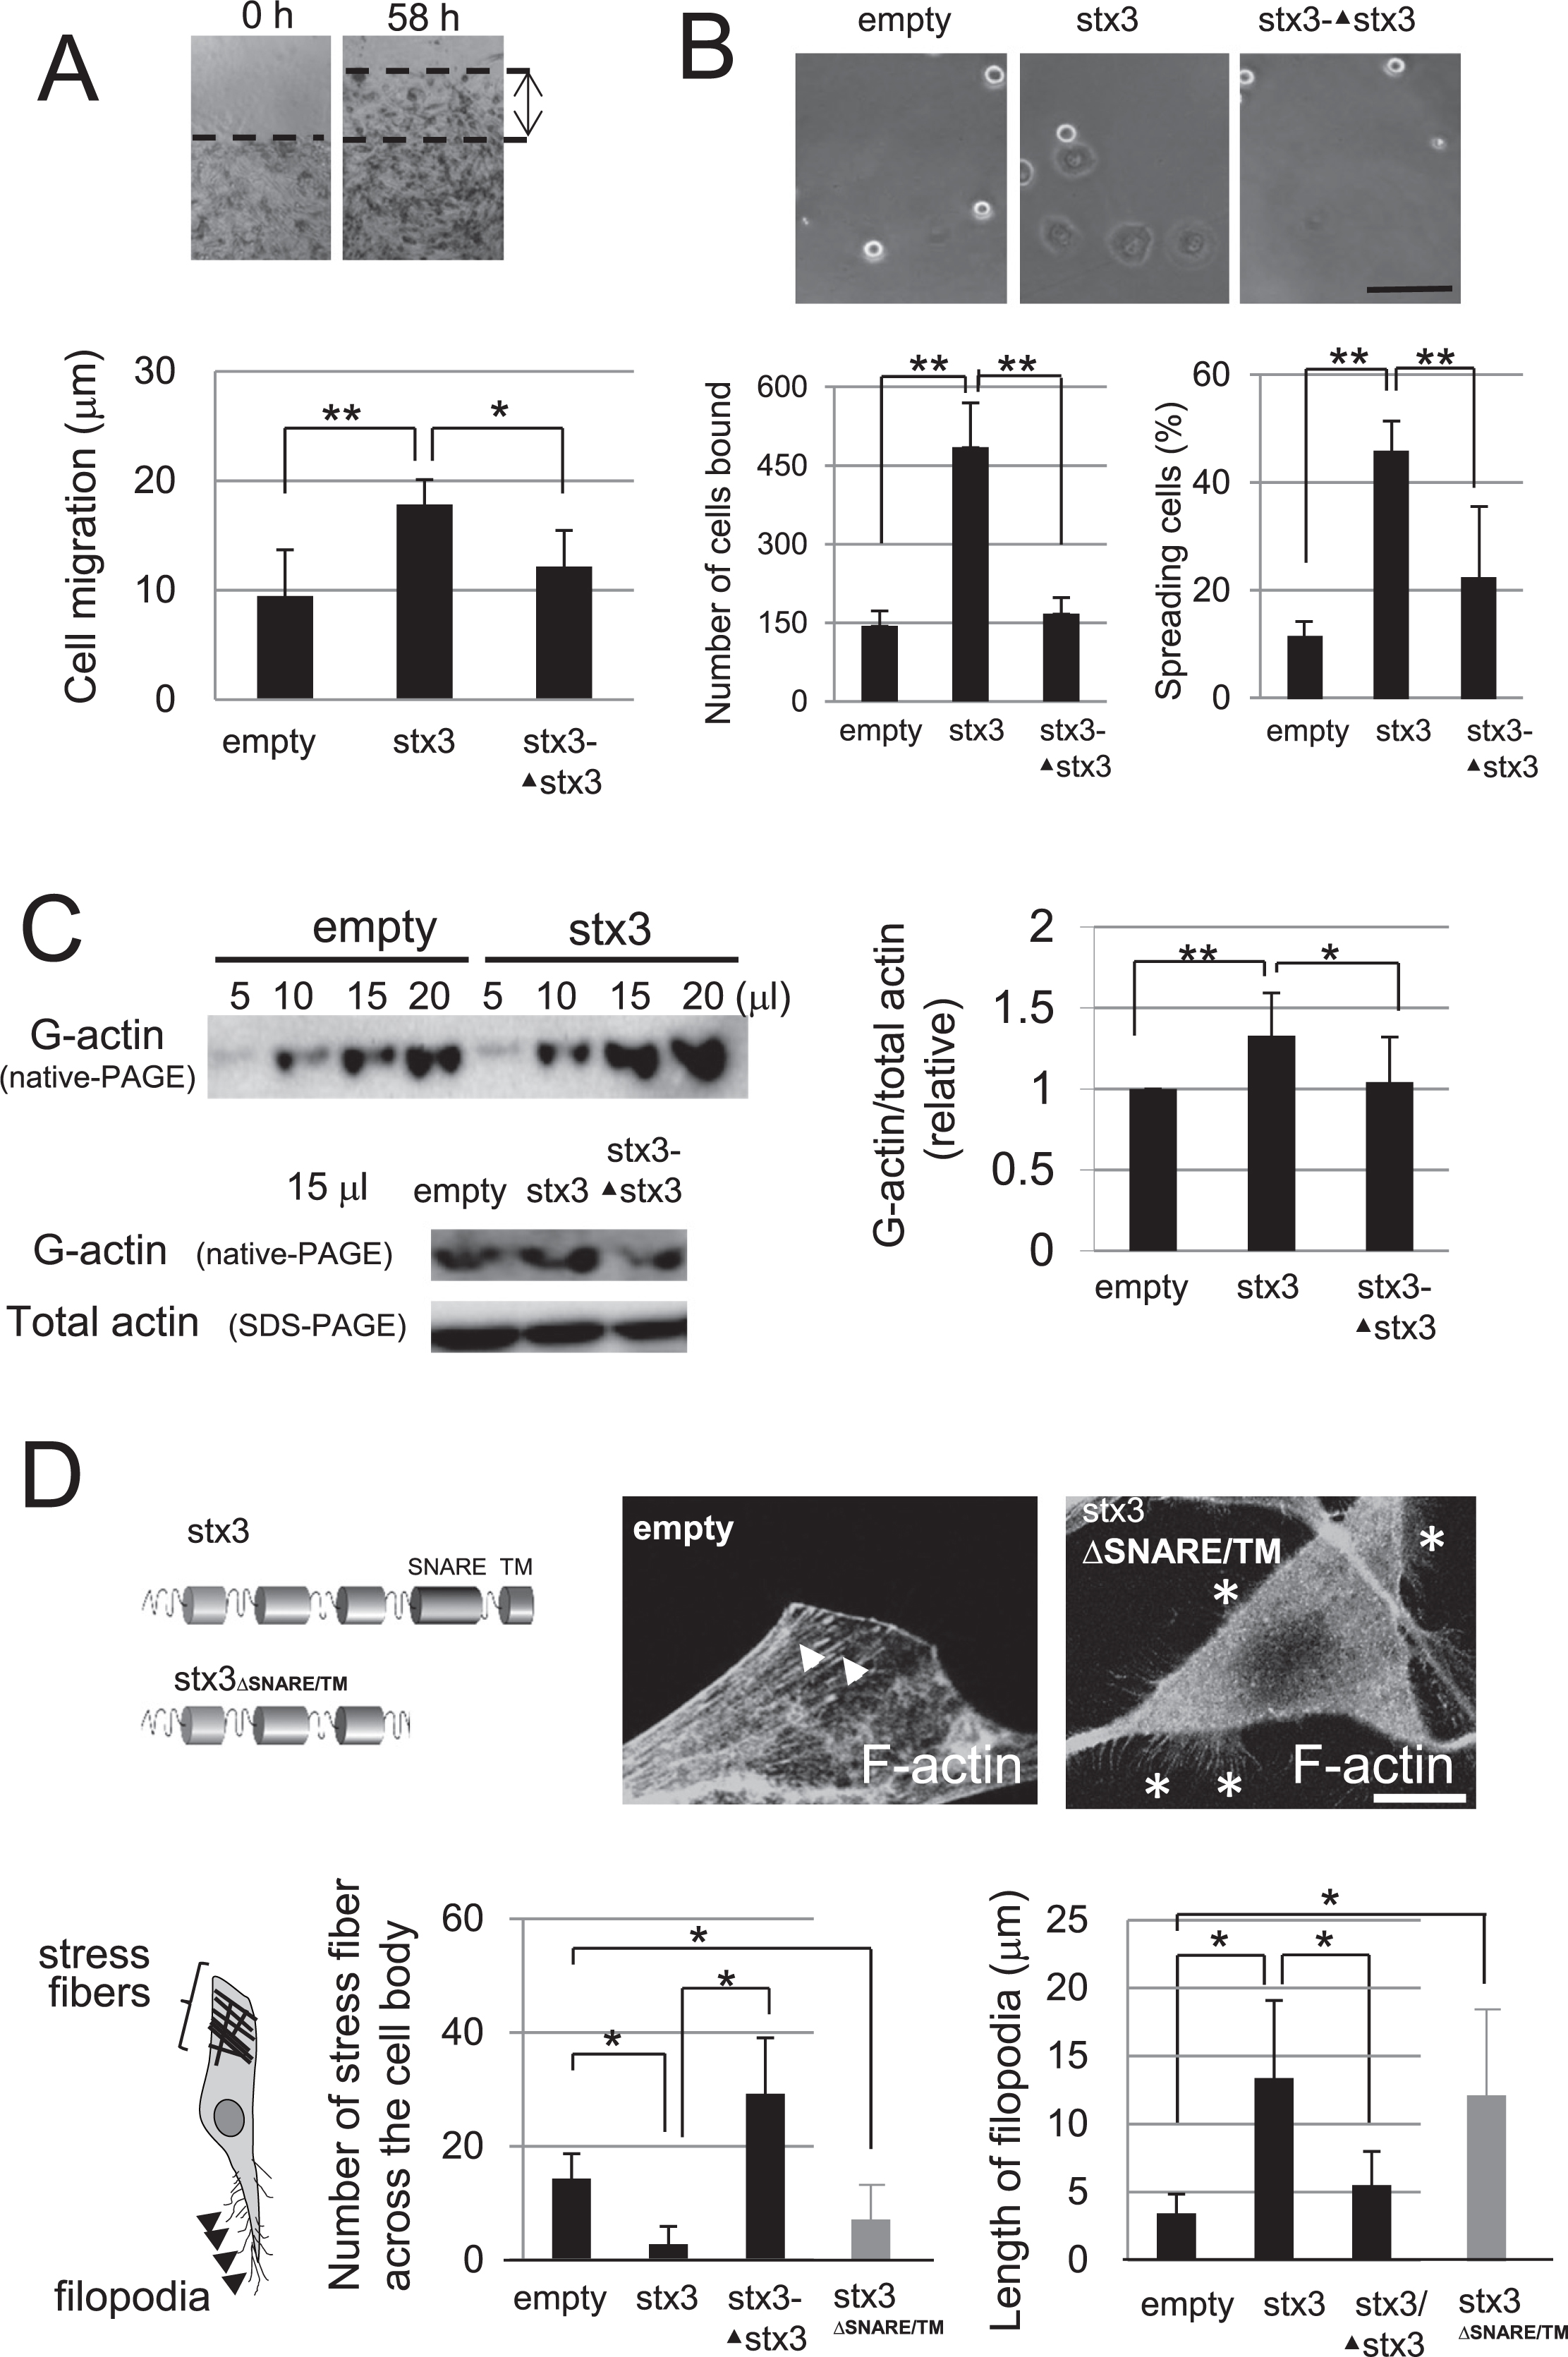
The effect of syntaxin3 on the phenotypic appearance of B16 cells. A, Effect of syntaxin3 on the B16 cell mobility. The migratory distance of the B16 derivatives over 58 hours was measured. The expression of syntaxin3 accelerated the cell mobility. N=4, *; p<0.1, **; p<0.05. B, Effects of syntaxin3 on the B16 cell adhesion profile. Upper; Phase contrast images of B16 derivatives bound to wells in one hour. Bar, 100 μm. The number of the substrate-adherent cells in 6 mm2×4 areas (lower, left), and the ratio of the spread cells (lower, right) were graphed for each category. B16 cells demonstrated an enhanced substrate-adherent property in response to syntaxin3-expression. N=7, **; p<0.01. C, Syntaxin3 impacted actin dynamics. The monomeric G-actin and total (G- plus F-) actin in the same sample were analyzed by western blotting after the native- (5, 10, 15 and 20 μl) and SDS-PAGE (10 μl), respectively, and the content of the monomeric form of actin was determined using the image analyzer. The expression of syntaxin3 elevated the ratio of the monomeric actin. N=5, *; p<0.1, **; p<0.01. D, The number of stress fiber across the cell body and the length of the longest filopodia were quantified in syntaxin3-expressing (stx3) and re-silenced (stx3-▴stx3) B16 transfectants. B16 cells stably expressing syntaxin mutant that lacks SNARE and transmembrane domain (B16ΔSNARE/TM) were also analyzed. Empty; parental B16 cells transfected with the empty pQCXIN or pSIREN plasmid. Cells stained with phalloidin were photographed under fluorescent (for the stress fibers) and differential interference contrast (for filopodia) microscopy, and more than 70 cells were randomly selected and analyzed for each subject. N=10, *; p<0.01.
Given that syntaxin3 led to dramatic alternations in cell morphology and motility along with apparent actin rearrangement, we proceeded to analyze the amount of depolymerized form of actin in the B16 derivatives. Comparative analyses of G-actin separated by Native page and SDS-PAGE in the same samples revealed a statistically significant increase in the ratio of monomeric actin upon the expression of syntaxin3 (Fig. 3C), despite the abundant presence of non-fibrous F-actin in the cell body and filopodia (Fig. 2B). To test whether these effects is part of t-SNARE function we generated B16 cells stably expressing syntaxin3 mutant that lacks SNARE and transmembrane domain. These cells displayed the same phenotype to cells expressing full length syntaxin3 in terms of F-actin organization and the filopodium formation, excluding the possible involvement of the SNARE-mediated membrane fusion in these effects (Fig. 3D). These results suggest that syntaxin3 actively accelerated the depolymerization of stress fibers across the cell body independent to SNARE function, so as to congregate G-actin at the cell periphery and alter the speed/balance of actin turnover.
Syntaxin3 attenuates the extracellular secretion of melanin granules in B16 cellsSince F-actin is known to be utilized as a scaffold for the cytoplasmic delivery of melanosomes toward the cell periphery (Fukuda and Kuroda, 2002) and the cells expressing syntaxin3 were deeply pigmented as compared to the control or the syntaxin3-suppressed cells (Fig. 4A), we examined the distribution of syntaxin3 and the pigmented melanosomes. Upon the partial co-localization with non-fibrous polymerized actin (Fig. 2D), syntaxin3 appeared to associate with the pigmented melanosomes in the syntaxin3-expressing B16 derivatives (Fig. 4A). Also in human melanocyte Hermes cells, both syntaxin3 and melanosomal proteins melan A/GP100 were expressed as the spot-like distribution pattern with accumulations at the tips of long sprouts (supplementary Fig. 2). These results recall the fact that melanosomes extracted and purified from normal human melanocytes contain syntaxin3 (Chi et al., 2006). Thus, an attempt was made to investigate the effect of syntaxin3 on the secretion profile of the melanosomes. To quantify the amount of the extracellularly secreted and cytoplasmically retained melanosomes in the B16 derivatives, the relative turbidity of the supernatant and cell lysate were determined in comparison to control (Fig. 4B). In response to syntaxin3, melanosomes was accumulated in the cytoplasm, while their extracellular release was severely blocked. This may be attributed to the decrease of the stress fiber assembly in the syntaxin3-producing cells, since control cells treated with cytochalasin-D, a strong inhibitor of actin polymerization, gave a similar effect (Fig. 4B). However, the cell density after seven days (confluent culture) and the melanin synthesis were possibly different between B16 derivatives (with and without artificial modulation of syntaxin3), considering in accord with the distinct cell shape and mobility in each category (Fig. 2 and Fig. 3). Indeed, B16 cells in which the syntaxin3 was artificially expressed and subsequently inhibited displayed decreased melanosomes in both the cell and supernatant fractions (Supplementary Fig. 3). Therefore, the proportion of secreted melanosomes and the extracellular secretion-to-cellular remaining ratio were calculated in order to focus closely on the melanosome secretion profile, so that the values were not cell number-dependent and the differences in melanin synthesis would be negligible. The syntaxin3-dependent reduction in the secretion of melanosomes was clearly confirmed by these analyses (Fig. 4B). Intriguingly, syntaxin3 lacking the SNARE and transmembrane domains elicited the same cellular response to full length of syntaxin3, suggesting that this effect was independent to the SNARE function of this molecule (Fig. 4B).

Effects of syntaxin3 on the melanosome secretion from B16 cells. A, upper; Bright field pictures of B16 cells with (stx3) and without (empty and stx3-▴stx3) syntaxin3-expression. The expression of syntaxin3 led to the accumulation of pigmented melanin particles in the cytoplasm. Bar, 100 μm. Lower; in the syntaxin3-expressing B16 cells, the pigmented melanosomes were roughly co-localized with the syntaxin3 detected with an anti-T7 antibody (red) (arrows). Bar, 10 μm. B, The secreted proportion in the total melanosomes (left) and the ratio of secreted/non-secreted melanosomes (right) in each category were calculated from the turbidity (O.D., 450 nm) in the supernatant and cell lysate. CCD; Those of the control cells treated with 0.5 μg/ml cytochalasin-D for 24 hours. Cytoplasmic accumulation of the pigmented melanin as the result of the expression of syntaxin3 or that lacking SNARE and transmembrane domains was evident. N=4, *; p<0.05, **; p<0.01. All the values were obtained from cells cultured for seven days, while those from cells on day 4 gave the comparable results.
In the present study, it was demonstrated that syntaxin3 plays a key role in B16 cell behavior via its effect on actin dynamics (Fig. 5). In response to the expression of syntaxin3, B16 cells became aggressive, with increased substrate adherence. The experimental evidence suggests that syntaxin3 actively disassembles stress fiber structures across the cell body so as to create and accumulate G-actin at the cell peripheral protrusions as a source of polymerized actin fibers. The phalloidin-positive form of actin was abundantly detectable in the periphery and the sprouting filopodia, suggesting a vigorous assembly of the polymerized actin there. While Syntaxin3 dramatically regulates actin dynamics, the molecular elements which carry out this function are unclear at present. There are reports of a temporal and direct association between actin molecules and the syntaxin family members, syntaxin2 and syntaxin4 (Woronowicz et al., 2010), but we did not detect such direct intermolecular interactions in the case of syntaxin3, neither in these cells nor the actin-reconstitution experiments in vitro (data not shown).

Model of the effect of forced expression of syntaxin3 on B16 cell behavior. B16 melanoma is an exceptional melanocyte-derived cell type, in terms of expressing undetectable amount of syntaxin3. These cells exhibit compact morphology and vigorously secrete melanosomes (upper). The forcible expression of syntaxin3 abolishes the stress fibers across the cell body, scaffolds for the cytoplasmic delivery of melanosomes, and accumulates monomeric actin at the cell periphery in order to activate actin rearrangement. This unique regulation of actin dynamics induces vigorous cell behavior and results in the inhibition of the melanosome secretion (lower).
Concomitantly with the syntaxin3-triggered actin rearrangement, the secretion of melanosomes appeared to be dramatically reduced. B16 cells also displayed severely decreased melanosome secretion when cultured in the presence of cytochalasin-D, suggesting that the depression of melanosome release is also the consequence of the alternation in the actin polymerization/depolymerization balance induced by syntaxin3, provided that the final process of melanosome delivery is strictly controlled by actin fibers at the cell periphery (Kuroda and Fukuda, 2005; Passeron et al., 2004). The change in cell shape has been thought to be deeply involved in melanosome secretion (Jungbauer et al., 2004), but there is scant data on the regulators of actin dynamics in melanocytes. One may attribute this effect to the modulation of the vesicle transport by syntaxin3, however, the SNARE and transmembrane domains in syntaxin3 appeared to be completely dispensable for this function. It is noteworthy, however, that the amount of total (secreted plus non-secreted) melanosomes was apparently altered by the artificial modulation of syntaxin3. This could be due to different cell number among B16 derivatives after they reached confluence, which was caused by syntaxin3-dependent cell shape changes. Alternatively, a process of the production or pigmentation of melanin granules was possibly impacted by syntaxin3, e.g., the activity or subcellular localization of enzymes for the melanin matutration such as tyrosinase, TRP1 or TRP2 (Vachtenheim and Duchon, 1996) could be affected.
Syntaxin3 is reportedly a t-SNARE protein that is nearly exclusively expressed at the plasma membrane (Sharma et al., 2006) and in exceptional cases throughout the cytosol of certain cell types in the undifferentiated state (Karvar et al., 2005), although not melanocytes or pancreatic acinar cells (Gaisano et al., 1996). Previous studies detected this molecule on the cytoplasmic melanosomes of normal melanocytes (Chi et al., 2006) and this study confirmed this localization in B16 mouse melanoma cells as well, indicating the physiological relevance of the incorporation of syntaxin3 into the lipid-bilayer of melanosomes. The molecular basis for this unique distribution pattern has not yet been clarified, but one possibility is that the nascent syntaxin3 polypeptide interacts with a binding partner on the ER/Golgi and this protein complex is recruited to the melanosomal membrane precursor. Among the molecules that may associate with the melanosome, the most likely syntaxin3-binding partners would be melanosome-associated Slp family proteins, considering their syntaxin-incorporating synaptotagmin-like structure (Fukuda and Kuroda, 2002). In fact, T7-tagged syntaxin3 was weakly associated with Slp2a and these proteins were co-immunoprecipitated with the anti-T7 tag antibody, albeit the apparent co-distribution in the cells was not appreciable (data not shown). An alternative possibility is that syntaxin3 on the cell membrane was incorporated into the early endosome, a precursor of melanosome (Raposo and Marks, 2007), so that the SNARE complex containing syntaxin3 was formed on the melanosomes, which did not have access to other t-SNARE molecules on the cell membrane. However, we did not detect even a tiny subpopulation of syntaxin3 in the cell membrane of the syntaxin3-producing B16 derivatives. To further clarify the molecular basis of the syntaxin3 distribution pattern, detailed analyses of the molecular composition of the syntaxin3-containing complex will be necessary.
In conclusion, syntaxin3 enhanced filopodia formation and blocked the extracellular secretion of melanin granules, which is apparently inconsistent with the assumption that the development of filopodium, a melanosome secretion center, supports the extracellular secretion of melanosome (Beaumont et al., 2011; Goding, 2007). It is thus emphasized that syntaxin3 appears to regulate fundamental molecular events for melanosome secretion, i.e., actin dynamics, rather than activate the direct element for melanosome delivery/secretion event at the filopodia, e.g., fusion between the melanosome and plasma membrane. One outstanding point that needs to be addressed is the effect on the subsequent melanin transfer to adjacent keratinocytes. Investigation using a keratinocyte-melanocyte co-culture system is now underway.
We thank St George’s University of London and Geron for the normal human melanocytes Hermes and 3c. We are grateful to Prof. Fukuda for Slp2 antibodies and all members of the Hirai laboratory for helpful discussions. Part of this work was supported by Japan Science and Technology Agency A-STEP and Grant-in Aid for Scientific Research (KAKENHI 24590365).