Abstract
Although most cell lines undergo mitotic arrest after prolonged exposure to microtubule inhibitors, some cells subsequently exit this state and become tetraploid. Among these cells, limited numbers of rodent cells are known to undergo multinucleation to generate multiple small independent nuclei, or micronuclei by prolonged colcemid treatment. Micronuclei are thought to be formed when cells shift to a pseudo G1 phase, during which the onset of chromosomal decondensation allows individual chromosomes distributed throughout the cell to serve as sites for the reassembly of nuclear membranes. To better define this process, we used long-term live cell imaging to observe micronucleation induced in mouse A9 cells by treating with the microtubule inhibitor colcemid. Our observations confirm that nuclear envelope formation occurs when mitotic-arrested cells shift to a pseudo G1 phase and adopt a tetraploid state, accompanied by chromosome decondensation. Unexpectedly, only a small number of cells containing large micronuclei were formed. We found that tetraploid micronucleated cells proceeded through an additional cell cycle, shifting to a pseudo G1 phase and forming octoploid micronucleated cells that were smaller and more numerous compared with the tetraploid micronucleated cells. Our data suggest that micronucleation occur when cells shift from mitotic arrest to a pseudo G1 phase, and demonstrate that, rather than being a single event, micronucleation is an inducible recurrent process that leads to the formation of progressively smaller and more numerous micronuclei.
Introduction
Proper mitosis depends on the formation of a spindle apparatus composed primarily of microtubules. Microtubule inhibitors, such as colcemid or nocodazole, physically interfere with microtubule formation and activate the spindle assembly checkpoint, leading to mitotic arrest (Swanton et al., 2006). While most human and rodent cell lines die during prolonged exposure to microtubule inhibitors (Kung et al., 1990), some cells have been reported to exit this state and survive by undergoing aberrant mitosis (Vitale et al., 2011).
Some of these cells often manifest gross nuclear alterations, including formation of a small independent nucleus apart from the main nucleus, or micronucleus, prior to their terminal growth arrest or death subsequent to mitotic exit. This small micronucleus originates spontaneously from lagging chromosome by the failure of chromosome missegregation, provoked by genotoxic stress such as DNA damage and DNA replication stress (Crasta et al., 2012). Thus, such spontaneously-generated micronucleus is recognized as one of the hallmark of chromosome instability in cancer cells, and is often referred to as a cancerous micronucleus, which is accompanied by an increase in the levels of γ-H2AX, the S139-phosphorylated form of the histone variant H2AX that marks chromatin near-DNA breaks (Rogakou et al., 1998). As an alternative form of micronuclei, limited numbers of rodent cells are known to form numerous micronuclei without apparent main nuclei by the prolonged treatment of microtubule inhibitor. These numerous micronuclei are also accompanied by an increase in the levels of γ-H2AX (Supplementary Fig. S1), although the mechanism of how two different types of micronuclei are formed depending on cell type remains unknown.
Not cancerous ones, but microtubule inhibitor-inducible numerous micronuclei (hereinafter referred to simply as ‘micronucleus’ or ‘micronuclei’ in the present study) are being used in chromosome transfer experiment that is referred to as Microcell-Mediated Chromosome Transfer (MMCT) (Doherty and Fisher, 2003). Enucleation of micronucleated cells by centrifugation in the presence of cytochalasin B resulted in isolation of smaller cell-like structures, referred to as a microcell (Ege and Ringertz, 1974). The fusion of microcells with live cells via membrane fusion enables the transfer of intact chromosomes and chromosomal vectors to the recipient cells (Oshimura and Katoh, 2008). Thus, microcells prepared from micronucleated cells promise to be useful as an experimental tool in somatic cell genetics via MMCT. Although capability of micronuclei formation of chromosomal donor cells is prerequisite for MMCT experiment, limited numbers of rodent cells are known to form micronuclei and this limits availability of the donor cells for MMCT experiment (normal human and mouse fibroblasts, fifteen various types of human and rodent cancer cell lines did not form micronuclei and mostly die. unpublished observation).
Micronuclei vary with respect to both their size and shape within the same cell, as well as in their number from cell to cell, and are thought to comprise partial or a whole chromosome. The formation of micronuclei is thought to be related to the condensed, scattered chromosomes that result from mitotic arrest caused by microtubule inhibitors. These scattered chromosomes are thought to serve as sites for the reassembly of nuclear membranes, forming micronuclei in which chromosomes decondense before returning to a pseudo G1 phase (Margulis, 1973; Crenshaw et al., 1981). We have previously observed that the majority of micronucleated cells are viable and propidium iodide (PI) negative even after exposure to colcemid for periods of time two- to three-fold in excess of their doubling time (data not shown). Moreover, it has been suggested that micronucleated cells can undergo DNA replication (Ghosh and Paweletz, 1984) and enter a second mitotic cycle after withdrawal of colcemid (Frackowiak et al., 1986). These observations indicate that not only the first, but also subsequent mitotic cycles under the continuous treatment with microtubule inhibitors can contribute to micronuclei formation. If this is the case, micronucleation would proceed repeatedly over multiple cell cycles, although to date no studies have directly confirmed this in living cells.
In the present study, by using time-lapse live cell imaging, we evaluated how micronucleation is induced along with cell cycle progression, by monitoring major cell cycle events including nuclear envelope formation and breakdown, chromosome condensation cycle, and exit from transient mitotic arrest to pseudo G1 phase, during micronucleation.
Materials and Methods
Cell culture and induction of micronucleation
The mouse A9 cell line was maintained in Dulbecco’s modified Eagle’s medium (D-MEM, Wako, Osaka, Japan) supplemented with 10% fetal calf serum. For induction of micronucleation, A9 cells at confluence were cultured in D-MEM supplemented with 20% fetal calf serum and 50 ng/ml colcemid (Wako). Monastrol (Cayman chemical, Ann Arbor, MI, USA) and Cytochalasin B (Sigma, St. Louis, MO, USA) were used, with a final concentration of 100 μM and 2 μg/ml, respectively. CHO cells were maintained in Ham’s F12 medium (Wako) supplemented with 10% fetal calf serum, and micronucleation was induced in Ham’s F12 medium supplemented with 20% fetal calf serum and 100 ng/ml colcemid.
The A9-human hybrid cell line, which stably retains several human chromosomes, was established in our laboratory using a standard Polyethylene glycol cell fusion method as reported previously (Koi et al., 1989).
Plasmid construction and transfection
For EGFP-LMNA plasmid construction, RT-PCR was performed using total RNA prepared from A9 cells using SuperScript III One-Step RT-PCR system (Invitrogen, Carlsbad, CA, USA). The primer sequences to obtain mouse Lamin A are available upon request. Amplified RT-PCR product was cloned into the EcoRI and BglII sites of the pEGFP-C1 vector (Clontech, Mountain View, CA, USA). For H2B-GFP experiments, pBOS-H2BGFP vector (BD Biosciences, San Jose, CA, USA) was prepared and transfected to A9 cells. Then, A9 cells stably expressing H2B-GFP were obtained. For Fucci2 experiments, the two Fucci2 plasmids, mVenus-hGeminin (1/110) and mCherry-hCdt1 (30/120), under CAG promoter were inserted into multi-integrase mouse artificial chromosome (MI-MAC) via PhiC31 integrase mediated site specific recombination (Yamaguchi et al., 2011; Takiguchi et al., 2014). The expression of Fucci2 probes were confirmed by fluorescence microscopy and flowcytometry (data not shown). Plasmid transfection was performed using Lipofectamine 2000 reagent (Invitrogen).
Flowcytometry
For DNA content analysis, non-treated cycling A9 cells and colcemid-treated, micronucleated A9 cells were harvested, washed with PBS, and fixed in cold 70% ethanol and maintained for at least 24 h at –30°C. For analysis, 1×10⁶ fixed cells were washed with PBS, suspended in 1 ml of PBS containing Hoechst33342 (Invitrogen) with a final concentration of 5 μg/ml, then incubated for 30 min in a 37°C incubator. Data were acquired using BD LSRFortessa X-20 flowcytometer (BD Biosciences) equipped with 405 nm violet laser, and analyzed using FlowJo software (Tomy Digital Biology, Tokyo, Japan). Simultaneous evaluation of DNA content and phosphorylated mitotic protein was also analyzed by flowcytometry using anti-MPM2 antibody (Merck Millipore, Darmstadt, Germany) as previously reported (Inoue et al., 2014). Data were acquired using Gallios flowcytometer (Beckman Coulter, Brea, CA, USA) equipped with 488 nm blue and 633 nm red lasers. Acquired data was analyzed using FlowJo software (Tomy Digital Biology).
Immunoblotting
A9 cells exposed to ionizing radiation and colcemid were lysed directly in appropriate amount of Laemmli’s SDS-PAGE sample buffer. Cell lysates were separated on 15% polyacrylamide gels and transferred onto a nitrocellulose membrane (GE Healthcare Life Science, Pittsburgh, PA, USA). For immunoblotting, 1:1000-diluted monoclonal anti-phospho-Ser139 Histone H2A.X antibody (Merck Millipore), and anti-mouse immunoglobulin was used as primary and secondary antibody, respectively. Immunoblotting of β-actin was performed as loading control using 1:6000-diluted monoclonal anti-β-actin antibody (Sigma). Can Get Signal Immunoreaction Enhancer Solution (TOYOBO, Osaka, Japan) was used as an antibody diluent. The signal was detected by using Pierce Western Blotting Substrate Plus (Thermo Fisher Scientific, Waltham, MA, USA).
Immunofluorescence
Immunofluorescence detection for γ-tubulin was performed as previously reported (Inoue et al., 2009). Immunostained samples were imaged on LSM780 confocal laser scanning microscopy equipped with 488 nm Argon (for Alexa 488 excitation) and 405 nm near UV (for DAPI excitation) laser (Carl Zeiss, Jena, Germany).
Time-lapse imaging
A9 cells were grown on glass bottom dishes (Iwaki Glass, Chiba, Japan). Time-lapse fluorescence imaging analyses were performed using LCV110 system (Olympus, Tokyo, Japan) equipped with 488 nm blue and 545 nm red lasers. Images were captured, at 150 s intervals for H2B-GFP, at 10 min intervals for EGFP-LMNA and Fucci2, for up to 72 h and processed with MetaMorph imaging software (Molecular Devices Japan, Tokyo, Japan). We monitored at least three positions per dish for time-lapse imaging. Parental A9 cells (non-fluorescent), EGFP-LMNA-expressing cells, Fucci2-expressing cells, and H2B-GFP-expressing cells were analyzed in the same manner. For each analysis, several independent clones were used.
BrdU labeling assay
BrdU labeling assays were performed using an in situ cell proliferation kit (FLUOS, Roche, Basel, Switzerland) according to the manufacturer’s protocol. Micronucleated cells induced by 48 h treatment of colcemid were labeled with 10 μM of BrdU for 2 h and fixed with 4% paraformaldehyde in PBS. Images were captured using Axio Imager Z2 microscope (Carl Zeiss).
mFISH analysis
Multi-color FISH (mFISH) analyses were performed using 24XCyte human mFISH probe kit (MetaSystems, Newton, MA, USA). Denaturation, hybridization, and fluorescence staining were performed according to the manufacturer’s protocol (Booklet mFISH_mBAND-DI_V3). Microscopic analyses were performed using Axio Imager Z2 microscope equipped with filter sets for FITC, Cy3, Texas Red, Cy5, DEAC, and DAPI. Images were captured and analyzed with ISIS Fluorescence imaging software (MetaSystems).
Results and Discussion
Progressive formation of small and numerous micronuclei in mouse A9 cells
The mouse A9 cell line, a mouse L cell fibroblast-derived cell line in which the number of chromosomes in individual cells ranges from 51 to 57 (Littlefield, 1964), is widely used in MMCT. MMCT has been established and developed by using A9 cells and CHO cells exclusively because of the high capability of micronucleation, thus we mainly used these two cell lines in the present study, although micronucleation is observed in a few other cell lines with lower efficiency.
Phase contrast microscopy demonstrated the formation of micronuclei within 24 h exposure of A9 cells to colcemid, and fluorescent microscopic analyses suggested that the size of the micronuclei was inversely correlated with the number of micronuclei in each cell. Observation of nuclei in living cells up to 144 h treatment with colcemid using Hoechst33342 dye demonstrated that micronucleation proceeded in a time-dependent manner up to 64 h, and then reached a plateau (Fig. 1A). We observed that micronuclei were heterogeneous, and varied in size, shape and number from cell to cell. While the theoretical maximum number of micronuclei in a given cell is the number of sister chromatids, nuclear staining indicated that the majority of micronucleated cells contained numbers of micronuclei that were smaller than the average number of chromosomes in A9 cells. Although technical difficulties prevented us from quantifying sister chromatids within micronuclei in the present study, nuclear observation suggests that each micronucleus contained one or more chromosomes, as was confirmed by Multi-color fluorescence in situ hybridization (mFISH) analysis (Supplementary Fig. S2).
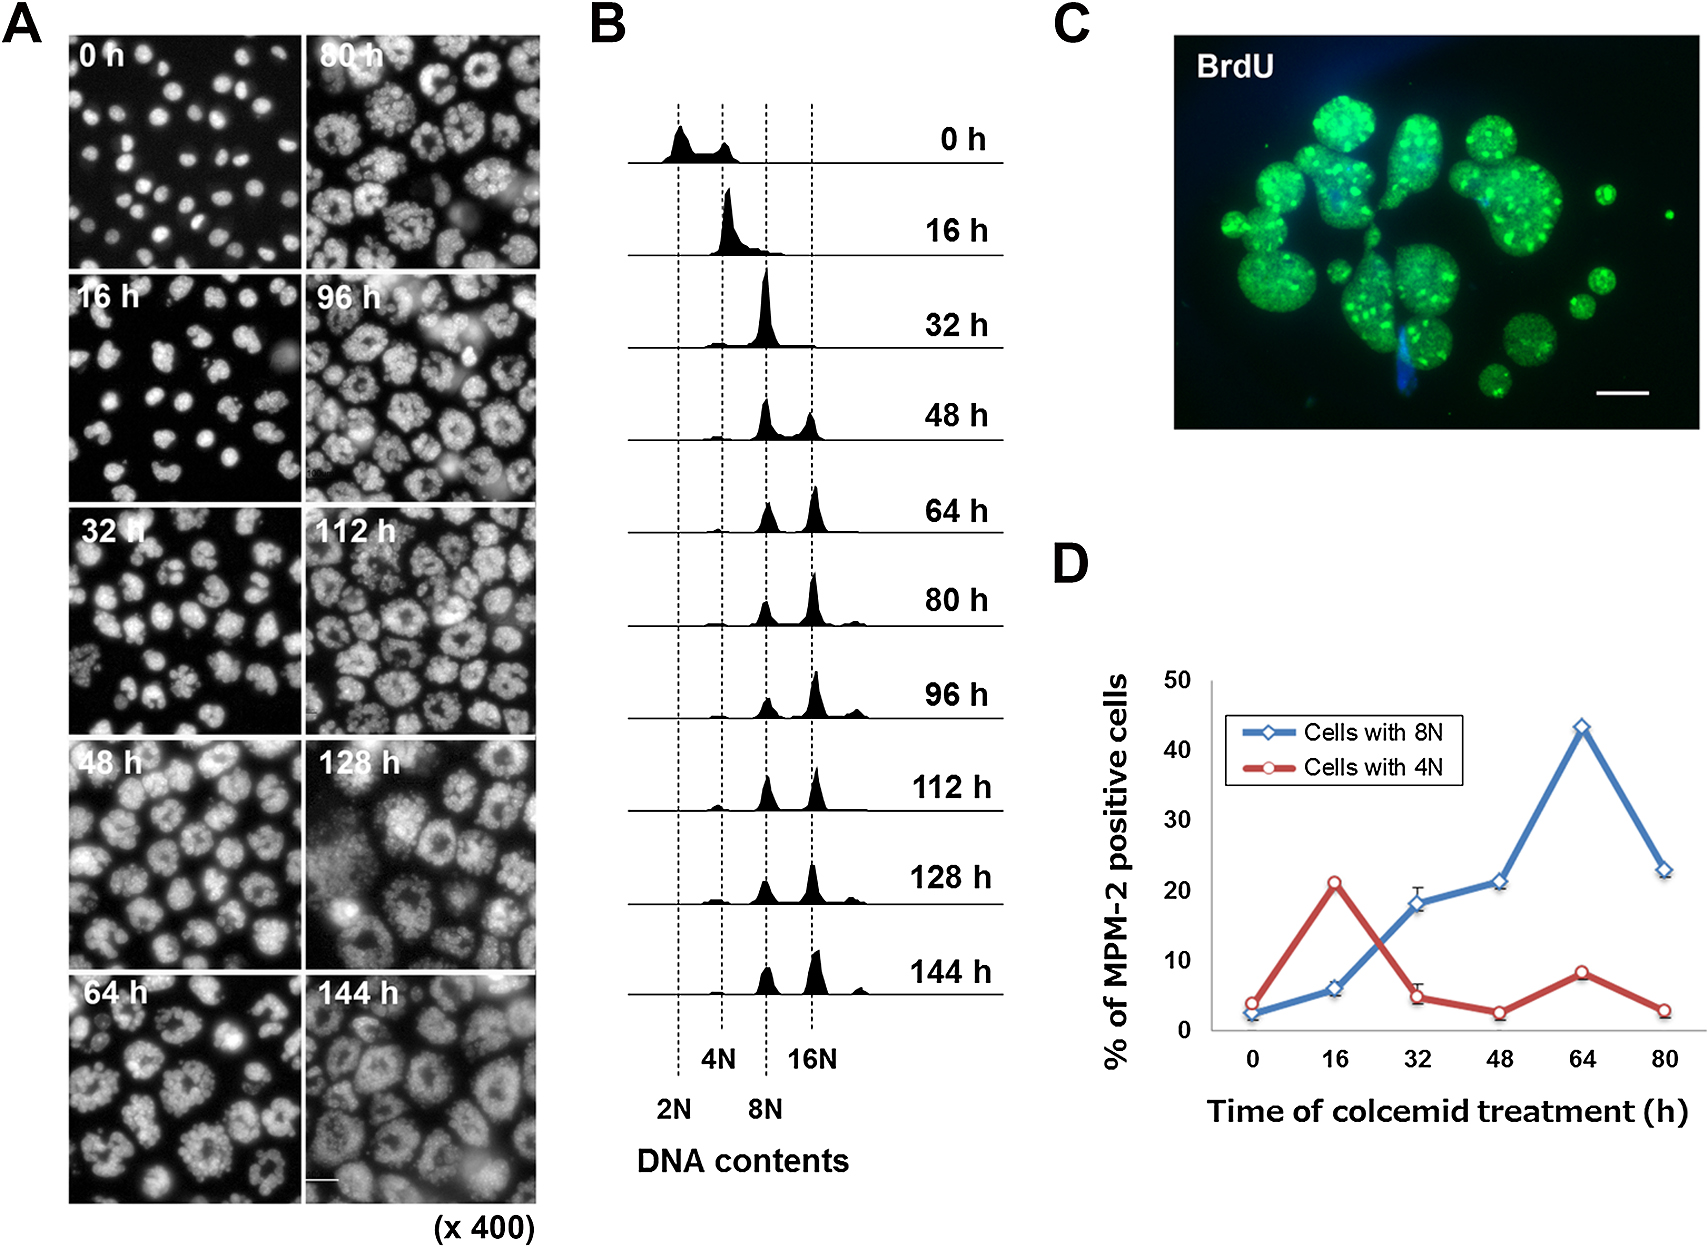
By propidium iodide (PI) staining analyses, we found that the majority of micronucleated cells were viable even after exposure to colcemid for periods that were two- or three-fold in excess of the doubling time of A9 cells (approximately 20 h), and became giant cells (Fig. 2 and Fig. 4). These observations, along with our observation of the time-dependence of micronucleation (Fig. 1A), led us to examine the possibility that rather than being confined to the first shift from mitotic arrest to pseudo G1 phase in the tetraploid state, micronucleation accompanies polyploidization in a repetitive manner.
Flowcytometric DNA content analyses showed that DNA ploidy increased in a time-dependent manner, reaching DNA contents of 4N, 8N and 16N in the presence of colcemid by 64 h (Fig. 1B). Then the distribution pattern of DNA content was not significantly changed, as was observed in micronucleation (Fig. 1A). This implies that the formation of small and numerous micronuclei is closely involved in polyploidization.
According to this observation, we also evaluated DNA replication by BrdU labeling of micronucleated A9 cells followed by immunofluorescence staining. Consistent with previous report that DNA replication occurs within micronuclei (Ghosh and Paweletz, 1984), the uniform distribution of BrdU signal among individual micronuclei after 48 h exposure to colcemid were observed and this indicated that, as anticipated, DNA replication was taking place in the micronuclei of micronucleated A9 cells (Fig. 1C). In contrast to a previous suggestion that the functions of multiple micronuclei in a single cell are asynchronous (Ghosh and Paweletz, 1984), we found that within a given micronucleated A9 cell, the functions of independent micronuclei were synchronized.
According to the results of cell cycle progression and DNA replication during micronucleation, we further evaluated mitotic arrest in either cell population with 4N or 8N DNA contents by flowcytometry. Levels of phospho-Ser/Thr-Pro epitope, which is known as a mitotic marker, were evaluated by immunostaining with MPM-2 antibody. As shown in Fig. 1D, MPM-2 levels in cells with 4N DNA contents showed a peak at 16 h, suggesting the first mitotic arrest. After 32 h treatment of colcemid, the MPM-2 positive ratio of 4N decreased, whereas that of 8N increased up to 64 h and then decreased. Since the population of octoploid increased after 48 h, the peak at 64 h may represent the mitotic arrest for these octaploid cells. These results suggested that recurrent cell cycle progression occurs with polyploidization up to 64 h in the presence of colcemid. We observed that micronucleated cells after 48 h treatment of colcemid followed by colcemid-free culture stay as viable micronucleated cells without further division after the removal of colcemid (Supplementary Fig. S3). Thus, polyploid state with numerous micronuclei is thought to be stable and irreversible.
It remains to be clarified why cells with DNA damage (Supplementary Fig. S1) undergo recurrent cell cycle progression at least for up to 64 h in the presence of colcemid. One possible reason is weaken tetraploid checkpoint by p53 inactivation and weaken Hippo pathway as previously reported (Nitta et al., 2002; Ganem et al., 2014). On the other hand, polyploid cells with numerous micronuclei do not undergo further cell cycle progression (Supplementary Fig. S3). We speculate that the drastic nuclear alteration is the possible causes, although we can not rule out the possibility that the accumulation of DNA damage leads to the cell cycle arrest in polyploid cells with numerous micronuclei.
Collectively, these results support the idea that micronucleation accompanies polyploidization process, and is not restricted to the initial transition from a mitotic arrest to a pseudo G1 phase in the tetraploid state.
Reappearance of the nuclear envelope during micronuclei formation
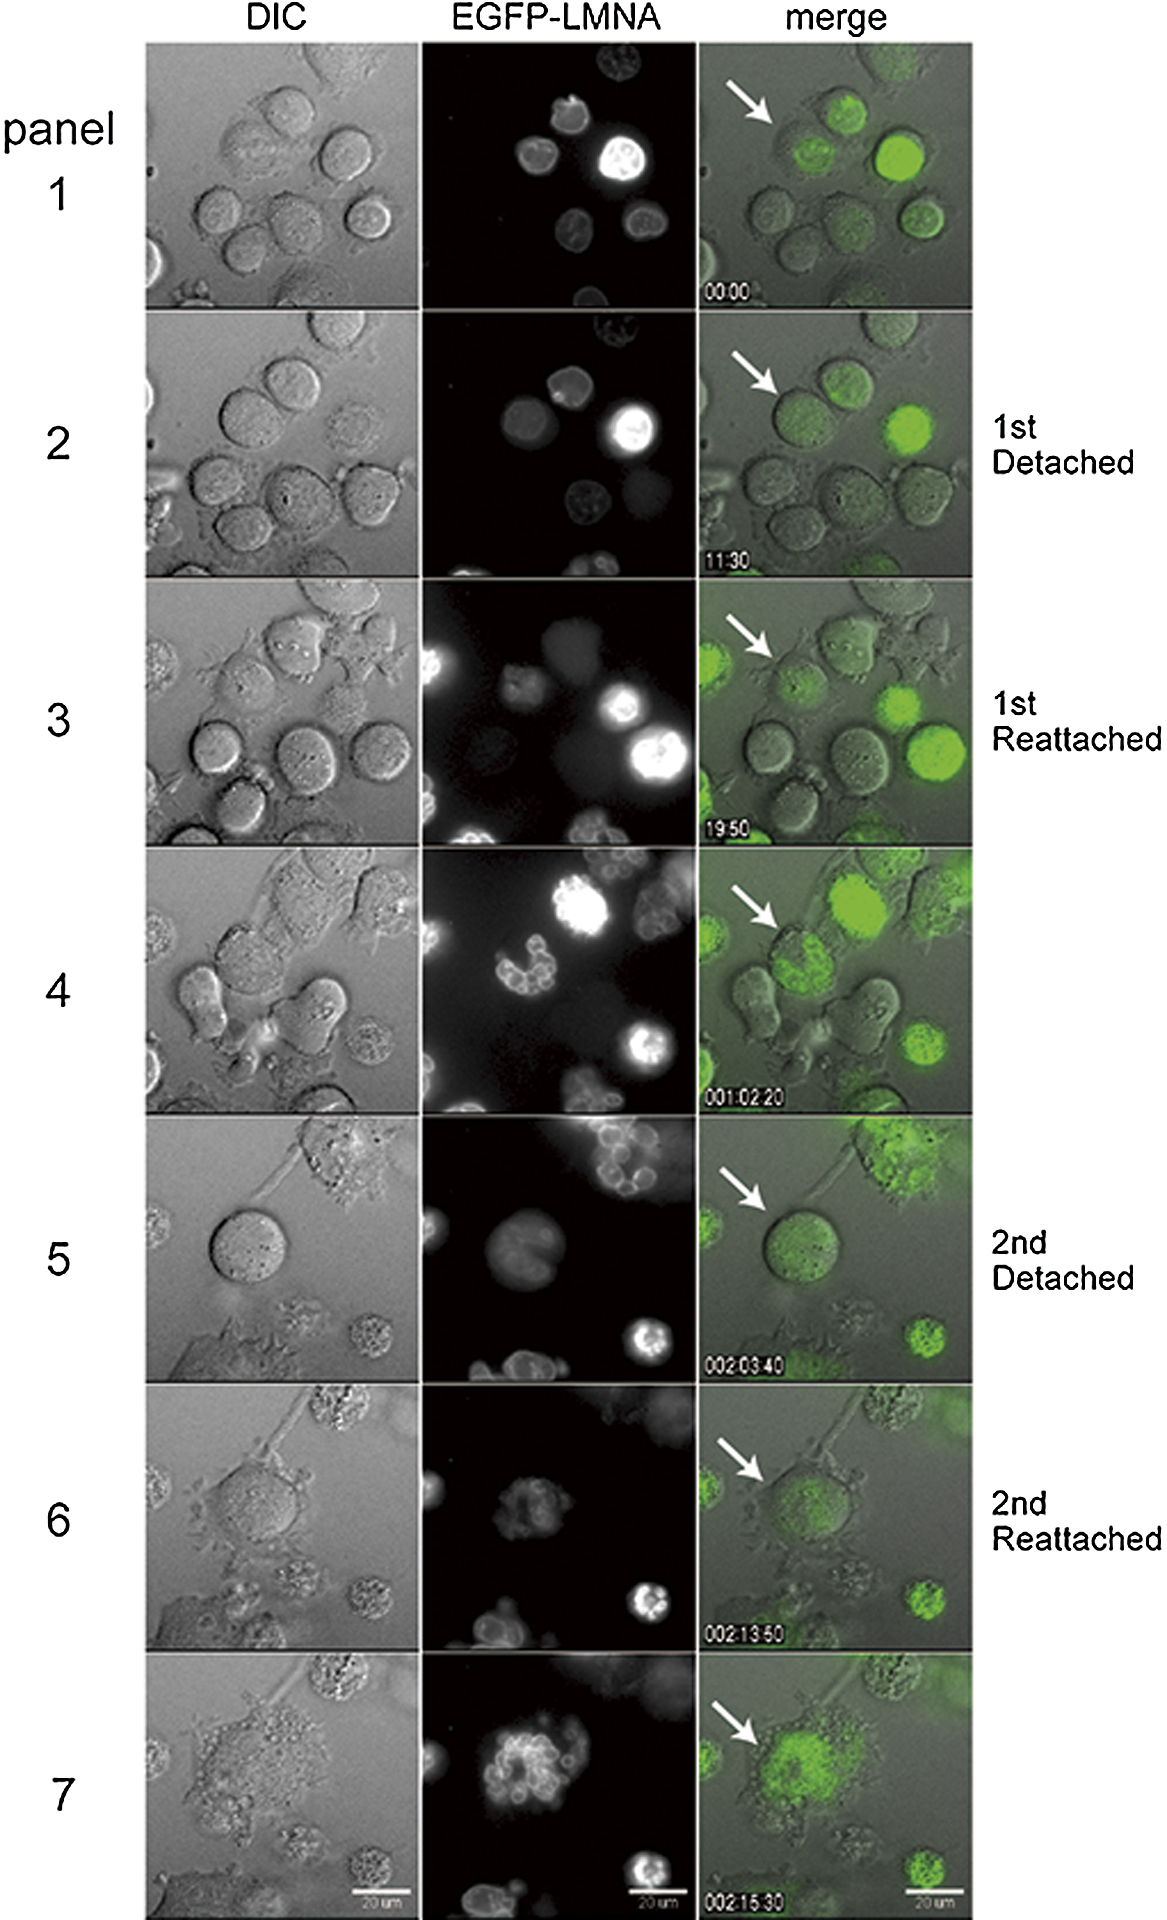
Under a normal condition, the nuclear envelope is disassembled at the onset of mitosis, and reforms around chromosomes when cells exit mitosis and shift to a pseudo G1 phase. Although micronucleated cells are known to enter new cell cycle after removal of mitotic inhibitors (Sekiguchi et al., 1978), these observations of mitotic event including nuclear envelope cycle were conducted in fixed cells, accordingly we monitored nuclear envelope dynamics in live cells. When A9 cells expressing EGFP fused to mouse lamin A protein, a component of the nuclear lamin (EGFP-LMNA), were treated with colcemid for up to 48 h, the EGFP-LMNA signal associated with the rim of mononucleus disappeared then reappeared around the individual nuclei (Fig. 2, panel 4 and 7, respectively. See Supplementary Movie 1). We observed that mononucleated cell (Fig. 2, white arrow) entered and exited the mitotic phase, resulting in the formation of multiple nuclei, comprising a few or several nuclei, which we referred to as a multinucleated cell in the present study (Fig. 2, panel 4 white arrow). Multinucleated cells entered into a subsequent cell cycle, and EGFP-LMNA signal was observed along with nuclear envelope cycle during the second round of micronucleation (Fig. 2, panels 5 to 7). The number of independent nuclei per cell increased from 1 to approximately 10 in multinucleated cells and multinucleated cells after a second round of micronucleation formed more numerous micronuclei (Fig. 2, panel 7). Our data showed that the cyclical process of nuclear envelope formation is comparable in mono-, multi- and micronuclei. Moreover, as previous studies have suggested that the formation of the nuclear envelope is a chromosome-dependent process (Wandke and Kutay, 2013), our results also suggested that nuclear envelope reformation could proceed around both individual chromosomes and groups of chromosomes, forming independent micronuclei during micronucleation (see also Supplementary Fig. S2).
Differential Interference Contrast (DIC) imaging carried out in parallel to the EGFP-LMNA analysis showed that restoration of EGFP-LMNA signals derived from the micronuclear envelopes were accompanied by attachment and flattening of cells to the dish (Fig. 2, panels 2 to 3, and panels 5 to 6), further demonstrating that micronucleated A9 cells exited mitotic arrest and entered pseudo G1 phase. We could directly show that nuclear envelope breakdown and reformation proceeded continuously around individual or groups of chromosomes in the presence of a microtubule inhibitor, suggesting that micronucleation is a recurrent process, and this recurrent process is assumed to be crucial to the formation of smaller micronuclei.
Seemingly, cytokinesis did not occur, and this resulted in increase in DNA ploidy during micronucleation (Fig. 1B). To ask whether cytokinesis failure is crucial to induce micronucleation, A9 cells were treated with cytochalsin B, an actin-depolymerizing drug, for 48 h. By cytochalasin B treatment majority of cells formed binuclei and no micronucleation was observed (Supplementary Fig. S4), suggesting that cytokinesis failure is not important for induction of micronucleation. Monastrol is an inhibitor of the mitotic kinesin Eg5, which is required for centrosome separation at prophase, and thus the monastrol treatment results in the formation of monopolar spindle (Mayer et al., 1999). We observed that monastrol treatment did not induce micronucleation in A9 cell and CHO cell (Supplementary Fig. S4, and data not shown). These data support the previous notion that micronuclei are formed from widely scattered individual chromosomes (Margulis, 1973).
Micronucleation is accompanied by cell cycle transition with chromosome condensation cycle
To confirm that micronucleated cells can enter a second mitotic cycle followed by re-entry into pseudo G1 phase, we next conducted live cell imaging analysis of cell cycle transition and chromosome condensation cycling during micronucleation. Fluorescent ubiquitination-based cell cycle indicator (Fucci) probes can be used to distinguish cells in G1 from cells in other phases (Sakaue-Sawano et al., 2008). Recently, Fucci2 probes were developed as derivative of Fucci probes (Sakaue-Sawano et al., 2011). Fucci2 probes emit red (mCherry) and green (mVenus) fluorescence that stains cells in G1 and cells in other phases, respectively. We used this system to confirm whether micronucleation proceeds under general cell cycle regulation. As anticipated, A9 cell expressing the Fucci2 probes showed that attachment and flattening of micronucleated cells to the dish was accompanied by a transition of the green signal to yellow/orange signal, indicating that the cells were entering a pseudo G1 phase (Fig. 3, see Supplementary Movie 2). We could also follow the second round of micronucleation in the same cell, and observe that multinucleated cell proceeded further micronucleation and increased the number of smaller micronuclei, which was accompanied by mitotic entry and exit, confirmed by reciprocal and transitional expression of Fucci2 probes (Fig. 3, white arrow). Similar experiments in CHO cells using Fucci probes also showed similar results of recurrent micronucleation (data not shown).
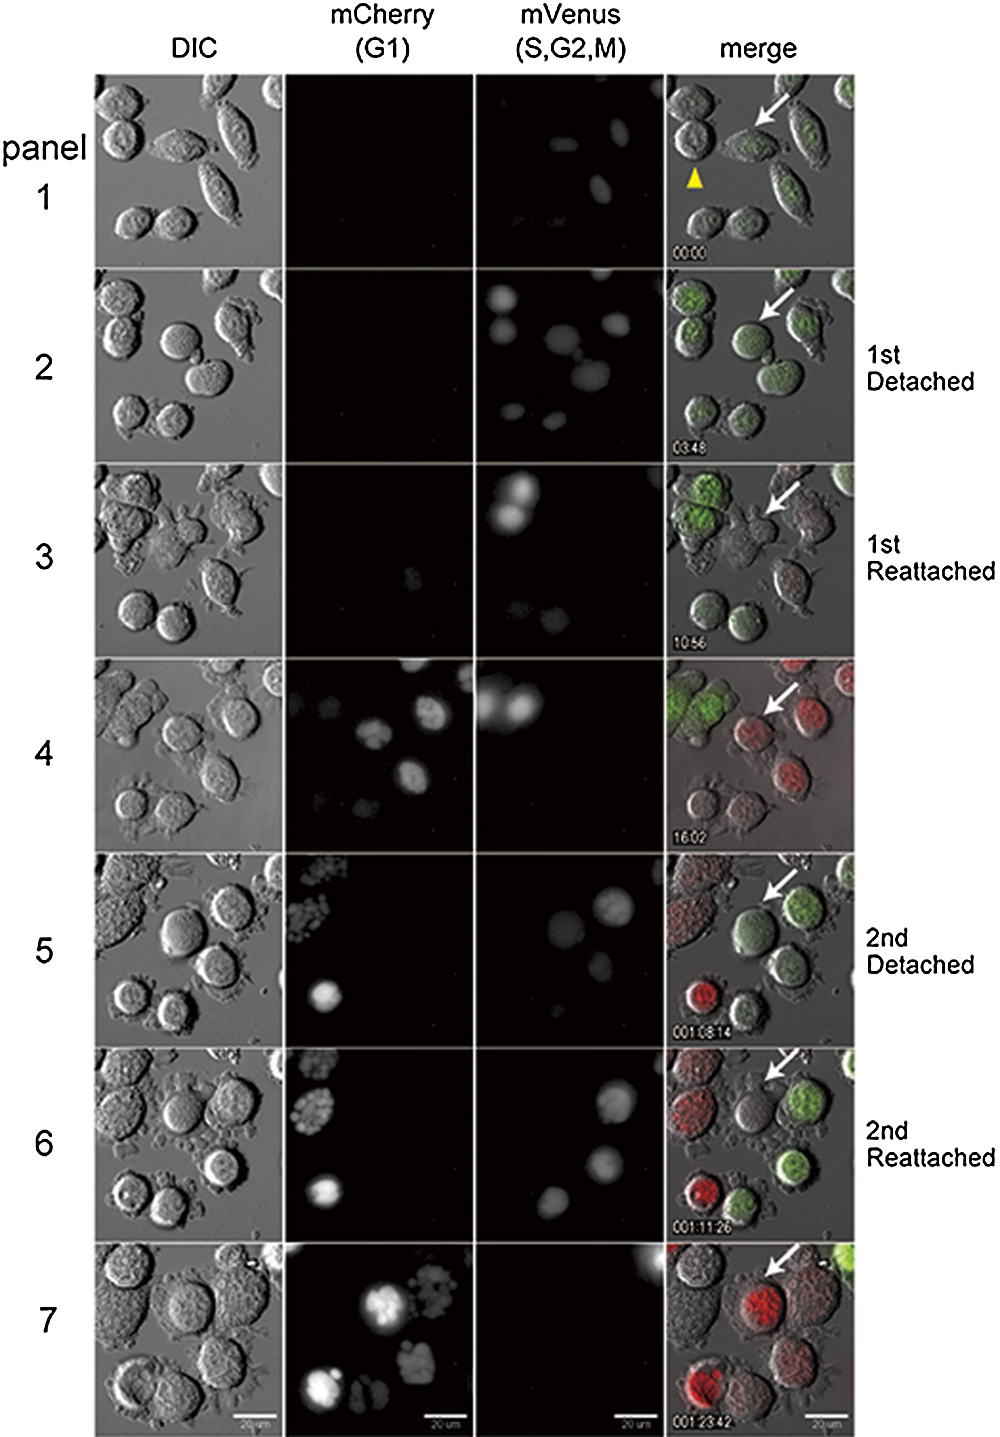
Thus, consistent with the results of nuclear envelope cycling (Fig. 2), live cell imaging analyses using Fucci2 probes showed that during micronucleation cells enter a mitotic phase followed by re-entry into a pseudo G1 phase. Moreover, expression of Fucci2 probes further suggested that micronuclei in a given cell are functionally synchronous, as observed in the case of DNA replication (Fig. 1C).
Next, we carried out live cell imaging analyses of chromosome condensation cycle using A9 cells expressing Histone 2B fused to GFP (H2B-GFP), a component of the octameric histone core whose distribution changes as a function of cell cycle progression. The H2B-GFP signal allowed us to monitor fluctuations in chromatin condensation throughout the mitotic phase during prolonged exposure to colcemid. Fig. 4 shows two rounds of mitotic phases, the detachment of cells from the dish and entry into mitosis and their reattachment and entry into a pseudo G1 phase, during the first (panels 2 to 3) and subsequent (panels 4 to 5) rounds of micronucleation during 48 h exposure to colcemid in a single cell (white dashed circle, see also Supplementary Movie 3). In the absence of colcemid, the mitotic phase was completed within 1 h (data not shown). In the presence of colcemid, however, mitotic arrest extended to about 5 h and a duration time of mitotic arrest in the second round of micronucleation is almost same as that in the first round (Fig. 4, panels 2 to 3 and panels 4 to 5). These results suggested that transient mitotic arrest occurs constantly during first and subsequent round of micronucleation as well (see also Fig. 2 and Fig. 3). The H2B-GFP signals clearly indicate that chromosome condensation occurs in the presence of colcemid, and confirmed that the cells formed micronuclei, accompanied by chromosome decondensation and entry into G1 phase (Fig. 3 and Fig. 4, Supplementary Movie 3). Thus, our data is a direct demonstration that chromosome condensation cycling accompanies a longer period of mitotic arrest during micronucleation. Similar result was also obtained with CHO cell (Supplementary Fig. S5).

Intriguingly, after each micronucleation, the number of micronuclei increased further, and their size became smaller. The present long-term live cell imaging observations directly show that micronucleation occurs over multiple cell cycles, and results in the formation of smaller and more numerous micronuclei. These results were consistent for the majority of cells analyzed, although in only one instance we observed a decrease in the number of micronuclei (Fig. 4, white arrow in panel 1). Moreover, we also observed that some cells could induce micronuclei efficiently only through a single micronucleation (mCherry in Fig. 3, yellow arrowhead). These observations suggested that the various extents of susceptibility against microtubule inhibitor might exist and result in differences in a capability of micronucleation in each A9 cells. Interestingly, we observed that micronucleated cells containing a smaller number of micronuclei, or multinucleated cells, were more prone to proceed through a subsequent cell cycle. Although, it is not clear what kind of factors determine the remaining number of times of micronucleation to occur, this observation supports the idea that the drastic nuclear alteration may lead to the cessation of further cell cycle progression.
One of key points to improve MMCT efficiency is how the maximum micronucleation, in which all micronuclei are formed from a single chromosome, can be induced. The present study showed that micronucleation is a recurrent process that leads to the formation of progressively smaller and more numerous micronuclei. Thus, to delineate the mechanism to allow recurrent cell cycle progression in the presence of microtubule inhibitors would lead to a more efficient method to prepare microcells and expansion of cell lines that can be used as a donor cells in MMCT. Also, such micronucleation model system represents a useful experimental approach for studying nuclear envelope formation around chromosomes.
Acknowledgments
We greatly thank Dr. Atsushi Miyawaki for providing us with Fucci2 system plasmids. We thank Drs. S. Inaga, H. Nakane, and M. Katoh (Tottori University) for critical comments and valuable discussions on the manuscript. This study was supported in part by the Funding Program for Next Generation World-Leading Researchers (NEXT Program) from the Japan Society for the Promotion of Science (JSPS) (Y.K.), JST, CREST (M.O.), the Regional Innovation Strategy Support Program from the Ministry of Education, Culture, Sports, Science and Technology of Japan (MEXT) (M.O.), ARCH-Tox project from the Ministry of Economy, Trade and Industry (METI), Japan (M.O.), and the School of Medicine of Tottori University (Y.N.).
References
- Crasta, K., Ganem, N.J., Dagher, R., Lantermann, A.B., Ivanova, E.V., Pan, Y., Nezi, L., Protopopov, A., Chowdhury, D., and Pellman, D. 2012. DNA breaks and chromosome pulverization from errors in mitosis. Nature, 482: 53–58.
- Crenshaw, A.H., Jr., Shay, J.W., and Murrell, L.R. 1981. Colcemid-induced micronucleation in cultured human cells. J. Ultrastruct. Res., 75: 179–186.
- Doherty, A.M. and Fisher, E.M. 2003. Microcell-mediated chromosome transfer (MMCT): small cells with huge potential. Mammalian genome: official journal of the International Mammalian Genome Society, 14: 583–592.
- Ege, T. and Ringertz, N.R. 1974. Preparation of microcells by enucleation of micronucleate cells. Exp. Cell Res., 87: 378–382.
- Frackowiak, S., Labidi, B., Hernandez-Verdun, D., and Bouteille, M. 1986. Preservation of chromosome integrity during micronucleation induced by colchicine in PtK1 cells. Chromosoma, 94: 468–474.
- Ganem, N.J., Cornils, H., Chiu, S.Y., O’Rourke, K.P., Arnaud, J., Yimlamai, D., Thery, M., Camargo, F.D., and Pellman, D. 2014. Cytokinesis failure triggers hippo tumor suppressor pathway activation. Cell, 158: 833–848.
- Ghosh, S. and Paweletz, N. 1984. Nuclear asynchrony in multinucleate rat kangaroo cells. Eur. J. Cell Biol., 35: 304–311.
- Inoue, T., Nakayama, Y., Yamada, H., Li, Y.C., Yamaguchi, S., Osaki, M., Kurimasa, A., Hiratsuka, M., Katoh, M., and Oshimura, M. 2009. SIRT2 downregulation confers resistance to microtubule inhibitors by prolonging chronic mitotic arrest. Cell Cycle, 8: 1279–1291.
- Inoue, T., Nakayama, Y., Li, Y., Matsumori, H., Takahashi, H., Kojima, H., Wanibuchi, H., Katoh, M., and Oshimura, M. 2014. SIRT2 knockdown increases basal autophagy and prevents postslippage death by abnormally prolonging the mitotic arrest that is induced by microtubule inhibitors. FEBS J., 281: 2623–2637.
- Koi, M., Shimizu, M., Morita, H., Yamada, H., and Oshimura, M. 1989. Construction of mouse A9 clones containing a single human chromosome tagged with neomycin-resistance gene via microcell fusion. Japanese journal of cancer research: Gann, 80: 413–418.
- Kung, A.L., Sherwood, S.W., and Schimke, R.T. 1990. Cell line-specific differences in the control of cell cycle progression in the absence of mitosis. Proc. Natl. Acad. Sci. USA, 87: 9553–9557.
- Littlefield, J.W. 1964. Selection of Hybrids from Matings of Fibroblasts in Vitro and Their Presumed Recombinants. Science, 145: 709–710.
- Margulis, L. 1973. Colchicine-sensitive microtubules. Int. Rev. Cytol., 34: 333–361.
- Mayer, T.U., Kapoor, T.M., Haggarty, S.J., King, R.W., Schreiber, S.L., and Mitchison, T.J. 1999. Small molecule inhibitor of mitotic spindle bipolarity identified in a phenotype-based screen. Science, 286: 971–974.
- Nitta, M., Tsuiki, H., Arima, Y., Harada, K., Nishizaki, T., Sasaki, K., Mimori, T., Ushio, Y., and Saya, H. 2002. Hyperploidy induced by drugs that inhibit formation of microtubule promotes chromosome instability. Genes Cells, 7: 151–162.
- Oshimura, M. and Katoh, M. 2008. Transfer of human artificial chromosome vectors into stem cells. Reproductive biomedicine online, 16: 57–69.
- Rogakou, E.P., Pilch, D.R., Orr, A.H., Ivanova, V.S., and Bonner, W.M. 1998. DNA double-stranded breaks induce histone H2AX phosphorylation on serine 139. J. Biol. Chem., 273: 5858–5868.
- Sakaue-Sawano, A., Kurokawa, H., Morimura, T., Hanyu, A., Hama, H., Osawa, H., Kashiwagi, S., Fukami, K., Miyata, T., Miyoshi, H., Imamura, T., Ogawa, M., Masai, H., and Miyawaki, A. 2008. Visualizing spatiotemporal dynamics of multicellular cell-cycle progression. Cell, 132: 487–498.
- Sakaue-Sawano, A., Kobayashi, T., Ohtawa, K., and Miyawaki, A. 2011. Drug-induced cell cycle modulation leading to cell-cycle arrest, nuclear mis-segregation, or endoreplication. BMC Cell Biol., 12: 2.
- Sekiguchi, T., Shelton, K., and Ringertz, N.R. 1978. DNA content of microcells prepared from rat kangaroo and mouse cells. Exp. Cell Res., 113: 247–258.
- Swanton, C., Tomlinson, I., and Downward, J. 2006. Chromosomal instability, colorectal cancer and taxane resistance. Cell cycle, 5: 818–823.
- Takiguchi, M., Kazuki, Y., Hiramatsu, K., Abe, S., Iida, Y., Takehara, S., Nishida, T., Ohbayashi, T., Wakayama, T., and Oshimura, M. 2014. A novel and stable mouse artificial chromosome vector. ACS Synth Biol, 3: 903–914.
- Vitale, I., Galluzzi, L., Castedo, M., and Kroemer, G. 2011. Mitotic catastrophe: a mechanism for avoiding genomic instability. Nat. Rev. Mol. Cell Biol., 12: 385–392.
- Wandke, C. and Kutay, U. 2013. Enclosing chromatin: reassembly of the nucleus after open mitosis. Cell, 152: 1222–1225.
- Yamaguchi, S., Kazuki, Y., Nakayama, Y., Nanba, E., Oshimura, M., and Ohbaashi, T. 2011. A method for producing transgenic cells using a multi-integrase system on a human artificial chromosome vector. PLoS One, 6: e17267.
