Abstract
The adherens junction (AJ) is an actin filament-anchoring junction. It plays a central role in epithelial morphogenesis through cadherin-based recognition and adhesion among cells. The stability and plasticity of AJs are required for the morphogenesis. An actin-binding α-catenin is an essential component of the cadherin-catenin complex and functions as a tension transducer that changes its conformation and induces AJ development in response to tension. Despite much progress in understanding molecular mechanisms of tension sensitivity of α-catenin, its significance on epithelial morphogenesis is still unknown. Here we show that the tension sensitivity of α-catenin is essential for epithelial cells to form round spheroids through proper multicellular rearrangement. Using a novel in vitro suspension culture model, we found that epithelial cells form round spheroids even from rectangular-shaped cell masses with high aspect ratios without using high tension and that increased tension sensitivity of α-catenin affected this morphogenesis. Analyses of AJ formation and cellular tracking during rounding morphogenesis showed cellular rearrangement, probably through AJ remodeling. The rearrangement occurs at the cell mass level, but not single-cell level. Hypersensitive α-catenin mutant-expressing cells did not show cellular rearrangement at the cell mass level, suggesting that the appropriate tension sensitivity of α-catenin is crucial for the coordinated round morphogenesis.
Key words: α-catenin, vinculin, adherens junction, morphogenesis, mechanotransduction
Introduction
The epithelial tissue that separates the inside and outside of the living environment contributes to a significant part of morphogenesis. It is a sheet-like structure composed of epithelial cells connected by several types of cell-cell junctions. The epithelial sheet can stretch, bend, or partly protrude to form basic structures common among species, such as grooves, hollow structures, and branching (Honda, 2017). Experiments on the separation and reassembly of sea urchin embryos or sponges indicated that cells can sort themselves depending on tissue specificity and spontaneously reassemble their tissues (Herbst, 1900; Wilson, 1907). Differences in cell-cell adhesiveness (Steinberg, 1963) or surface tension of cells (Harris, 1976) were proposed as the primary factor causing sorting in mammalian cells. The actual morphogenesis in living organisms is more complex, and many studies have been conducted using various organisms. The studies also revealed the importance of signaling (Basson, 2012), programmed cell death (Voss and Strasser, 2020), cell division (Godard and Heisenberg, 2019), cell migration (Scarpa and Mayor, 2016), and cell deformation (Paluch and Heisenberg, 2009).
Many cellular deformations that directly contribute to large deformations of epithelial tissues depend on cytoskeletal remodeling, including actin dynamics and actomyosin contraction (Quintin et al., 2008; Wang, 2021). On the other hand, external forces such as shear stress (Sabine et al., 2012), osmotic pressure (Narayanan et al., 2020), or gravity (Porazinski et al., 2015) are also implicated in tissue deformation. Meanwhile, directed cell division and cell-cell rearrangement can alter tissue morphology (Pinheiro and Bellaïche, 2018). Recently, the involvement of these factors in epithelial morphogenesis has been intensively studied using theoretical approaches. Many mathematical models have been established to predict morphological changes in epithelial tissues in response to various stimuli (Glazier and Graner, 1993; Hirashima et al., 2017; Honda and Nagai, 2014; Ishihara et al., 2017; Okuda et al., 2015). These experimental and theoretical investigations provided a better understanding of the cell-level responses contributing to the morphogenesis of multicellular organisms.
Adherens junctions (AJs) serve as sites for transmitting tension between cells (Lecuit and Yap, 2015; Takeichi, 2014). AJs are formed near the apical region of cell boundaries, where the actin cytoskeleton is anchored by α-catenin (Yonemura, 2017). The deformation of individual cells connected by AJs causes the deformation of the entire epithelial sheet (Martin and Goldstein, 2014). In the process of epithelial morphogenesis, requiring strong tension, such as the ventral furrow formation in Drosophila embryos and the neural tube in vertebrates, AJs must maintain sufficient structural stability (Vasquez and Martin, 2016). Many molecules are involved in ensuring the structural stability of AJs. Cadherins enable adhesion to neighbor cells, and α-catenin binds to the cytoplasmic region through β-catenin to form the cadherin-catenin complex (Pokutta and Weis, 2007; Takeichi, 1995). α-Catenin binds to actin filaments either directly (Desai et al., 2013; Ishiyama et al., 2018) or by actin-binding proteins, including vinculin (le Duc et al., 2010; Miyake et al., 2006; Yonemura et al., 2010). α-Catenin is essential in AJ formation and actin association with the complex (Hirano et al., 1992; Torres et al., 1997; Vasioukhin et al., 2001; Watabe et al., 1994; Watabe-Uchida et al., 1998). In addition to α-catenin, other actin-binding proteins, such as afadin (Matsuzawa et al., 2018; Sakakibara et al., 2020) or ZO-1 (Itoh et al., 1997) accumulate in AJs, and actin filaments are also frequently associated with AJs in tissues. Among them, vinculin binds to α-catenin in a tension-dependent manner (le Duc et al., 2010; Miyake et al., 2006; Yonemura et al., 2010).
Under tension-free conditions, α-catenin does not bind to vinculin since the α-helix bundle containing the specific α-helix that binds to vinculin is stabilized by intramolecular interactions and cannot interact with vinculin (Hirano et al., 2018; Rangarajan and Izard, 2013). When tension larger than 5 pN is applied to the molecule, the α-helix bundle becomes unstable, allowing the vinculin-binding α-helix to be exposed and bind to vinculin (Hirano et al., 2018; Yao et al., 2014). It has been directly confirmed by atomic force microscopy (AFM) stretching and real-time total internal reflection fluorescence (TIRF) observation that vinculin is recruited when tension is applied to the α-catenin molecule (Maki et al., 2018).
What is the physiological significance of the tension sensitivity of α-catenin? Amino acid residues important for vinculin binding and tension-dependent conformational changes have been identified based on crystal structures, and tension sensitivity mutants have been generated (Hirano et al., 2018; Li et al., 2015; Peng et al., 2012). Using some of them, several groups have investigated the collective migration of epithelial cells, showing that the constitutive binding of vinculin to α-catenin reduces the speed of collective cell migration (Matsuzawa et al., 2018; Seddiki et al., 2018). Collective cell migration and local rearrangement between cells are essential for convergent extension (CE) (Tada and Heisenberg, 2012). An α-catenin mutant lacking the vinculin-binding site also decreases migration speed and prevents the completion of CE in zebrafish embryos (Han et al., 2016). Thus, although the contexts differ, there is accumulating evidence on the importance of proper binding and dissociation of actin-binding proteins to α-catenin in the planar movement in cells in the same direction. However, the significance of this property of α-catenin in three-dimensional (3D) morphogenesis is almost unknown.
In this study, we used a newly developed morphogenetic model system to investigate the significance of the tension sensitivity of α-catenin in the 3D morphogenesis of epithelial cells. We performed analyses at the molecular complex, cellular, and multicellular levels. They suggested that α-catenin’s ability to dissociate actin-binding proteins in a tension-dependent manner is essential for normal AJ maturation and the spheroid rounding morphogenesis.
Materials and Methods
Cell culture
DLD-1 cells from ATCC, its subclone R2/7 cells (Watabe-Uchida et al., 1998) (provided by F. van Roy, Ghent University, Belgium), and R2/7 cell lines expressing various α-catenin mutants were cultured in Dulbecco’s Modified Eagle Medium (DMEM; Wako) supplemented with 10% fetal bovine serum (FBS).
Spheroid formation
For the spheroid formation in round-bottomed wells, non-adherent round-bottomed 96-well plates (EZ-BindShut SP, Iwaki) were used. Cells were seeded in each well at 100 cells/well, and cultured for 48 h. For the spheroid formation in V-bottomed rectangular microwells, polydimethylsiloxane (PDMS; Sylgard 184, Dow Corning) or CYTOP (CTX-809SP2, Asahi Glass) was shaped by a metal mold according to manufacturers’ instructions and attached to a 35 mm glass-bottomed dish (Matsunami Glass), then treated with 10% Poloxamer 188 (Pluronic F68, GE Healthcare) overnight to prevent cell attachment (Wang et al., 2014; Wu and Hjort, 2009). The dish was rinsed thrice using PBS and filled with culture medium or imaging medium (FluoBrite DMEM, Thermo Fisher) supplemented with 10% FBS. A glass cloning cylinder (inner diameter 7 mm; Iwaki) was placed on the substrate to limit the area of cell seeding (1×10⁵ cells for the cell tracking and 2×10⁵ cells for all other experiments). Cells were cultured in the microwells for 48 h. For spheroid formation on an ECM gel, 10 μL Matrigel (Corning) was placed on round coverslips (diameter 14 mm, Matsunami Glass) and gelled by incubating for 10 min at 37°C. Cell suspension (1×10⁵ cells) was added on the gel, and cells were cultured for 9–24 h.
Spheroid fusion
For spheroid fusion assays, R2/7 cell lines expressing WT or mutant α-catenin were cultured on V-bottomed square microwells (width 250 μm×height 250 μm×depth 160 μm) for 24 h to obtain relatively small spheroids. Two spheroids were picked up using a micropipette and transferred together into one well of non-adherent V-bottomed 96-well plates (EZ-BindShut SP, Iwaki). Then, the two spheroids were allowed to contact each other and were cultured for 9 h.
Preparation of metal molds
The mold for making PDMS microwells was manufactured by ultraprecision cutting using a single crystal diamond tool with an ultrahigh precision machine (NPIC-M200, Nagase Integrex Co., Ltd.). The material of the mold was nickel-phosphate electroless plating (thickness of 300 μm) on a stainless-steel base with diameter of 10 mm and height of 6 mm. The diamond cutting tool had rectangular edge with flat end of 50 μm and nose angle of 53 degrees to form the shape of the well wall and bottom. The final depth of cut was 0.4 μm, and surface roughness of 4 nm in average was obtained. After the mold was formed by cutting, a fluorocarbon coating was deposited by a reactive ion etching machine so that PDMS can be easily removed from the mold.
Antibodies and reagents
The following primary antibodies were used: anti-α-catenin rabbit polyclonal antibody (C2018) and anti-vinculin mouse monoclonal antibody (VIN-11-5; Sigma-Aldrich); anti-β-catenin mouse monoclonal antibody (BD Bioscience); anti-E-cadherin rat monoclonal antibody (ECCD-2; a gift from M. Takeichi, RIKEN, Japan); anti-DDDDK tag rabbit polyclonal antibody, which recognizes the Flag tag (MBL); anti-ZO-1 mouse monoclonal antibody (T8-754; a gift from Sa. Tsukita, Osaka University, Japan); anti-GAPDH rabbit monoclonal antibody (14C10; Cell Signaling Technology). Horseradish peroxidase (HRP)-conjugated goat anti-rabbit IgG antibody (Kirkegaard & Perry Laboratories) was used as a secondary antibody for immunoblotting. MagicMark XP Western Protein Standard (Thermo Fisher) was used as a protein marker. Alexa Fluor 488- conjugated donkey anti-mouse IgG, Alexa Fluor 488- conjugated donkey anti-rat IgG, Alexa Fluor 555- conjugated donkey anti-mouse IgG, Alexa Fluor 555- conjugated donkey anti-rabbit IgG, Alexa Fluor 647- conjugated donkey anti-mouse IgG, or Alexa Fluor 647- conjugated donkey anti-rabbit IgG antibodies (Thermo Fisher) were used as secondary antibodies for immunofluorescent staining. Alexa Fluor 350-, 488- or 647-conjugated phalloidin (Thermo Fisher) was used for staining actin filaments. 4',6-diamidino-2-phenylindol (DAPI; Dojindo Laboratories) was used for nuclei staining.
(–)-Blebbistatin (Wako) was prepared as a 50 mM stock in DMSO and used at 50 μM. Cytochalasin D (Sigma) was prepared as a 2 mM stock in DMSO and used at 2 μM. Jasplakinolide (Calbiochem) was prepared as a 1 mM stock in DMSO and used at 10 μM. Dynasore (Santa Cruz) was prepared as an 80 mM stock in DMSO and used at 80 μM. MiTMAB (Abcam) was prepared as a 100 mM stock in water and used at 30 μM.
Immunoblotting
Cells (2.5×10⁵ cells) were cultured for 1 day, washed twice with ice-cold PBS, and lysed with lysis buffer [50 mM Tris-HCl (pH 7.5), 150 mM NaCl, 0.1% SDS, 1% TritonX-100, 1% Sodium deoxycholate, protease inhibitor cocktail (Nacalai)]. Proteins were resolved conventionally by SDS-PAGE and western blotting. Densitometric quantification of the immunoblotted bands was performed using the Gel Analyzer module in ImageJ.
Immunostaining
Fixed samples were processed conventionally for immunofluorescence microscopy as previously described (Miyake et al., 2006; Watanabe et al., 2007). For staining of spheroids, spheroids formed in V-bottomed microwells were collected in microtubes. The duration of each operation was: fixation (30 min), permeabilization (10 min), washing (10 min; once after permeabilization, thrice after antibody incubations), primary and secondary antibody incubation (overnight at 4°C and 2 h at room temperature, respectively).
Imaging
Images were taken using the following microscopes. For phase-contrast live-imaging, a Leica DMIRE2 inverted microscope equipped with a CCD camera (Sensicam, PCO) controlled by the software package MetaMorph version 7.7.7.0 (Molecular Devices), a stage-top CO2 incubator (Tokai Hit), and an N Plan 2.5×/0.07NA Ph1 lens was used. For imaging of fixed samples, 1) a Nikon A1R inverted confocal microscope controlled by Nikon NIS-Elements software (Nikon), equipped with a Plan Apo VC 60×/1.40NA or a Plan Apo Lambda 40×/0.95NA lens, or 2) an Olympus BX51 microscope equipped with a CCD camera (ORCA ER, Hamamatsu Photonics) controlled by the software package IPLab Spectrum version 3.5.4 (Scanalytics), equipped with a Plan Apo N 60x/1.42NA lens was used. For confocal live-imaging, 1) the Nikon A1R microscope equipped with a stage-top CO2 incubator (Tokai Hit) and a Plan Apo VC 20×/0.75NA lens, or 2) an Olympus IX71 inverted microscope equipped with a spinning disk confocal unit (CSU-X1, Yokogawa) and CMOS camera (Orca Flash 4.0, Hamamatsu Photonics) controlled by software package MetaMorph version 7.10.2.240 (Molecular Devices), a stage-top CO2 incubator (Tokai Hit), and a UPlan S Apo 20×/0.75NA lens was used.
Plasmids and transfection
A vector expressing full-length mouse αE-catenin with a Flag tag at its C terminus (pCA-αE-catenin–Flag) (Abe et al., 2004) was a gift from M. Takeichi (RIKEN BDR, Japan). pCA-αE-catenin-Flag (L344P) was constructed using site-specific mutagenesis to introduce a mutation resulting in the single amino acid substitution from L to P (Peng et al., 2012) into pCA-αE-catenin-Flag. Stable clones expressing mutant α-catenin [1–906(L344P)] were established as previously described (Yonemura et al., 2010).
The expression vector of histone H2B tagged with EGFP at the C-terminus was generated using the EGFP-N1 vector (Clontech). The amplified H2B cDNA was cloned into the HindIII/BamHI site of EGFP-N1. R2/7 cells stably expressing WT (1–906) or mutant [1–906 (L378P or L344P)] α-catenin were transfected with this vector. EGFP-expressing cells were sorted using a cell sorter (SH800, Sony), sparsely replated, and then single clones were isolated.
Image analyses
Images were processed and analyzed using ImageJ software (National Institutes of Health) or CellProfiler software (Carpenter et al., 2006). To measure spheroid morphology, the outlines of spheroids were traced by freehand drawing, and the circularity (“form factor” in CellProfiler) was calculated using the formula:
|
circularity
=
4
π
area
perimete
r
2
|
To measure punctum adherens (PA) length, confocal Z-stack images of α-catenin and F-actin were projected to single images by maximum projection. Spot-like α-catenin-positive objects attached to F-actin bundles were considered PAs. The max Feret diameter of PA was manually measured.
To measure TJ length, confocal Z-stack images of nuclei and ZO-1 were projected as well. The EnhanceOrSuppressFeatures module of CellProfiler enhanced linear structures in the ZO-1 channel, and automated segmentation was performed to define the TJ-formed region. The TJ region was then skeletonized to single-pixel width, and the number of pixels representing the total TJ length was counted. Cell number was counted using automated nuclei segmentation, and TJ length was normalized by dividing using the cell number or field area.
To analyze cell movements during the spheroid formation, 3D DoG (Difference of Gaussian, combined Gaussian radii in sigma of 1.9/3.8 pixels for X/Y dimensions, and 0.7/1.4 pixels for Z dimension) was performed to emphasize nucleus shape and identified distinct nuclei by finding local maxima. These nuclei positions were stored in a SQL database (SQLite3), and their displacements throughout the time series were joined using the nearest neighbor method.
To analyze the morphology of spheroid doublets during fusion, doublet length and contact length measurements were recorded manually by drawing a single line along the long axis of a pair of spheroids or the fused region (the border of two spheroids), respectively.
Statistical analyses
Data are expressed as mean±95% confidence interval (CI) of at least three independent experiments. All statistical analyses were performed in R software. P-values were calculated using Student’s t-test for comparison of two groups, and One-way ANOVA followed by Dunnett’s or Tukey’s multiple comparison tests for more than three groups, respectively. In all cases, P<0.05 was considered statistically significant.
Results
Importance of tension sensitivity of α-catenin on 3D morphogenesis of epithelial cells
To clarify the significance of the tension sensitivity of α-catenin in 3D epithelial morphogenesis, α-catenin mutants with artificially manipulated tension sensitivity for vinculin binding in the middle of the molecule (Hirano et al., 2018; Peng et al., 2012; Yonemura et al., 2010) were expressed in R2/7 cells, an α-catenin-deficient subclone of DLD-1 cells derived from human colorectal cancer (van Hengel et al., 1997; Watabe-Uchida et al., 1998) (Fig. 1A). We confirmed that all mutant α-catenin molecules are colocalized with E-cadherin and β-catenin together with F-actin at the apical junction regions (Fig. S1), allowing tight junction (TJ) formation (Hirano et al., 2018; Yonemura et al., 2010), and show comparable levels of WT or mutant α-catenin expression (Fig. S2). These data indicate that the essential α-catenin function remains in all mutants although precise adhesion activities may differ. Under conventional two-dimensional (2D) culture conditions, only slight differences were observed in epithelial sheet formation. Therefore, a 3D culture model was used in this study to eliminate the effect of the stiff substrate on the sheets, and to see morphogenesis that reflects the nature of the AJ more strongly.
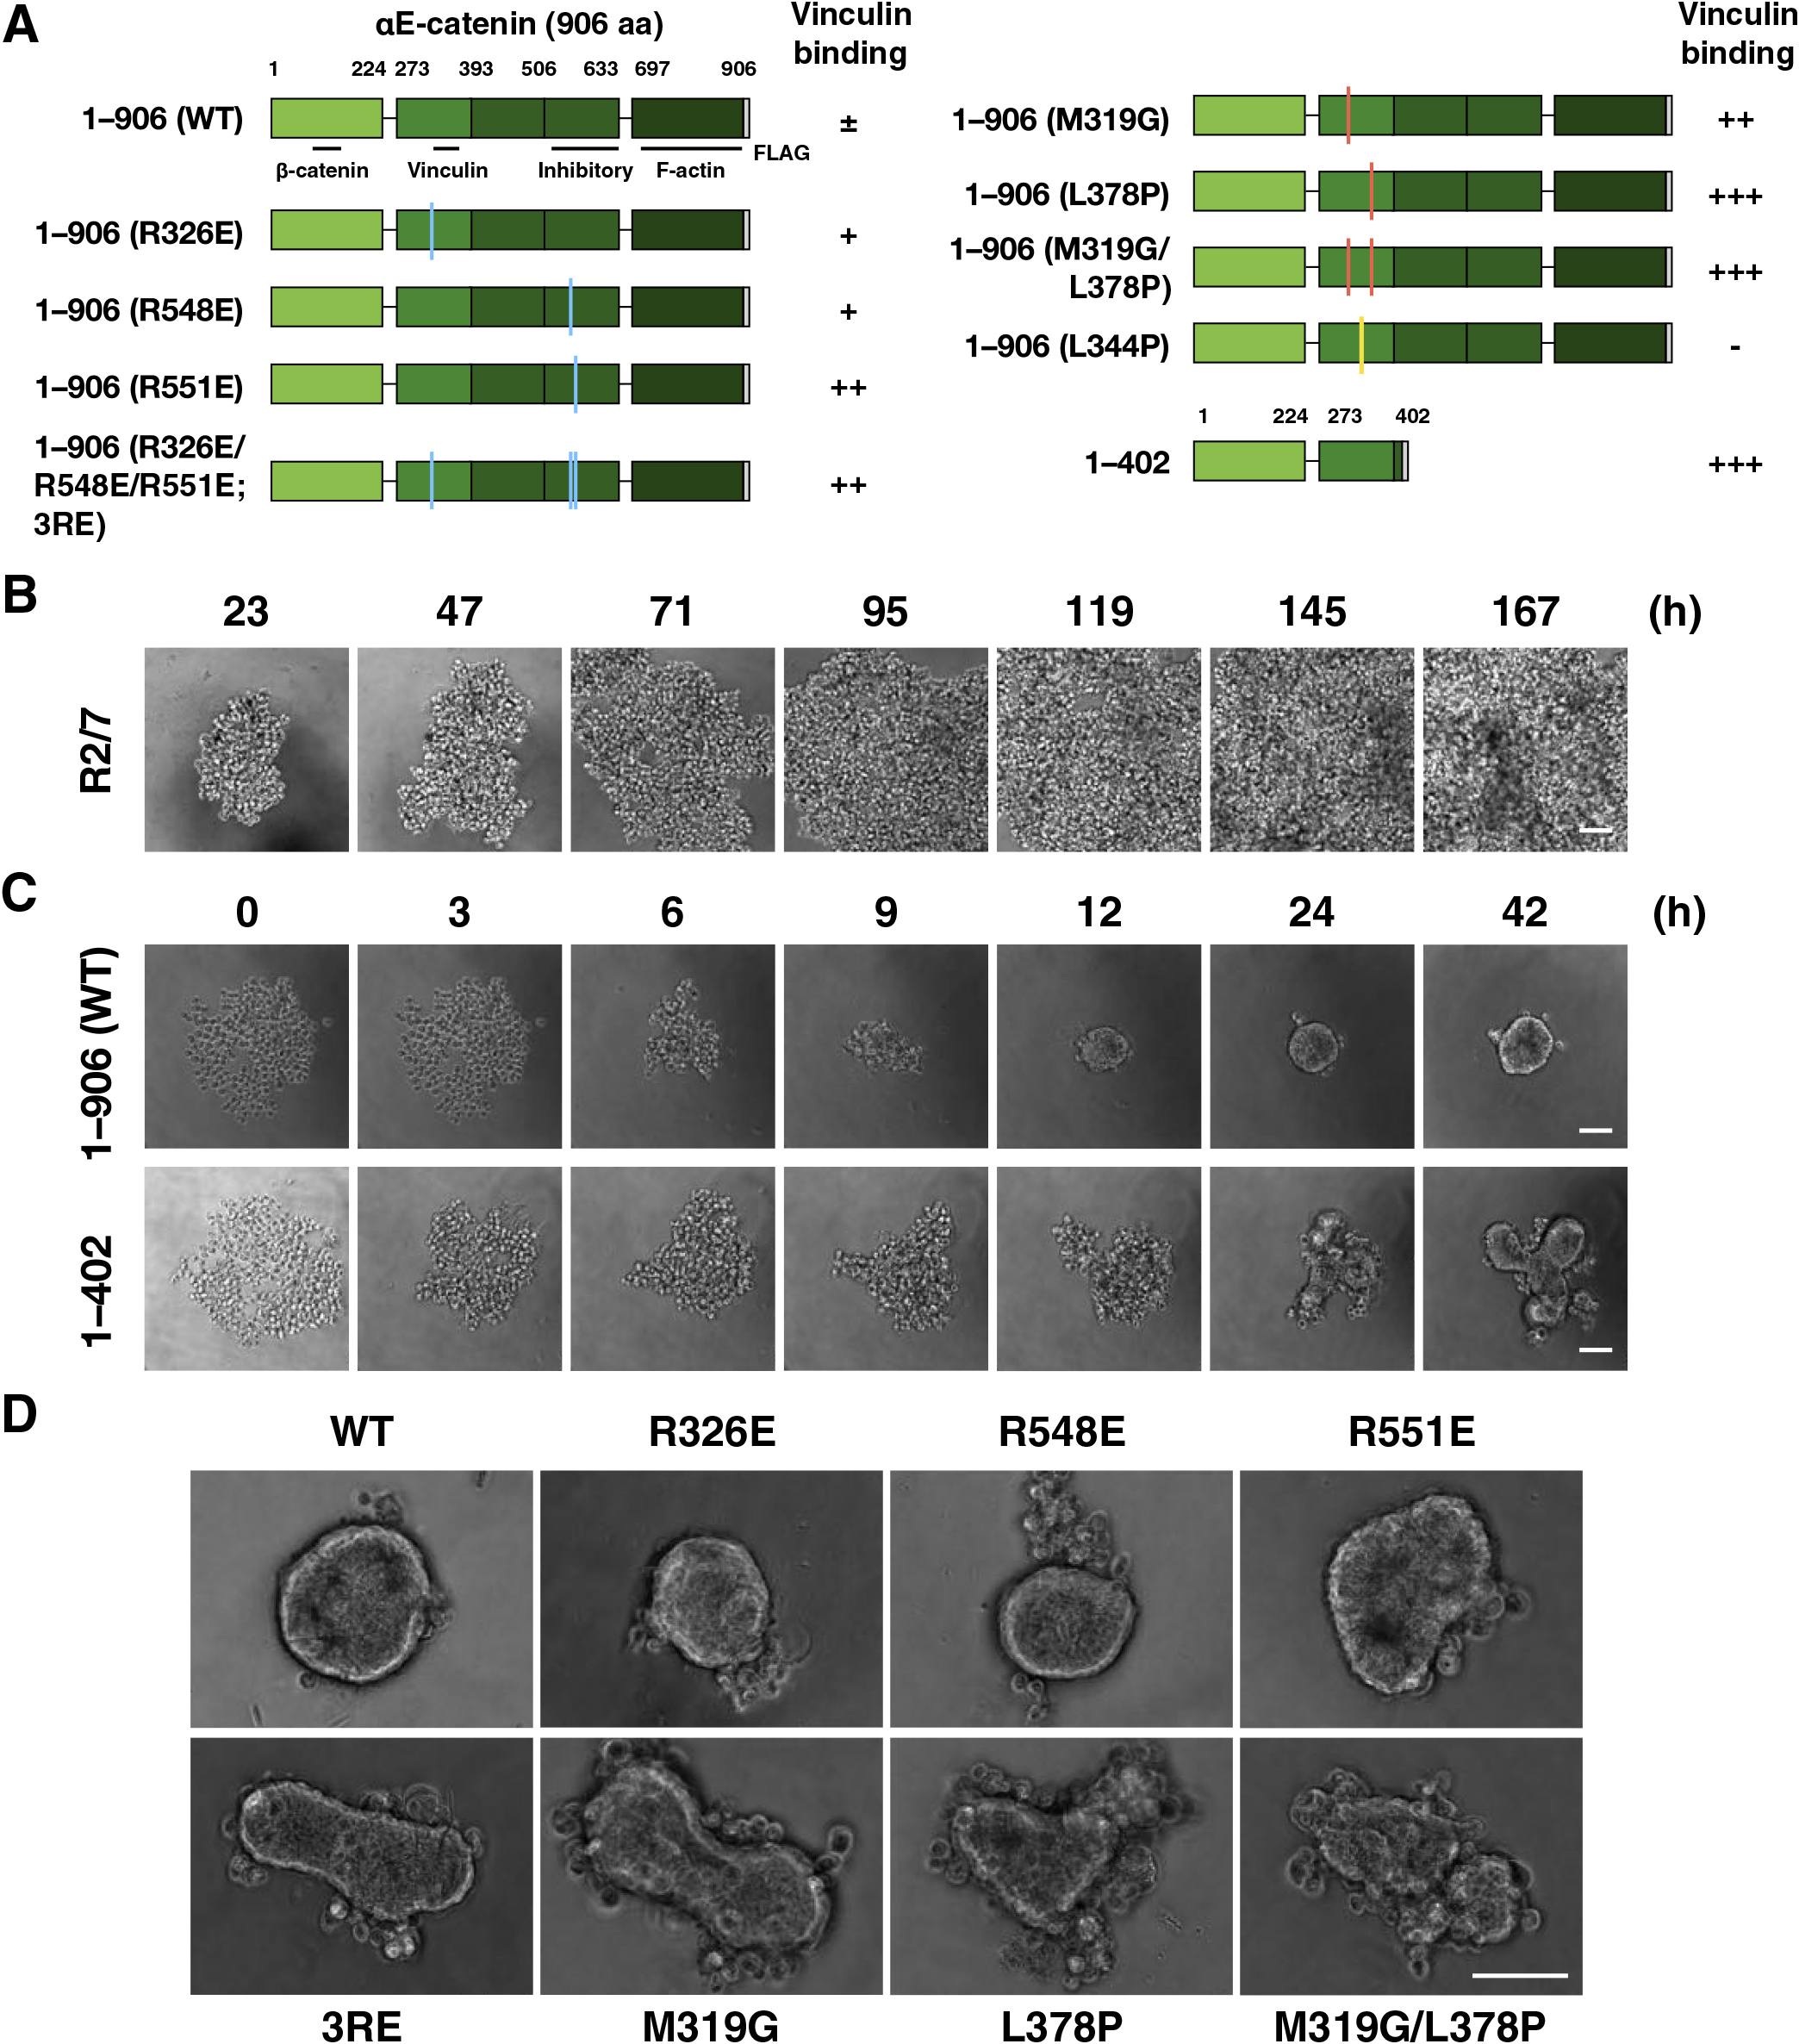
First, we tested if the tension sensitivity of α-catenin is involved in 3D epithelial morphogenesis (Fig. 1A). Cells were seeded into non-adherent round-bottomed wells, and the morphology of the cell mass was recorded over time. Parental R2/7 cells did not adhere each other, maintaining the original round shape of each cell for 7 days (Fig. 1B). R2/7 Cells expressing WT α-catenin formed a single aggregate with a smooth surface, whereas cells expressing the C-terminal deletion mutant (1–402) formed a single aggregate but with a distorted shape (Fig. 1C and Movie 1). Point mutants with different levels of increased tension sensitivity (R326E, R548E, R551E, R326/548/551E; 3RE, M319G, L378P, and M319G/L378P) (Hirano et al., 2018) expressing cells also formed distorted spheroids according to the degree of enhanced tension sensitivity (Fig. 1D and Movie 2). These results indicate the importance of α-catenin tension sensitivity in spheroid morphogenesis into a round shape.
Construction of an experimental epithelial morphogenesis model and quantitative analysis
In the round-bottomed wells, the projection image of the initial shape from above was circular like the final shape, which was hard to control (Fig. 1 and Fig. 2A). Therefore, developing a new 3D culture model was attempted in which the initial shape could be controlled, and quantitative image analysis is possible. Dispersed cells were seeded into V-bottom rectangular microwells made of nonadhesive polydimethylsiloxane (PDMS) molded in a metal mold (Fig. 2A).

To investigate the relationship between the initial and final shapes of the cell aggregates, spheroid formation experiments with DLD-1 cells were performed using the microwell with several different aspect ratios. The initial shape of the cell mass remained unchanged until about 4–5 h after seeding and changed to a spherical shape by 12–18 h (Fig. 2B and Movie 3). To evaluate this temporal change more objectively, the projected contour of the spheroid in the XY plane was traced, and the temporal change of its circularity was plotted (Fig. 2C). Although the cells were actively oscillating up to 4–5 h after seeding, there was little change in the circularity (the latent phase in this report). An increase in circularity was observed between 5 and 18 h, especially up to 12 h (rising phase). After that, the circularity remained almost constant (static phase). The final circularity and the length of time to reach it were almost constant regardless of the aspect ratio of the initial shape. In this suspension culture system, DLD-1 cells eventually became spherical even if the aspect ratio of the initial shape was large up to 3:1.
Next, the dependence of this morphogenetic process on α-catenin was confirmed (Fig. S3 and Movie 4). As shown in Fig. 2, DLD-1 cell aggregates formed round spheroids (Fig. S3A–C and Movie 4). In contrast, R2/7 cells lacking α-catenin expression showed no change in cell mass shape over time. Stable expression of full-length WT α-catenin (1–906) rescued this abnormality fully (Fig. S3A–C and Movie 4). Although other proteins may be involved in cell adhesion in general, this morphogenesis depends on the cadherin-catenin complex containing α-catenin.
Detailed analyses of α-catenin tension sensitivity in the process of rounding morphogenesis
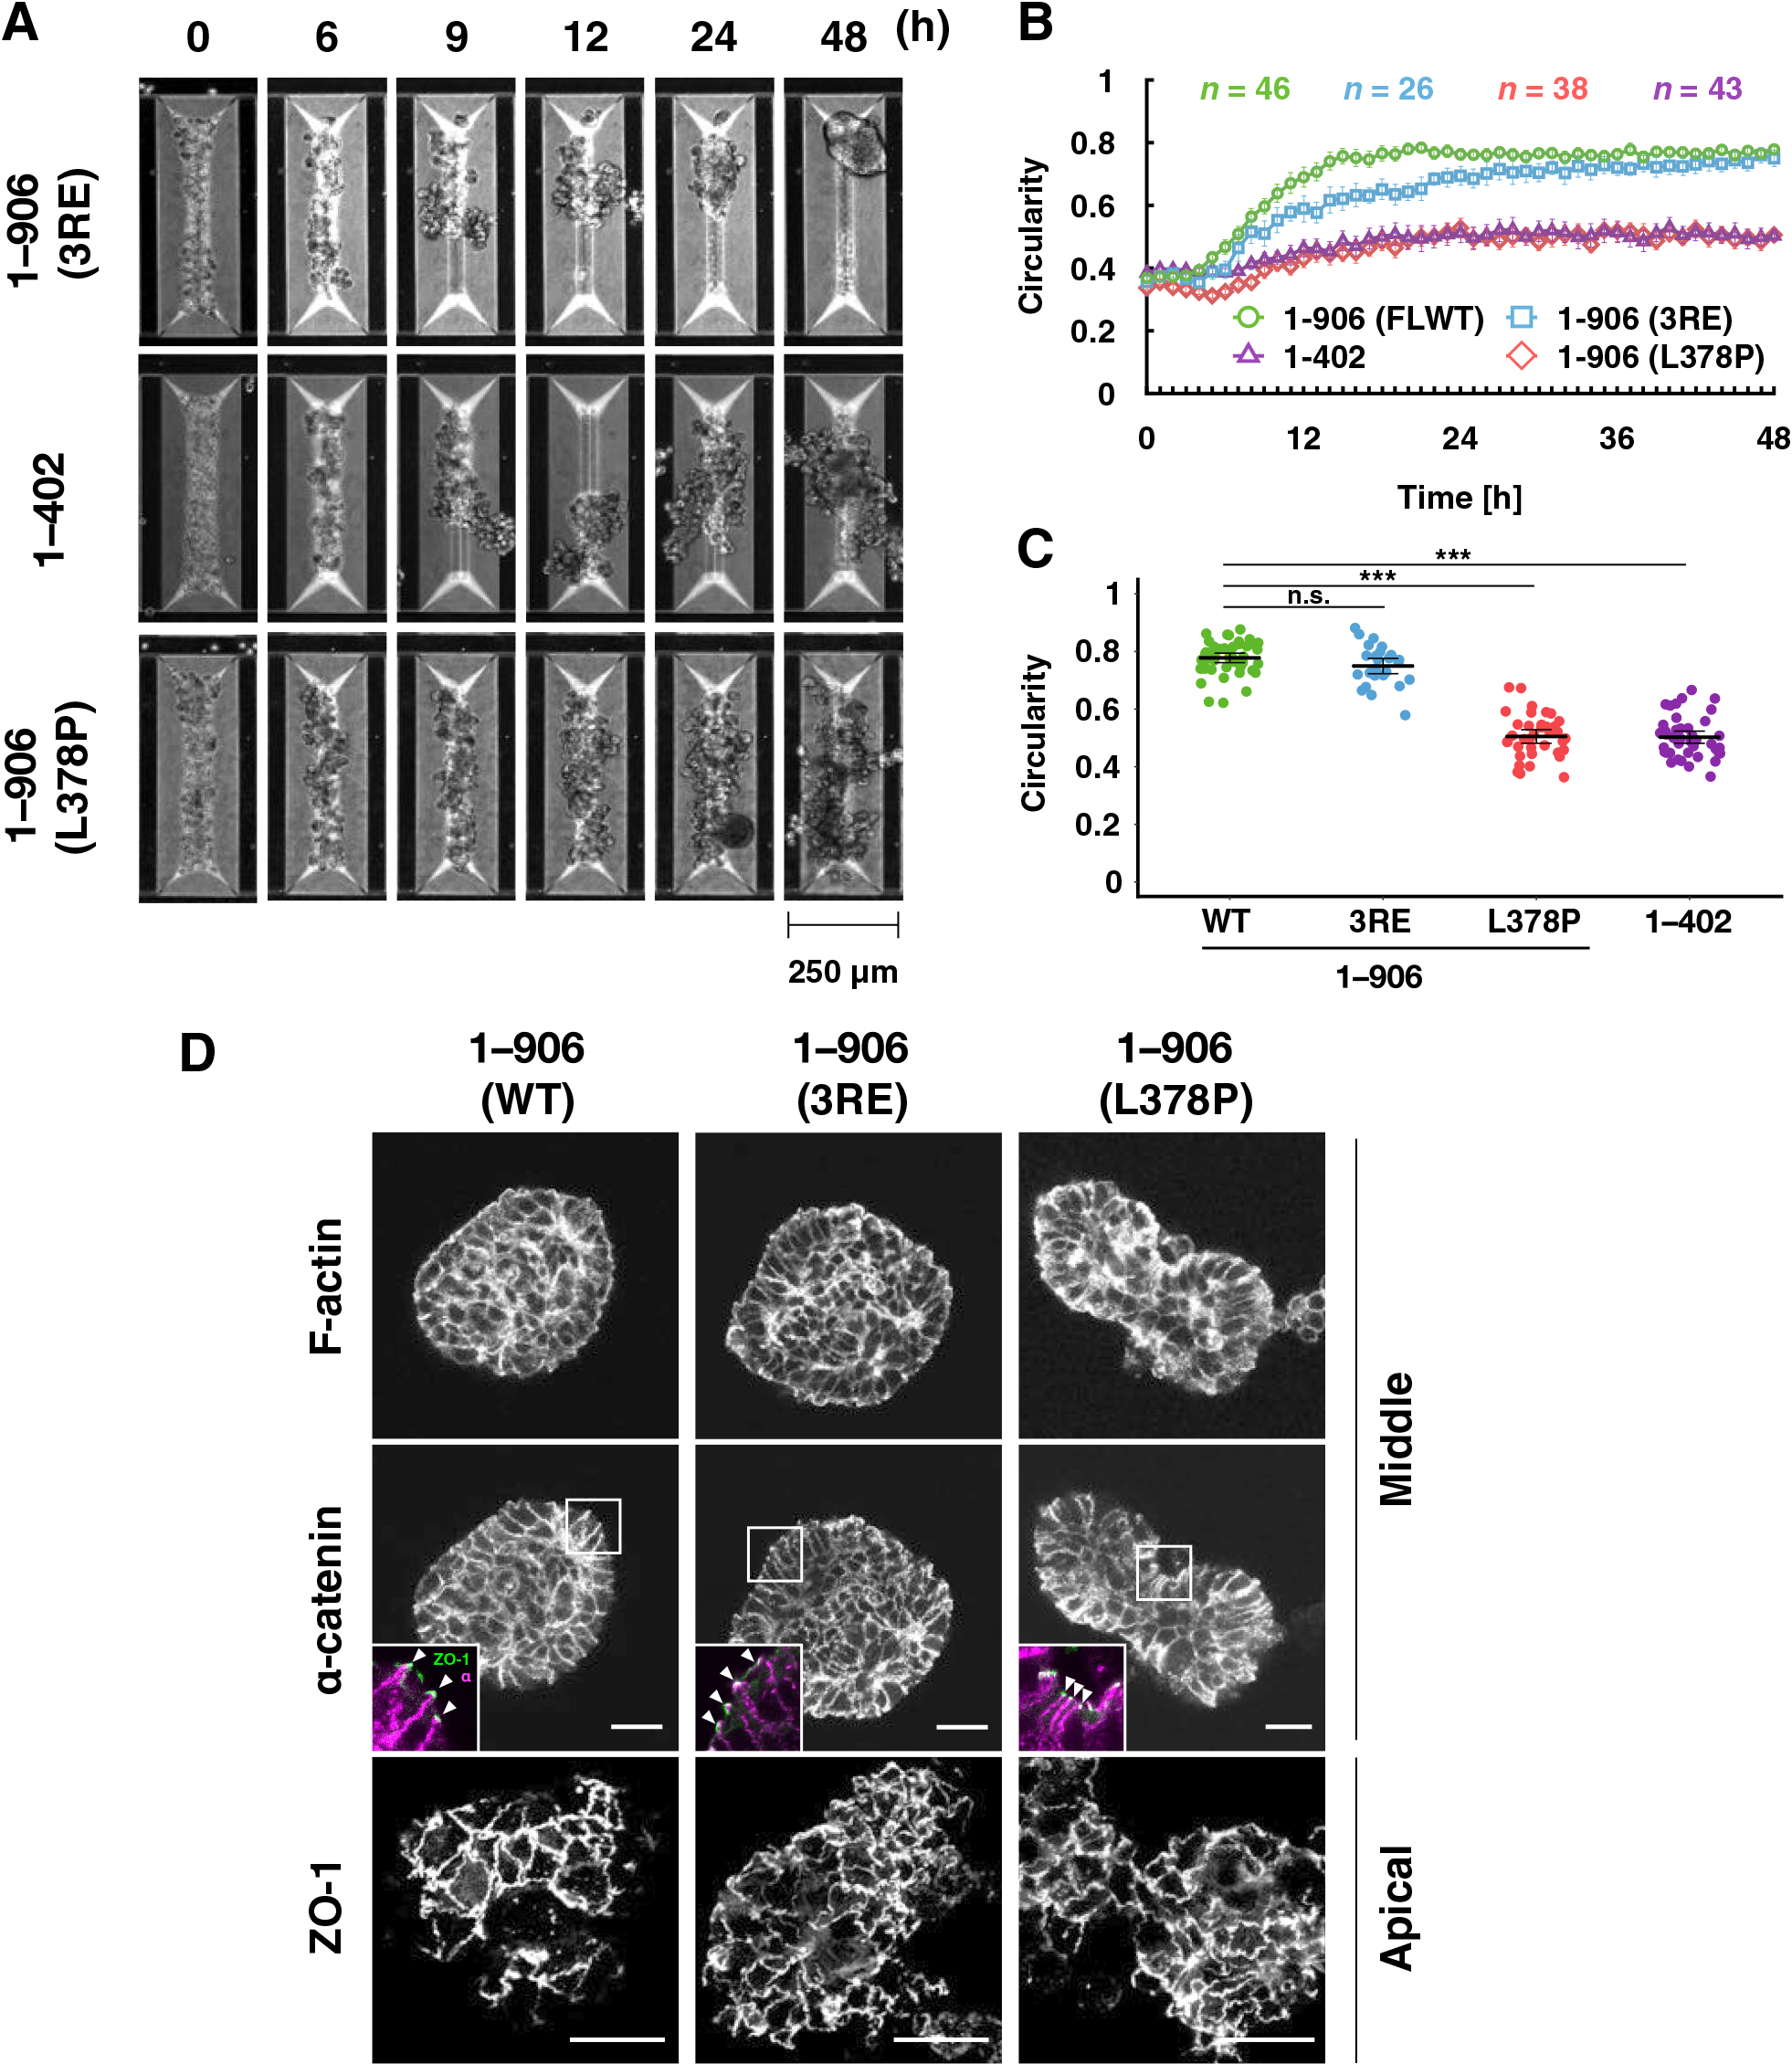
First, the effect of mutations that increases the tension sensitivity of α-catenin on the spheroid formation was examined (Fig. 3 and Movie 5). The triple point mutations, 3RE, in which tension sensitivity is increased compared to WT, caused a delay in the shape change, although the final morphology was similar to WT (Fig. 3A and Movie 5). Cells expressing mutant α-catenin with hypersensitivity to tension (L378P or the C-terminal deletion, 1–402) showed insufficient rounding and less smooth contours than WT, respectively. The onset of the rising phase was less clear and the slope of the increase in circularity was smaller than that of the WT (Fig. 3B), and the circularity remained lower than that of the WT for 48 h (Fig. 3C). We visualized cell-cell adhesion in spheroids after 48 h using immunofluorescence staining. TJs were formed in a typical uniform network in WT-expressing cells, indicating that the cortical cell layer of the spheroid is considered a fully developed epithelial sheet (Fig. 3D). Point mutations (3RE and L378P) did not affect the formation of TJs (Fig. 3D). These results quantitatively demonstrate that appropriate tension sensitivity of α-catenin, which allows vinculin release under low tension, is vital for rounding during spheroid formation. The morphogenetic abnormality caused by increased sensitivity is not due to a severe disturbance in the formation of cell-cell adhesion.
The vinculin binding-null mutant (L344P; Fig. 4) (Peng et al., 2012) can be interpreted as a dull tension sensitivity mutant that cannot respond to any degree of tension for vinculin binding. This mutation caused a slight delay in the increase in circularity but did form round spheroids (Fig. 4A, B, and Movie 5). The circularity during the static phase was significantly higher in cells expressing α-catenin (L344P) than in WT-expressing cells (Fig. 4C). Cells expressing this mutation also exhibited normal intercellular adhesion formation (Fig. 4D), as did the WT and other mutants (Fig. 3D). These results led us to think that rounding morphogenesis in this system requires very low tension, releasing vinculin from AJs.
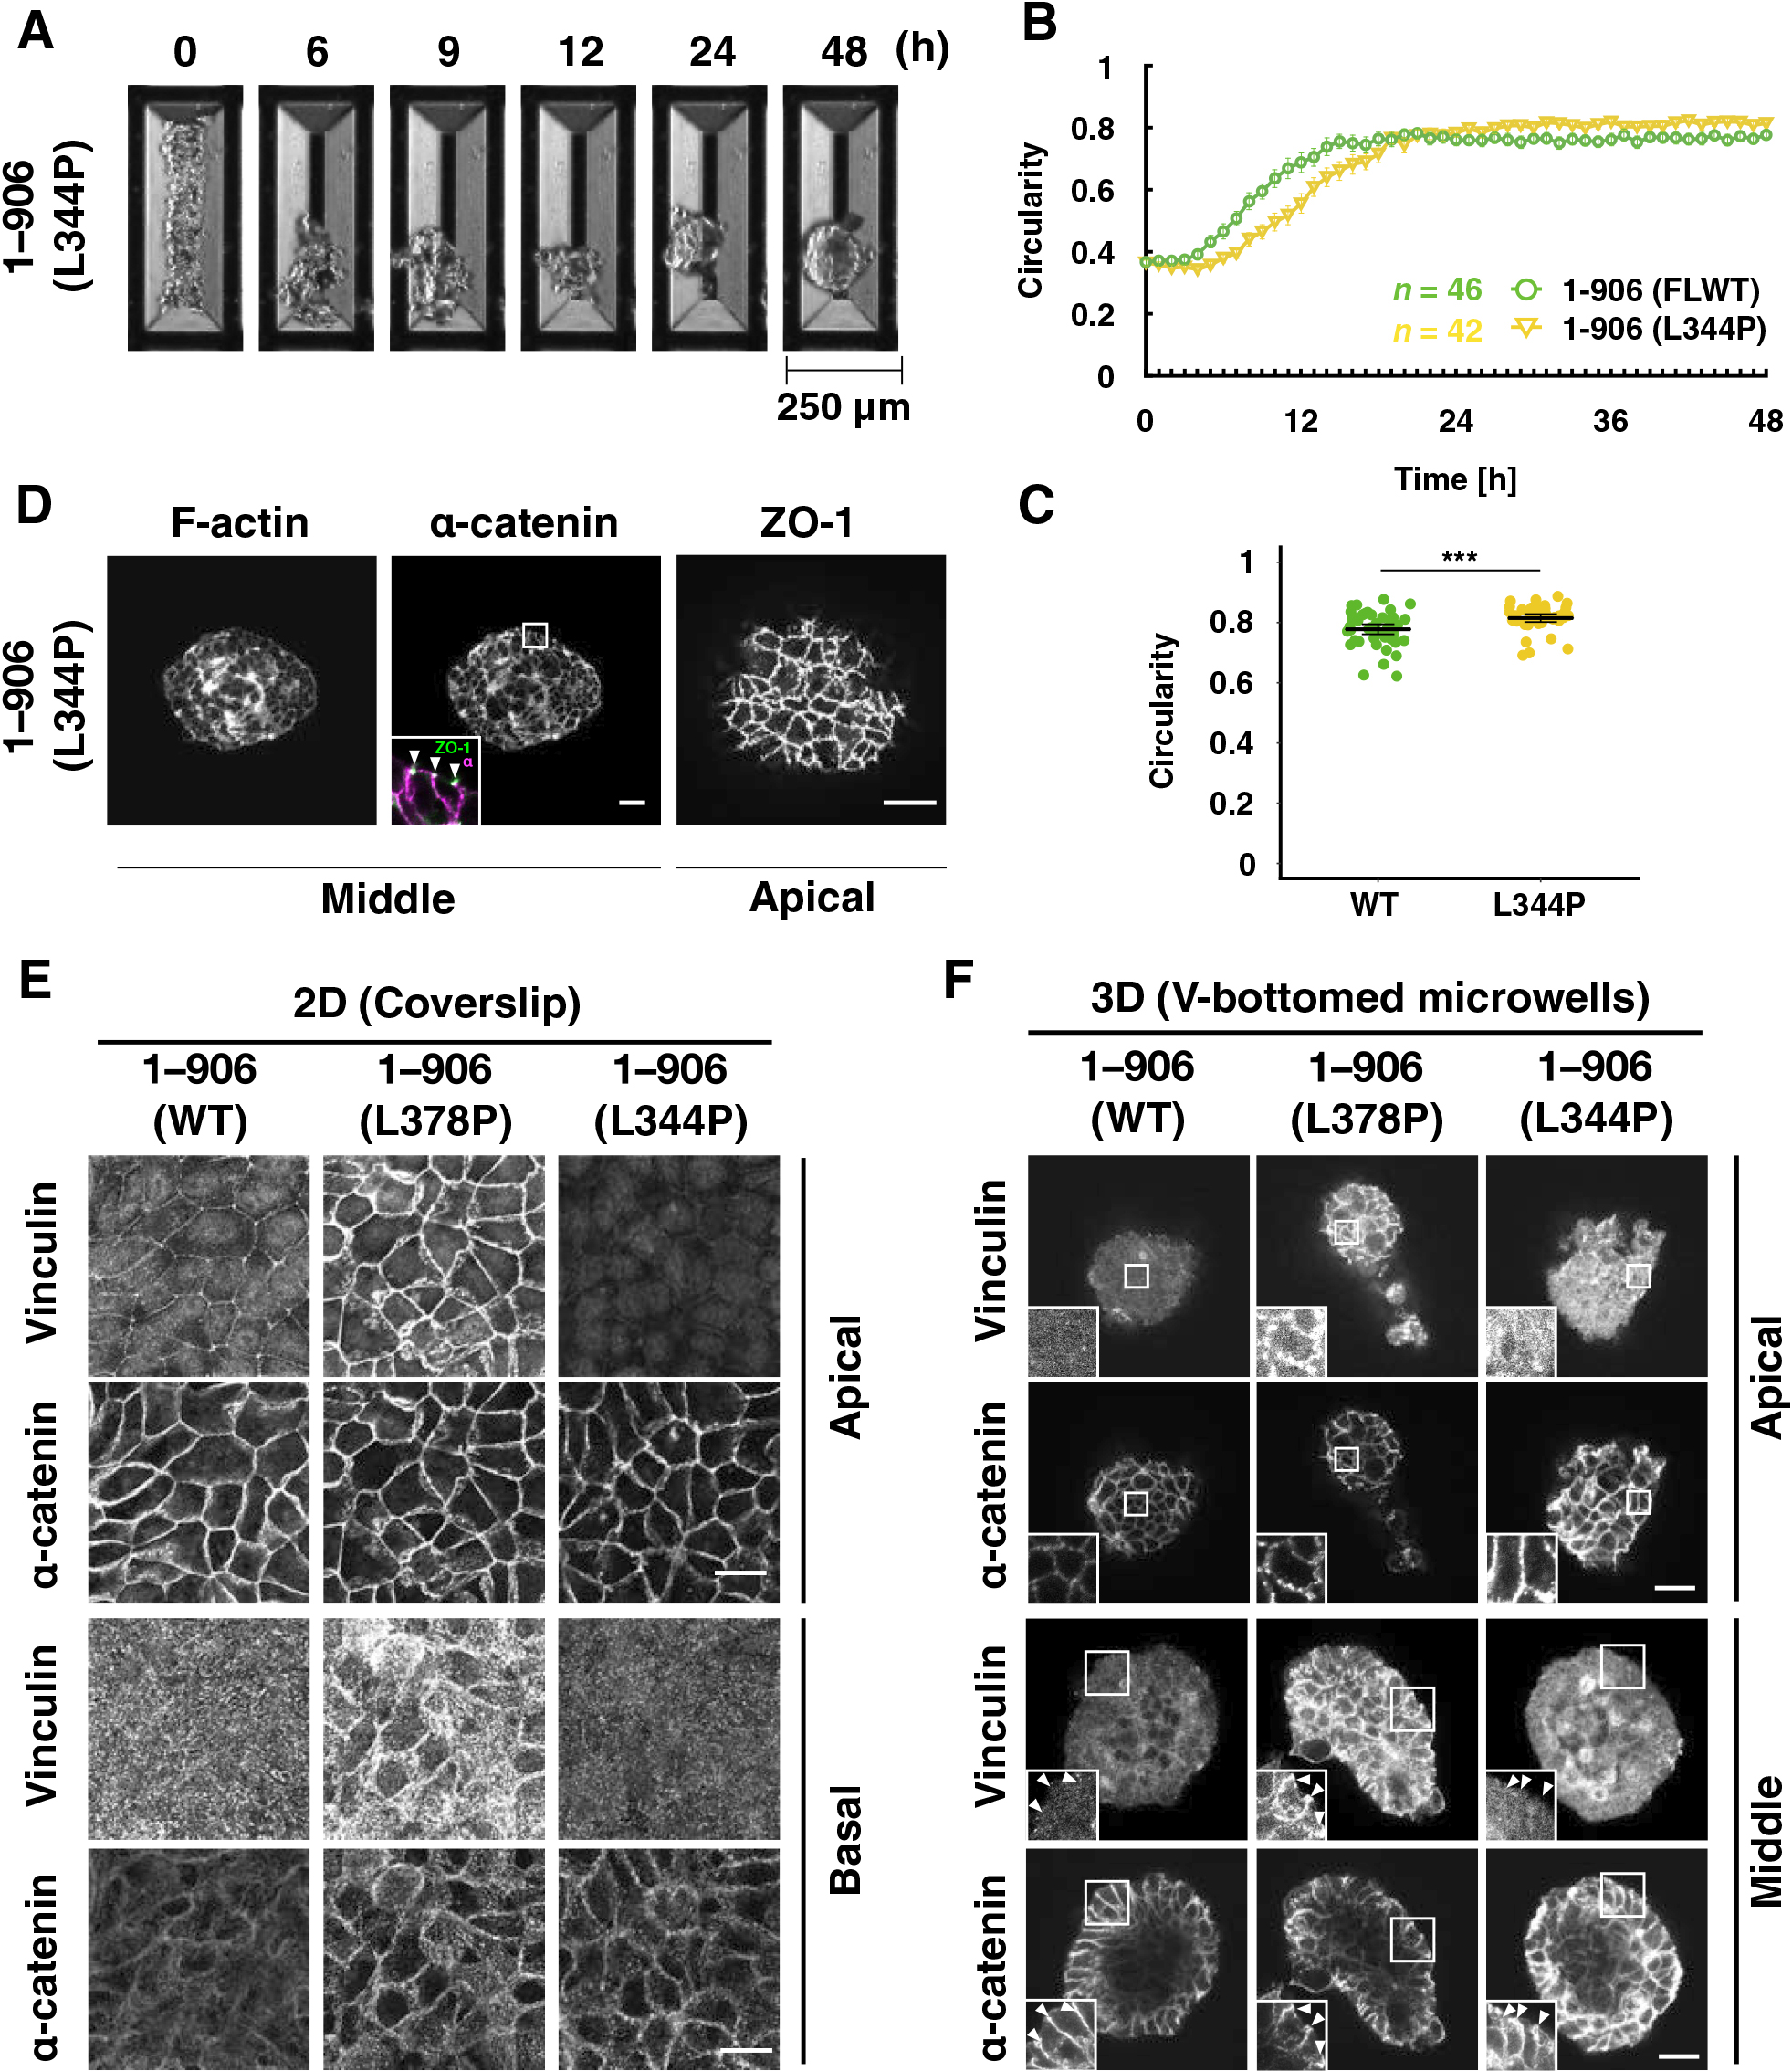
In 2D culture, WT-expressing cells showed vinculin accumulation mainly at cell boundaries, especially at vertexes where several cells meet (Fig. 4E). In contrast, there was little vinculin accumulation at cell boundaries in the 3D culture (Fig. 4F). The L378P mutation in α-catenin caused substantial vinculin accumulation at the cell boundary in 2D and 3D cultures, while the L344P mutation did not. Cells cultured in the presence of Blebbistatin from seeding until 48 h showed a similar spheroid formation to untreated cells (Fig. S4 and Movie 7), indicating that the contractile force of myosin II does not contribute much to the spheroid formation in this system. Myosin II activity suppression in cells expressing point mutants (3RE and L378P) caused no obvious difference in morphogenesis compared with untreated cells, indicating that myosin II activity is not involved in morphological abnormalities caused by the mutations. (Fig. S4 and Movie 7).
Alternatively, when actin polymerization and depolymerization were inhibited by cytochalasin D (CytoD) and Jasplakinolide (Jasp), respectively, both inhibitors completely suppressed round spheroid formation (Fig. S5 and Movie 8). It clearly indicates that the round spheroid formation is strongly dependent on actin remodeling.
The effect of tension sensitivity of α-catenin on the maturation process of AJ
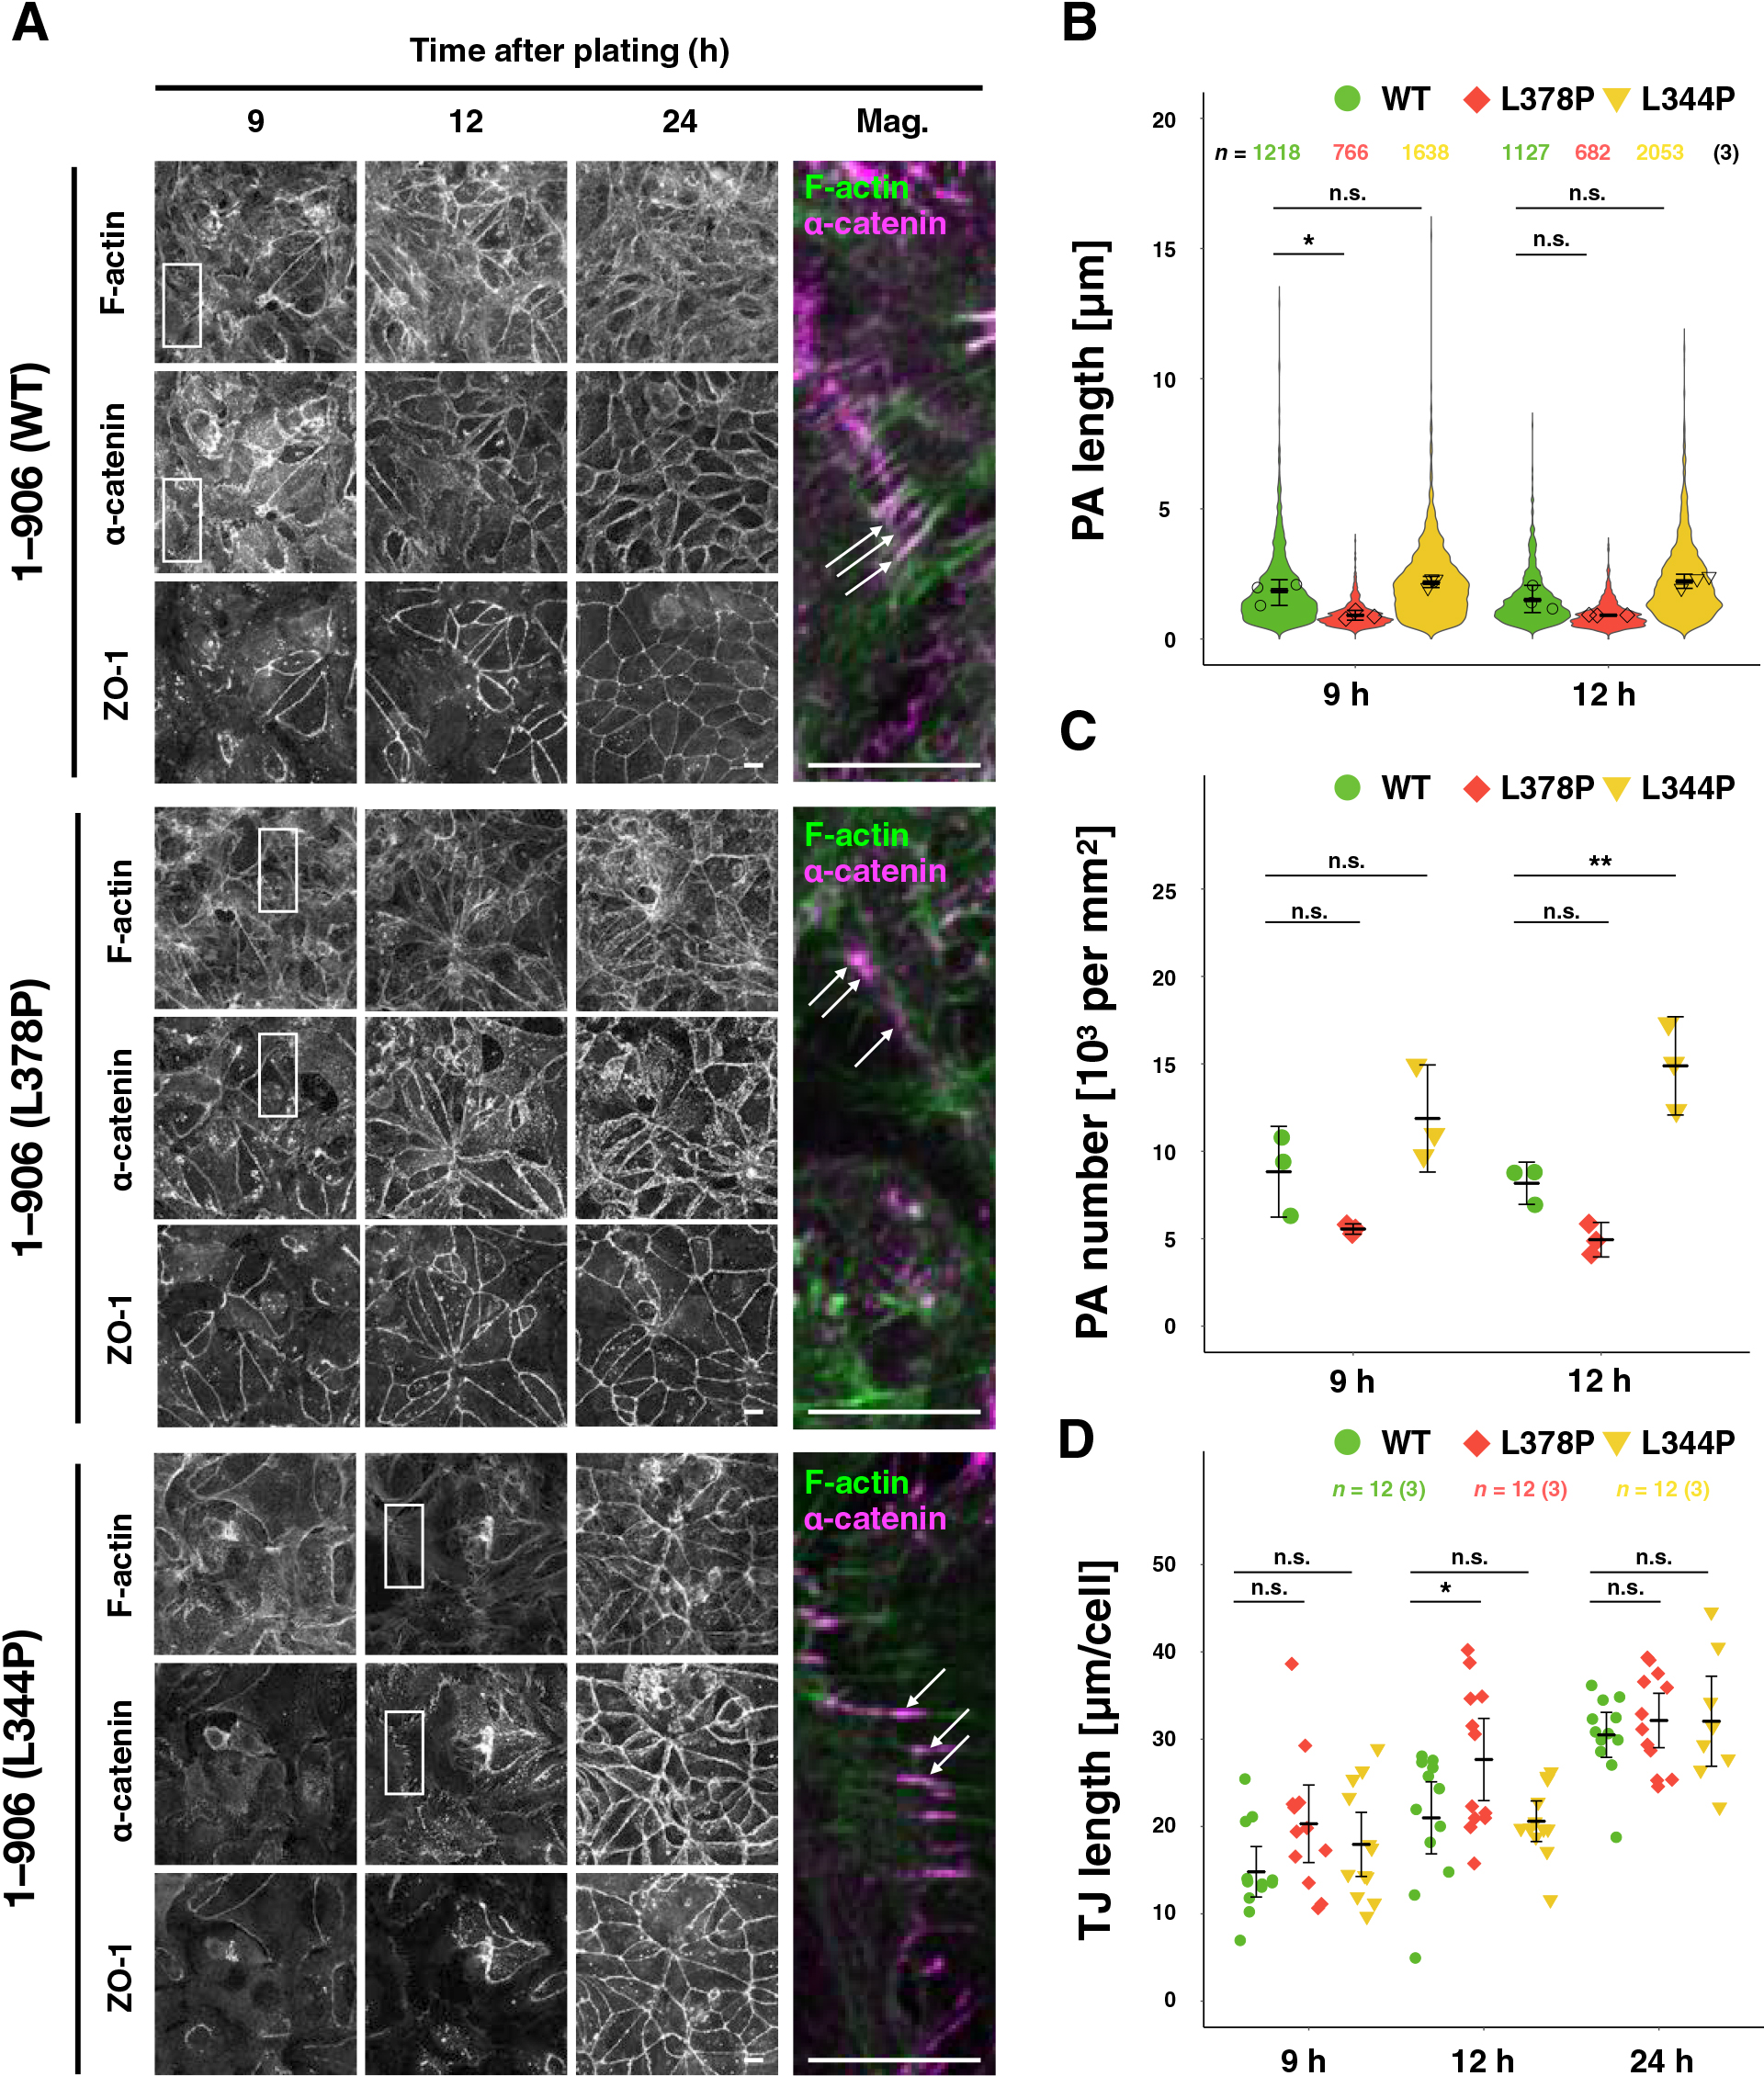
Since a protein molecule α-catenin is an important constituent of the protein complex, AJ, it was hypothesized that abnormal tension sensitivity might affect the process of AJ formation and suppress rounding. To obtain high-resolution images, cell-cell adhesion formation after seeding on coverslips was examined (Fig. 5). As previously observed (Yonemura et al., 1995), cells formed punctate AJs (punctum adherens; PAs) at the early stages after seeding (9–12 h), and then they were reorganized into linear adhesions (zonula adherens; ZAs) (Fig. 5A). The calcium switch experiment was also performed. Broken intercellular adhesions by removal of calcium from the culture medium were reformed by replenishing calcium (Fig. S6). Furthermore, the morphology of PAs stably found at the peripheries of small cell islands was compared (Fig. S7). In total, α-catenin (L344P)-expressing cells formed longer and more PAs, while the length and number of PAs were reduced in α-catenin (L378P)-expressing cells (Fig. 5A–C, Fig. S6A–C, and Fig. S7). The L378P mutation also caused TJs to form earlier (Fig. 5D and Fig. S6D). These results suggest that increased tension sensitivity of α-catenin promotes the maturation of cell-cell adhesion or causes ZA formation, skipping the PA formation process.
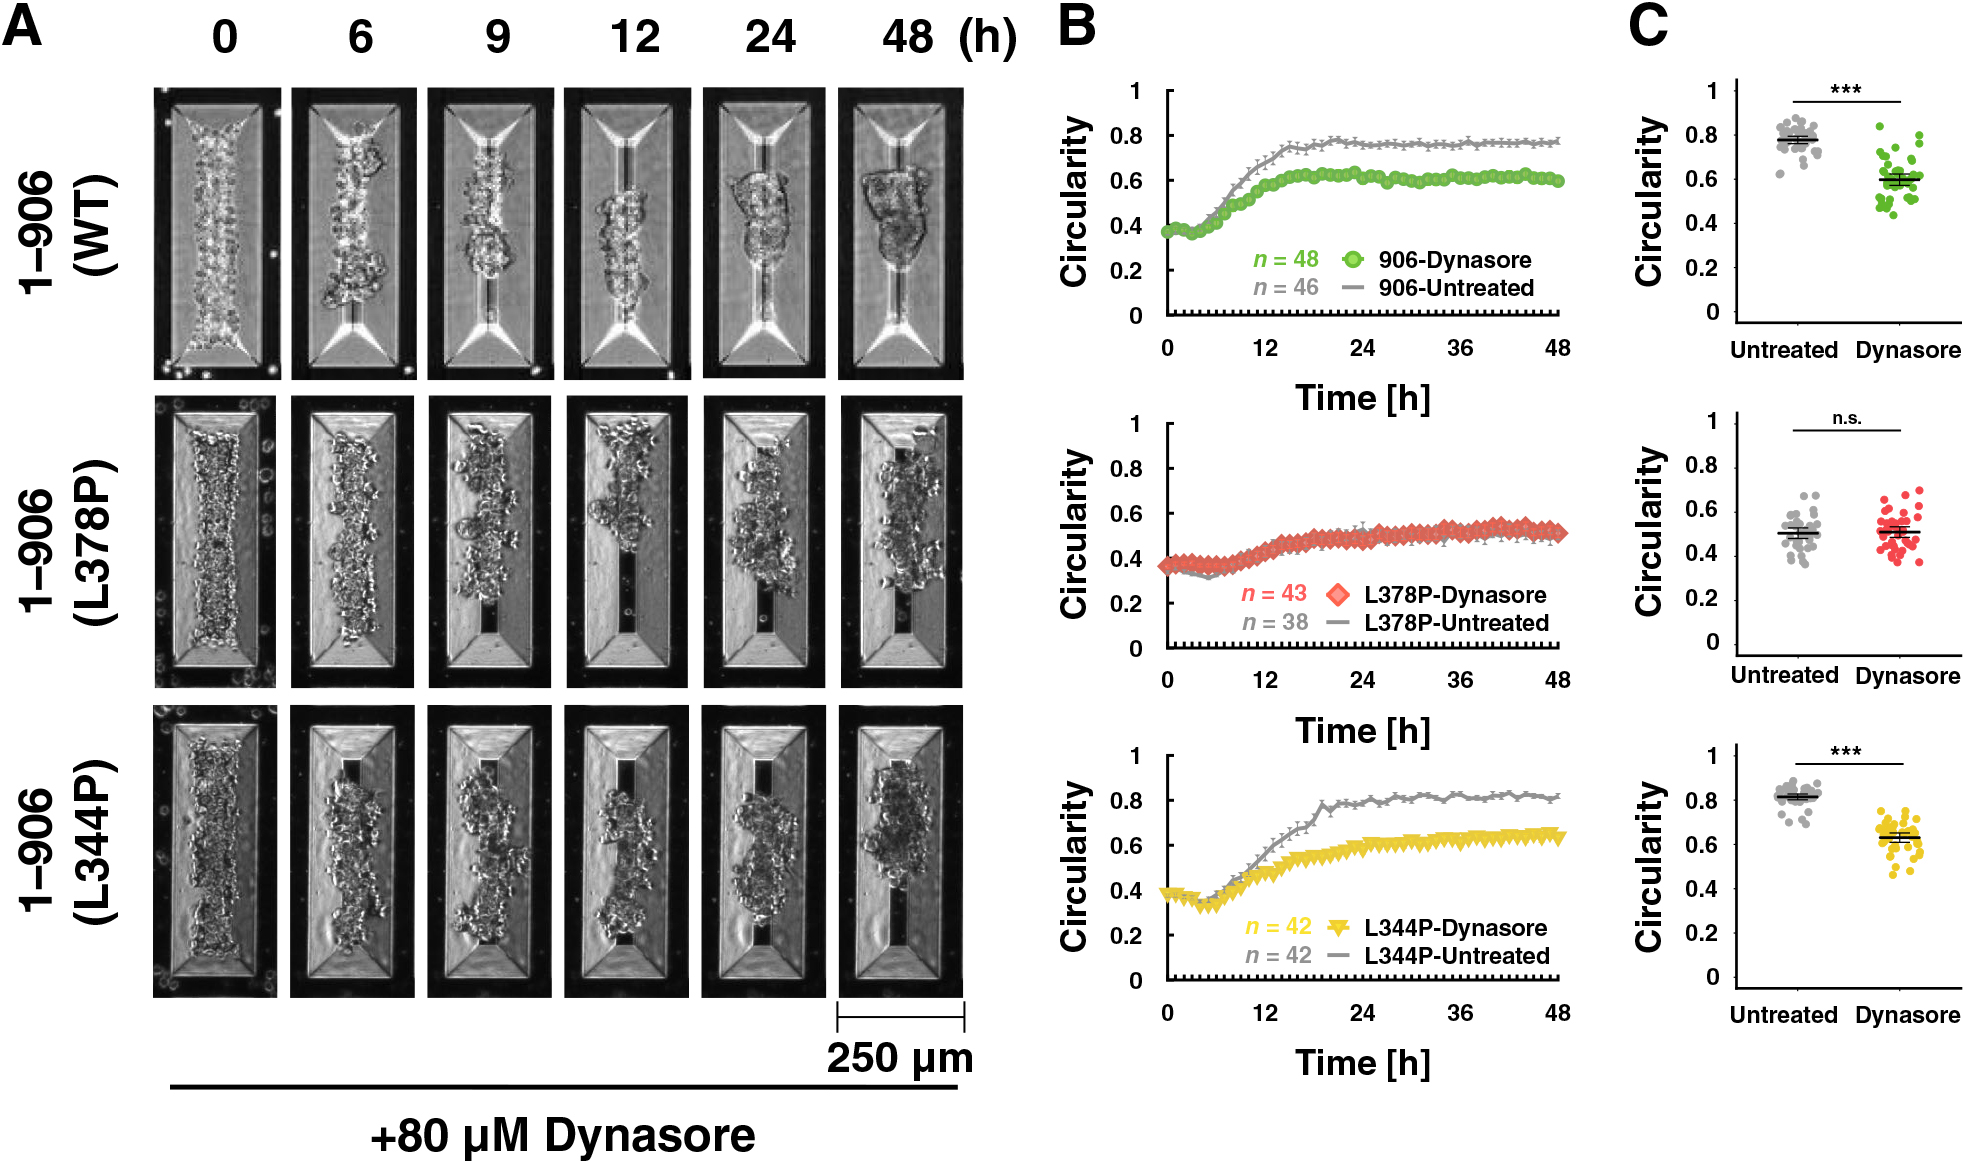
Components of cadherin-based cell-cell adhesions, including junctional actin, display a highly dynamic nature at the early stages of adhesion and then are stabilized during junctional development (Huang et al., 2011; Zhang et al., 2005). PAs are reported to be remodeled more dynamically than ZAs (Taguchi et al., 2011). Although there was no clear PA formation in 3D culture (Fig. S8), we speculated that immature AJs were formed during the spheroid formation. Decreased AJ plasticity impairs tissue rearrangements such as cell intercalation (Levayer et al., 2011). Based on these findings, we hypothesized that AJ plasticity is intimately involved in spheroid formation by facilitating multicellular rearrangement. AJ plasticity may be regulated by the internalization of its membrane proteins including E-cadherin, and dynamin GTPase mediates their endocytosis (de Beco et al., 2009; Iyer et al., 2019). Dynamin inhibition by Dynasore caused suppression of rounding for WT α-catenin-expressing cells (Fig. 6A–C – WT and Movie 9), supporting the idea that AJ plasticity is involved in the rounding. In contrast, dynamin treatment did not cause additive suppression on rounding of the L378P mutant-expressing cells (Fig. 6A–C – L378P and Movie 9). Because the C-terminal deletion α-catenin mutant (1–402) bound to vinculin tightly showed very low turnover (Yonemura et al., 2010), it is possible that hypersensitive mutants such as L378P bound to vinculin tightly interfere with internalization of the cadherin-catenin complex through dynamin to the same degree as dynamin inhibition probably due to increased interaction with actin cytoskeleton via vinculin. The L344P mutant lacks vinculin-binding ability. Rounding of this mutant-expressing cells was also inhibited by dynamin (Fig. 6A–C – L344P and Movie 9). These results suggest that the tension sensitivity of α-catenin, especially the vinculin-unbound state of α-catenin is important for AJ plasticity leading to rounding morphogenesis.
Then we hypothesized that α-catenin’s tension sensitivity and AJ plasticity are involved in neighbor exchange of cells, like cell intercalation, to drive the rounding of spheroids. Cell nuclei using GFP-tagged Histone 2B were visualized, and cell movements during the rising phase were analyzed (Fig. 7, Movie 10, and Movie 11). To obtain better Z-stack images by confocal microscopy, we utilized amorphous fluoropolymer CYTOP, which has a low refractive index near water, as a substrate of the microwells. By calculating the correlation coefficients (r) of the direction of displacement of each cell of a pair of neighboring cells in each frame, we can determine whether the two cells are moving in the same direction with a high positive correlation (0<r≤+1) or away from each other with high negative correlation (0>r≥–1) (Fig. 7A and Movie 10). The distribution of r over the entire period shows two peaks, one near 0 and the other near +1, indicating that the neighboring cells often move in a highly correlated or uncorrelated manner (Fig. 7B). Events in which cells pass by each other with negative r do not occur very often. Next, the changes in the distribution of r over time were visualized in a 2D density plot with time as the horizontal axis (Fig. 7C). In the two conditions in which rounding proceeded normally (WT and L344P), the proportion of highly correlated movements tended to increase during the first half of the rising phase (6–12 h, especially up to 9 h; Fig. 7C). The distribution of r was almost the same in L378P mutant α-catenin-expressing cells that cannot form round spheroids (Fig. 7B). Furthermore, the inhibition of dynamin had almost no effect on these cell movements (Fig. 7B). We note that we used MiTMAB instead of Dynasore to inhibit dynamin because Dynasore was turned out to show phototoxic effects during fluorescent imaging. Under these conditions, there was little change in the distribution over time (Fig. 7C). There was no difference in the percentage of highly correlated movements even when the range was limited to 6–9 h (Fig. 7D, E). These results indicate that this rounding process cannot be explained mainly by local exchanges of neighboring cell positions, detected as movements with negative r. Thus, the hypothesis is denied.

To search for other features to focus on, we attempted to simultaneously observe cell movement from the overturned plane using the stacked image data obtained in previous experiments (Fig. 7F, Fig. S9, and Movie 11). As a result, it was observed that in WT α-catenin-expressing cells, long cell aggregates at the initial state repeatedly bent from both ends or at the center and gradually became round (Fig. 7F – WT, Fig. S9A, and Movie 11). Those cell aggregates appear to be constituted of several parts. One part comprises a small number of cells adhering to each other. Those parts move as a group of cells like swing arms, using the region between two parts as a supporting point. When the parts come into contact with each other by bending, they fuse to form a single component. This event is seen as a jump in circularity during the rising phase (Fig. S9). Whenever this fusion happens, AJ remodeling is required; some of the existing AJs should be broken, and new ones should be formed (Fig. S10). The same behavior was observed in cells expressing the L344P mutant (Fig. 7F – L344P and Movie 11). Similar bending motions were observed in cells expressing the L378P mutation and WT cells treated to suppress membrane uptake (Fig. 7F – L378P, Fig. 7F – WT+MiTMAB, and Movie 11). In both cases, cells could not hold the bent state and returned to their original elongated shape after a while (Fig. 7F – L378P, Fig. 7F – WT+MiTMAB, and Movie 11). These results made us imagine that AJ’s low plasticity would suppress such fusion between parts.
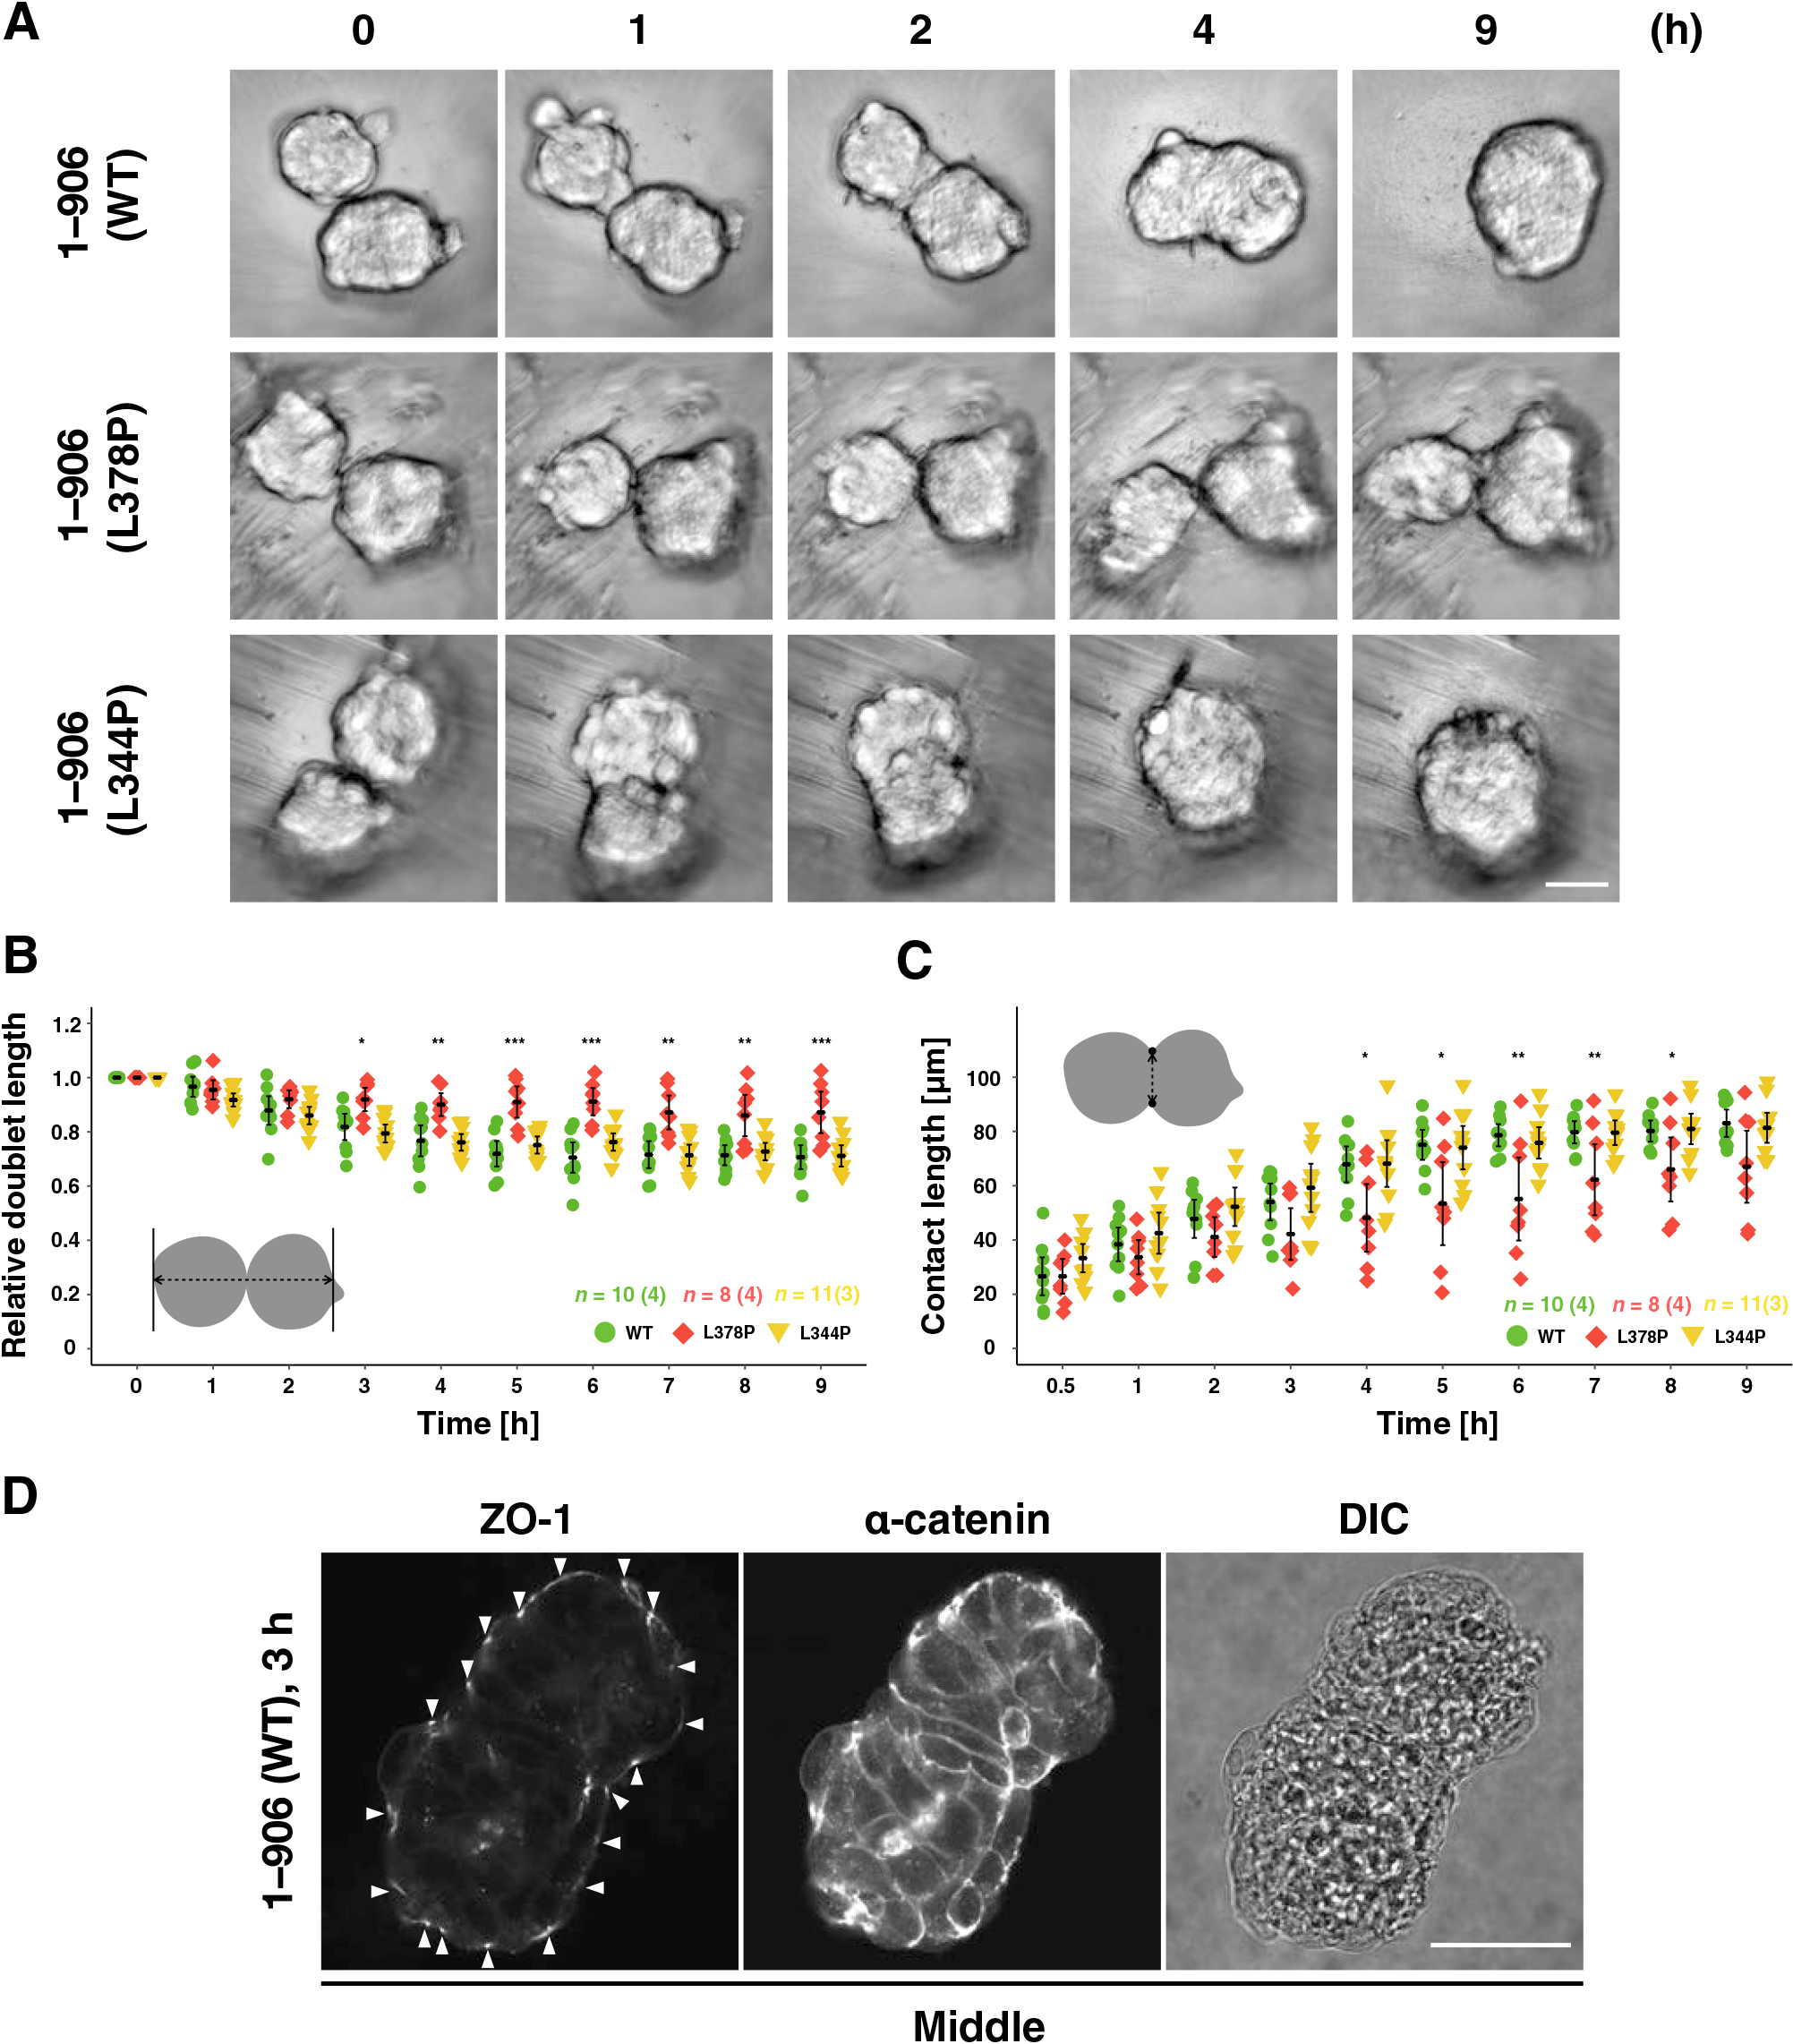
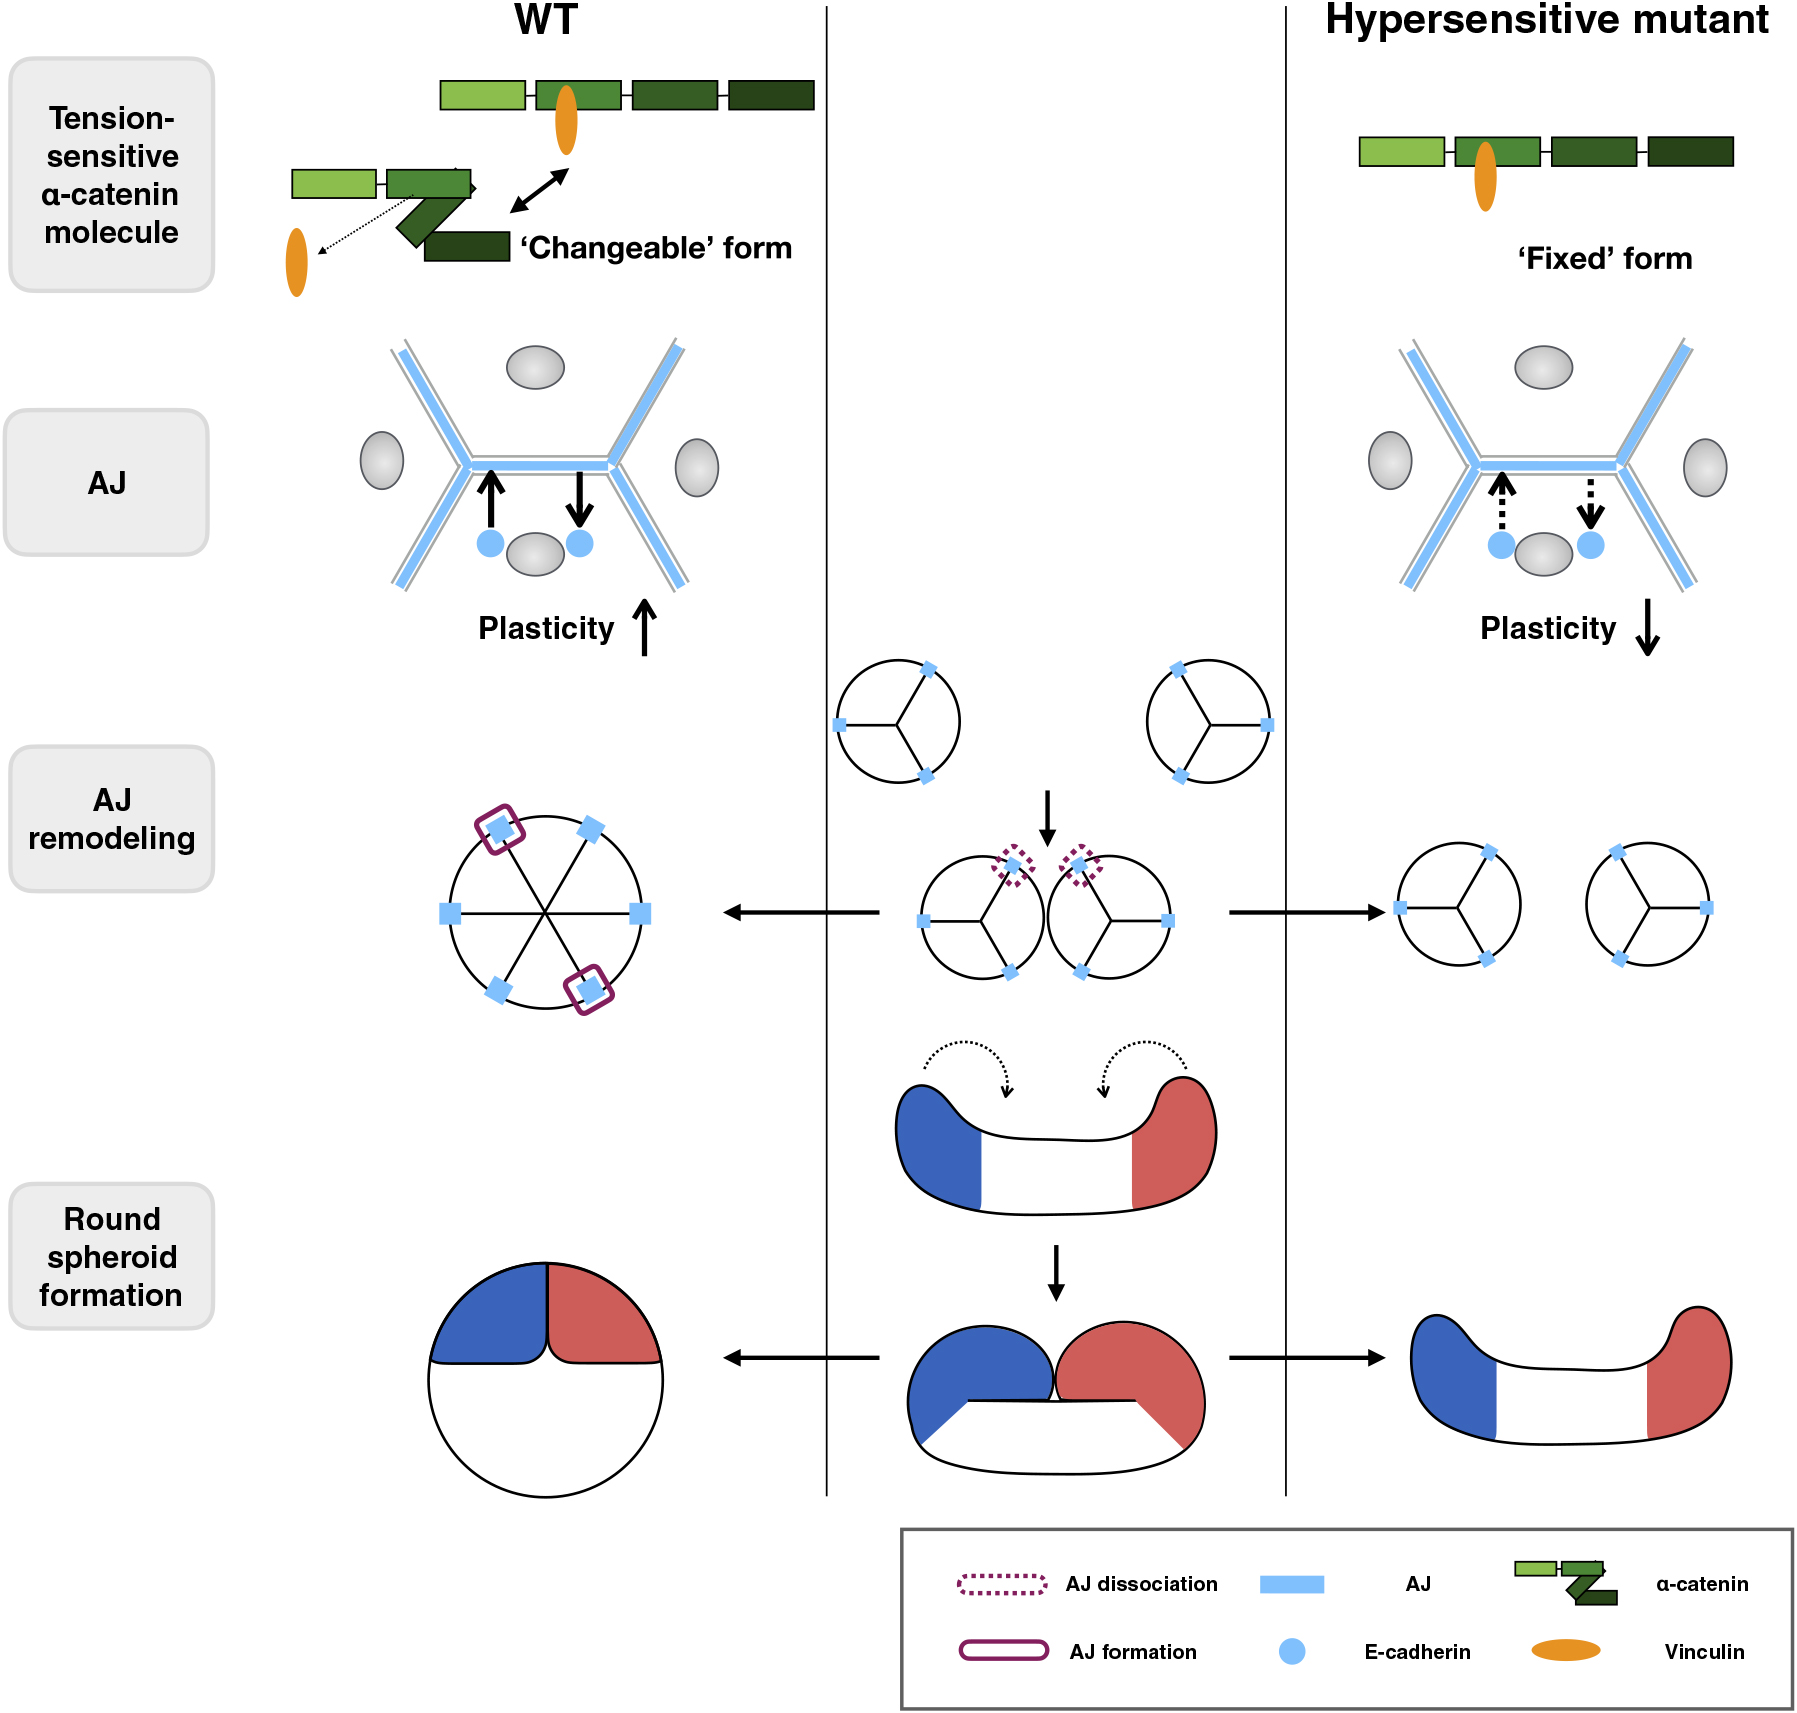
To test this, we performed fusion experiments of preformed spheroids (Fig. 8, Fig. S10, and Movie 12). In the pair of WT or L344P mutant α-catenin-expressing spheroids, the contact area between them expanded within a few hours after initial contact, forming a single round spheroid (Fig. 8A and Movie 12). In contrast, spheroids expressing the L378P mutation did not develop a clear contact area even after 9 h (Fig. 8A and Movie 12). The L378P mutation suppressed the expansion of the contact area and kept the distance between two spheroids long, whereas the WT and L344P mutants expanded the contact area and shortened the distance between the two spheroids (Fig. 8B, C). Although we could not obtain immunofluorescent images of fusing spheroids with a small contact area due to technical problems, we could observe junctions after the contact area was expanded (3 h after contact). Preexisted TJs at the interface of two spheroids were dissociated and a TJ network was formed at the entire apical surface of fused spheroids, showing that junction remodeling occurs during spheroid fusion (Fig. 8D). Taken together, the appropriate tension sensitivity of α-catenin contributes to the fusion between spheroids, leading to spheroid rounding probably through the AJ remodeling (Fig. 9).
Discussion
Spheroid formation experiments have been widely performed in biological and medical research (Cavo et al., 2020; Raghavan et al., 2016; Yonemura, 2014). In this study, we established a novel suspension culture model with V-bottomed microwells. Many studies characterized the spheroid formation process using morphology factors such as diameter and circularity (Cavo et al., 2020; Deckers et al., 2018; Kelm et al., 2003; Raghavan et al., 2016; Smeets et al., 2020). The technical advantage of our culture model is that we can precisely define the initial shape with various aspect ratios. Combining the model with image-based quantitative analyses allowed us to define distinct spheroid formation stages and analyze the rounding process at the molecular level.
The minimum requirements for rounding are as follows: 1) the cells adhere to each other with the same strength, 2) they can change their relative spatial positions. A typical example of cellular rearrangements is germ-band extension in the Drosophila embryo, where local neighbor exchange of cells is vital (Levayer et al., 2011). In addition, the tissue’s surface tension caused by the cortical tension of individual cells has also been proposed to drive spheroid rounding (Lecuit and Lenne, 2007; Winklbauer, 2015). In this study, physiological tension derived from myosin II was not required for the rounding. Although we do not rule out the possibility of force generation by other myosin family members like myosin-1c (Kannan and Tang, 2018), which is Blebbistatin-resistant, these contributions seem to be low because tension-dependent vinculin recruitment to AJs was not found (Fig. 4). Rather, vinculin release from α-catenin in response to low tension was indispensable. Cell motility necessary for the rounding of spheroids in our system is likely to be based on actin dynamics (Fig. S5).
The suppression of PA formation in the hypersensitive mutant in 2D culture (Fig. 5 and Fig. S6) suggested less AJ plasticity in the mutant because PA is remodeled more dynamic than ZA (Taguchi et al., 2011). Although we assumed first that the low junctional plasticity is shown as decreased neighbor exchanges in cells during spheroid formation, almost no change was detected. This result raises the possibility that cell-cell junctions other than AJs, such as stable desmosomes (Rübsam et al., 2018) suppress cell relocation. Unlike cell-cell intercalation, cells move collectively as gradual folding of a long cell mass, and they fuse to form a round spheroid (Fig. 7 and Movie 11). The hypersensitive mutation unexpectedly interferes with fusion after the folding rather than local cell relocation. The folding should be accompanied by the deformation of a few cells at the hinge region connecting two cell masses. This folding movement can be explained if this is based on actin dynamics consistent with our results. Completing neural tube closure requires the fusion of new contact regions (Nikolopoulou et al., 2017) similarly to our results. The failure of spheroid fusion in the hypersensitive mutant (Fig. 8) further supports the importance of the tension sensitivity of α-catenin for multicellular rearrangement at the cell mass level.
The physiological significance of the tension sensitivity of α-catenin has been reported in the context of the collective migration of epithelial cells. Seddiki et al. reported that in MDCK cells, the hypersensitive mutant grown under confinement to patterned areas showed the same cooperativeness of migration as the WT, although the L344P mutant lacking vinculin-binding decreased the cooperativeness (Seddiki et al., 2018). Meanwhile, Matsuzawa et al. reported that M319G/R326E double mutations, which increase the tension sensitivity, decrease the cooperativeness of collective cell migration toward a cell-free area in MDCK cells (Matsuzawa et al., 2018). Interpretations of these two reports apparently contradict each other. While Seddiki et al. compared distances that cells migrate collectively, Matsuzawa et al. focused on the directional coordination of the cell migration to a cell-free area. In the latter case, the cell migration with the direction which is not aligned toward the cell-free area is considered as an ‘uncoordinated’ migration, even if groups of cells migrated collectively. Thus, comparable cell behavior can be interpreted differently by the different criteria. They also contradict our results that cooperativeness of cell movement was almost the same in WT and mutants. One of the important differences is that cells in our 3D culture system do not form obvious focal adhesions found in conventional 2D culture on a stiff substratum. Probably cells move based on amoeboid motility using actin polymerization in our system. Although we tried to eliminate the effects from the cell anchorage to the stiff substratum, focusing on the effects of cell-cell adhesion as already described, the involvement of traction force through cell-substrate adhesion in the tension applied to the cell-cell interface is also important (Maruthamuthu et al., 2011). The degree of its involvement would vary at specific morphogenetic sites of the body depending on the stiffness or constituents of the extracellular matrix. Another difference is that they used established epithelial cell sheets with junctions, whereas, in our 3D culture system, cells are in the process of junction formation. Therefore, a simple comparison of our data and those obtained in a 2D culture system is difficult. Nevertheless, our results highlighted the importance of the tension sensitivity of α-catenin on the AJ remodeling found in spheroid fusion.
Morphogenesis through apical constriction requires strong AJs for force transmission. By contraries, morphogenesis through cell rearrangements requires fast AJ remodeling. Α-Catenin reduces AJ plasticity to ensure the force transmission through binding to vinculin (le Duc et al., 2010; Miyake et al., 2006; Yonemura et al., 2010) under strong tension (>5 pN, corresponding to the force generated by a myosin II molecule) (Maki et al., 2016; Yao et al., 2014) and increases plasticity to allow remodeling through releasing vinculin when the tension is weakened. Considering the results in this study, α-catenin can be regarded as an essential regulator for both types of morphogenesis. Tension sensitivity should be essential for successful switching between these two functions. Furthermore, the tension range for the switching is also important. If α-catenin is bound to vinculin under lower tension, smooth remodeling of AJs would not be possible. Thus, the α-catenin molecule is cleverly designed to respond to the physiological range of tension. Since the direct actin-binding of α-catenin itself is also tension-sensitive, it is necessary to further investigate the relationship between this and the actual adhesion to substrates in vivo. For the rapid remodeling of AJs, we consider that the loose association of actin filaments and α-catenin not only at the AJ but also along the lateral membrane is important because the turnover rate of α-catenin at the lateral membrane is much higher than that at AJs, and slowed down severely by a hypersensitive mutation (1–402) (Yonemura et al., 2010). In addition, most of the cadherin-catenin complex including α-catenin distributes along the lateral membrane, serving as a large pool for the AJ remodeling. Hypersensitive mutant α-catenin distributes also mainly along the lateral membrane with tightly bound vinculin, which is likely to decrease the supply of the cadherin-catenin complex from the lateral membrane for AJ formation.
Clonal epithelial cells form round spheroids with high probability in vitro, and round embryos are formed from eggs with high precision during development. Tension sensitivity of α-catenin appears to support designed morphogenesis protecting from stochastic fluctuations, which can lead to morphogenetic defects. Another aspect of the importance is the dual roles switched by tension applied to AJs. Binding to vinculin is important for maintaining rigid junctions, which transmit force to cause large deformation of cells. On the other hand, releasing vinculin promotes junctional remodeling while maintaining adhesion among cells. α-Catenin plays a central role in both morphogenetic situations.
Author contributions
R.N. and S.Y. conceptualization; R.N. and K.K. data curation; R.N. and K.K. formal analysis; R.N. and S.Y. funding acquisition; R.N., M.S., Y.A., and S.Y. investigation; R.N., K.K., M.S., Y.K., and S.Y. methodology; S.Y. project administration; Y.K., M.T., H.M., and Y.Y. resources; K.K. software; S.Y. supervision; R.N. and S.Y. validation; R.N. and K.K. visualization; R.N. writing-original draft; S.Y. writing-review and editing.
Conflict of Interest
The authors declare that they have no conflicts of interest with the contents of this article.
Acknowledgments
We thank Dr. M. Takeichi (RIKEN) for cells and plasmids, Dr. F. Van Roy (Ghent University) for cells, Dr. Sa. Tsukita (Osaka University) for antibodies, and Dr. Y. Hanada (Hirosaki University) for reagents. We thank Drs. K. Horikawa, Y. Hara (Tokushima University), Drs. J. Sakamoto and T. Tomoi (National Institute for Basic Biology) for technical support, K. Aki (Tokushima University) for technical assistance. We also thank Dr. S. Okuda (Kanazawa University) for the helpful discussion, Drs. Y. Higuchi (Hirosaki University) and K. Nakagawa (Tokushima University) for helpful comments and encouragement, and all laboratory members for insightful discussion. This work was also supported by the Support Center for Advanced Medical Sciences, Tokushima University Graduate School of Biomedical Sciences.
This work was supported by JSPS KAKENHI (Grant numbers 26650071, 15KT0086, and 18H02617 to S.Y. and 18J22029 to R.N.), Core Research for Evolutional Science and Technology from the Japan Science and Technology Agency (CREST JST; JP115811 to S.Y.), JST Moonshot R&D (Grant number JPMJMS2022 to S.Y.), JST SPRING (Grant number JPMJSP2113 to R.N.), and NIBB Collaborative Research Program (20-518 and 21-422 to K.K. and S.Y.).
References
- Abe, K., Chisaka, O., van Roy, F., and Takeichi, M. 2004. Stability of dendritic spines and synaptic contacts is controlled by αN-catenin. Nat. Neurosci., 7: 357–363.
- Basson, M.A. 2012. Signaling in Cell Differentiation and Morphogenesis. Cold Spring Harb. Perspect. Biol., 4: a008151.
- Carpenter, A.E., Jones, T.R., Lamprecht, M.R., Clarke, C., Kang, I.H., Friman, O., Guertin, D.A., Chang, J.H., Lindquist, R.A., Moffat, J., Golland, P., and Sabatini, D.M. 2006. CellProfiler: image analysis software for identifying and quantifying cell phenotypes. Genome Biol., 7: R100.
- Cavo, M., Cave, D.D., D’Amone, E., Gigli, G., Lonardo, E., and Mercato, del L.L. 2020. A synergic approach to enhance long-term culture and manipulation of MiaPaCa-2 pancreatic cancer spheroids. Sci. Rep., 10: 10192.
- de Beco, S., Gueudry, C., Amblard, F., and Coscoy, S. 2009. Endocytosis is required for E-cadherin redistribution at mature adherens junctions. Proc. Natl. Acad. Sci. USA, 106: 7010–7015.
- Deckers, T., Lambrechts, T., Viazzi, S., Hall, G.N., Papantoniou, I., Bloemen, V., and Aerts, J.-M. 2018. High-throughput image-based monitoring of cell aggregation and microspheroid formation. Plos One, 13: e0199092.
- Desai, R., Sarpal, R., Ishiyama, N., Pellikka, M., Ikura, M., and Tepass, U. 2013. Monomeric α-catenin links cadherin to the actin cytoskeleton. Nat. Cell Biol., 15: 261–273.
- Glazier, J.A. and Graner, F. 1993. Simulation of the differential adhesion driven rearrangement of biological cells. Phys. Rev. E, 47: 2128–2154.
- Godard, B.G. and Heisenberg, C.-P. 2019. Cell division and tissue mechanics. Curr. Opin. Cell Biol., 60: 114–120.
- Han, M.K.L., Hoijman, E., Nöel, E., Garric, L., Bakkers, J., and de Rooij, J. 2016. αE-catenin-dependent mechanotransduction is essential for proper convergent extension in zebrafish. Biol. Open, 5: 1461–1472.
- Harris, A.K. 1976. Is cell sorting caused by differences in the work of intercellular adhesion? A critique of the steinberg hypothesis. J. Theor. Biol., 61: 267–285.
- Herbst, C. 1900. über das Auseinandergehen von Furchungs- und Gewebezellen in kalkfreiem Medium. Wilhelm Roux’ Arch. Entwickl mech. Org., 9: 424–463.
- Hirano, S., Kimoto, N., Shimoyama, Y., Hirohashi, S., and Takeichi, M. 1992. Identification of a neural α-catenin as a key regulator of cadherin function and multicellular organization. Cell, 70: 293–301.
- Hirano, Y., Amano, Y., Yonemura, S., and Hakoshima, T. 2018. The force-sensing device region of α-catenin is an intrinsically disordered segment in the absence of intramolecular stabilization of the autoinhibitory form. Genes Cells, 23: 370–385.
- Hirashima, T., Rens, E.G., and Merks, R.M.H. 2017. Cellular Potts modeling of complex multicellular behaviors in tissue morphogenesis. Dev. Growth Differ., 59: 329–339.
- Honda, H. 2017. The world of epithelial sheets. Dev. Growth Differ., 59: 306–316.
- Honda, H. and Nagai, T. 2014. Cell models lead to understanding of multi-cellular morphogenesis consisting of successive self-construction of cells. J. Biochem., 157: 129–136.
- Huang, J., Huang, L., Chen, Y.-J., Austin, E., Devor, C.E., Roegiers, F., and Hong, Y. 2011. Differential regulation of adherens junction dynamics during apical–basal polarization. J. Cell Sci., 124: 4001–4013.
- Ishihara, S., Marcq, P., and Sugimura, K. 2017. From cells to tissue: A continuum model of epithelial mechanics. Phys. Rev. E, 96: 022418.
- Ishiyama, N., Sarpal, R., Wood, M.N., Barrick, S.K., Nishikawa, T., Hayashi, H., Kobb, A.B., Flozak, A.S., Yemelyanov, A., Fernandez-Gonzalez, R., Yonemura, S., Leckband, D.E., Gottardi, C.J., Tepass, U., and Ikura, M. 2018. Force-dependent allostery of the α-catenin actin-binding domain controls adherens junction dynamics and functions. Nat. Commun., 9: 5121.
- Itoh, M., Nagafuchi, A., Moroi, S., and Tsukita, S. 1997. Involvement of ZO-1 in Cadherin-based Cell Adhesion through Its Direct Binding to α Catenin and Actin Filaments. J. Cell Biol., 138: 181–192.
- Iyer, K.V., Piscitello-Gómez, R., Paijmans, J., Jülicher, F., and Eaton, S. 2019. Epithelial Viscoelasticity Is Regulated by Mechanosensitive E-cadherin Turnover. Curr. Biol., 29: 578–591.
- Kannan, N. and Tang, V.W. 2018. Myosin-1c promotes E-cadherin tension and force-dependent recruitment of α-actinin to the epithelial cell junction. J. Cell Sci., 131: jcs211334.
- Kelm, J.M., Timmins, N.E., Brown, C.J., Fussenegger, M., and Nielsen, L.K. 2003. Method for generation of homogeneous multicellular tumor spheroids applicable to a wide variety of cell types. Biotechnol. Bioeng., 83: 173–180.
- le Duc, Q., Shi, Q., Blonk, I., Sonnenberg, A., Wang, N., Leckband, D., and de Rooij, J. 2010. Vinculin potentiates E-cadherin mechanosensing and is recruited to actin-anchored sites within adherens junctions in a myosin II–dependent manner. J. Cell Biol., 189: 1107–1115.
- Lecuit, T. and Lenne, P.-F. 2007. Cell surface mechanics and the control of cell shape, tissue patterns and morphogenesis. Nat. Rev. Mol. Cell Biol., 8: 633–644.
- Lecuit, T. and Yap, A.S. 2015. E-cadherin junctions as active mechanical integrators in tissue dynamics. Nat. Cell Biol., 17: 533–539.
- Levayer, R., Pelissier-Monier, A., and Lecuit, T. 2011. Spatial regulation of Dia and Myosin-II by RhoGEF2 controls initiation of E-cadherin endocytosis during epithelial morphogenesis. Nat. Cell Biol., 13: 529–540.
- Li, J., Newhall, J., Ishiyama, N., Gottardi, C., Ikura, M., Leckband, D.E., and Tajkhorshid, E. 2015. Structural Determinants of the Mechanical Stability of α-Catenin. J. Biol. Chem., 290: 18890–18903.
- Maki, K., Han, S.-W., Hirano, Y., Yonemura, S., Hakoshima, T., and Adachi, T. 2016. Mechano-adaptive sensory mechanism of α-catenin under tension. Sci. Rep., 6: 24878.
- Maki, K., Han, S.-W., Hirano, Y., Yonemura, S., Hakoshima, T., and Adachi, T. 2018. Real-time TIRF observation of vinculin recruitment to stretched α-catenin by AFM. Sci. Rep., 8: 1575.
- Martin, A.C. and Goldstein, B. 2014. Apical constriction: themes and variations on a cellular mechanism driving morphogenesis. Development, 141: 1987–1998.
- Maruthamuthu, V., Sabass, B., Schwarz, U.S., and Gardel, M.L. 2011. Cell-ECM traction force modulates endogenous tension at cell–cell contacts. Proc. Natl. Acad. Sci. USA, 108: 4708–4713.
- Matsuzawa, K., Himoto, T., Mochizuki, Y., and Ikenouchi, J. 2018. α-Catenin Controls the Anisotropy of Force Distribution at Cell-Cell Junctions during Collective Cell Migration. Cell Rep., 23: 3447–3456.
- Miyake, Y., Inoue, N., Nishimura, K., Kinoshita, N., Hosoya, H., and Yonemura, S. 2006. Actomyosin tension is required for correct recruitment of adherens junction components and zonula occludens formation. Exp. Cell Res., 312: 1637–1650.
- Narayanan, V., Schappell, L.E., Mayer, C.R., Duke, A.A., Armiger, T.J., Arsenovic, P.T., Mohan, A., Dahl, K.N., Gleghorn, J.P., and Conway, D.E. 2020. Osmotic Gradients in Epithelial Acini Increase Mechanical Tension across E-cadherin, Drive Morphogenesis, and Maintain Homeostasis. Curr. Biol., 30: 624–633.
- Nikolopoulou, E., Galea, G.L., Rolo, A., Greene, N.D.E., and Copp, A.J. 2017. Neural tube closure: cellular, molecular and biomechanical mechanisms. Development, 144: 552–566.
- Okuda, S., Inoue, Y., and Adachi, T. 2015. Three-dimensional vertex model for simulating multicellular morphogenesis. Biophys. Physicobiol., 12: 13–20.
- Paluch, E. and Heisenberg, C.-P. 2009. Biology and Physics of Cell Shape Changes in Development. Curr. Biol., 19: 790–799.
- Peng, X., Maiers, J.L., Choudhury, D., Craig, S.W., and DeMali, K.A. 2012. α-Catenin Uses a Novel Mechanism to Activate Vinculin. J. Biol. Chem., 287: 7728–7737.
- Pinheiro, D. and Bellaïche, Y. 2018. Mechanical Force-Driven Adherens Junction Remodeling and Epithelial Dynamics. Dev. Cell, 47: 3–19.
- Pokutta, S. and Weis, W.I. 2007. Structure and Mechanism of Cadherins and Catenins in Cell-Cell Contacts. Cell Dev. Biol., 23: 237–261.
- Porazinski, S., Wang, H., Asaoka, Y., Behrndt, M., Miyamoto, T., Morita, H., Hata, S., Sasaki, T., Krens, S.F.G., Osada, Y., Asaka, S., Momoi, A., Linton, S., Miesfeld, J.B., Link, B.A., Senga, T., Castillo-Morales, A., Urrutia, A.O., Shimizu, N., et al. 2015. YAP is essential for tissue tension to ensure vertebrate 3D body shape. Nature, 521: 217–221.
- Quintin, S., Gally, C., and Labouesse, M. 2008. Epithelial morphogenesis in embryos: asymmetries, motors and brakes. Trends. Genet., 24: 221–230.
- Raghavan, S., Mehta, P., Horst, E.N., Ward, M.R., Rowley, K.R., and Mehta, G. 2016. Comparative analysis of tumor spheroid generation techniques for differential in vitro drug toxicity. Oncotarget, 7: 16948–16961.
- Rangarajan, E.S. and Izard, T. 2013. Dimer asymmetry defines α-catenin interactions. Nat. Struct. Mol. Biol., 20: 188–193.
- Rübsam, M., Broussard, J.A., Wickström, S.A., Nekrasova, O., Green, K.J., and Niessen, C.M. 2018. Adherens Junctions and Desmosomes Coordinate Mechanics and Signaling to Orchestrate Tissue Morphogenesis and Function: An Evolutionary Perspective. Cold Spring Harb. Perspect. Biol., 10: a029207.
- Sabine, A., Agalarov, Y., Maby-El Hajjami, H., Jaquet, M., Hägerling, R., Pollmann, C., Bebber, D., Pfenniger, A., Miura, N., Dormond, O., Calmes, J.-M., Adams, R.H., Mäkinen, T., Kiefer, F., Kwak, B.R., and Petrova, T.V. 2012. Mechanotransduction, PROX1, and FOXC2 Cooperate to Control Connexin37 and Calcineurin during Lymphatic-Valve Formation. Dev. Cell, 22: 430–445.
- Sakakibara, S., Mizutani, K., Sugiura, A., Sakane, A., Sasaki, T., Yonemura, S., and Takai, Y. 2020. Afadin regulates actomyosin organization through αE-catenin at adherens junctions. J. Cell Biol., 219: e201907079.
- Scarpa, E. and Mayor, R. 2016. Collective cell migration in development. J. Cell Biol., 212: 143–155.
- Seddiki, R., Narayana, G.H.N.S., Strale, P.-O., Balcioglu, H.E., Peyret, G., Yao, M., Le, A.P., Teck, L.C., Yan, J., Ladoux, B., and Mège, R.M. 2018. Force-dependent binding of vinculin to α-catenin regulates cell-cell contacts stability and collective cell behavior. Mol. Biol Cell., 29: mbc.E17-04-0231.
- Smeets, B., Pešek, J., Deckers, T., Hall, G.N., Cuvelier, M., Ongenae, S., Bloemen, V., Luyten, F.P., Papantoniou, I., and Ramon, H. 2020. Compaction Dynamics during Progenitor Cell Self-Assembly Reveal Granular Mechanics. Matter, 2: 1283–1295.
- Steinberg, M.S. 1963. Reconstruction of Tissues by Dissociated Cells. Science, 141: 401–408.
- Tada, M. and Heisenberg, C.-P. 2012. Convergent extension: using collective cell migration and cell intercalation to shape embryos. Development, 139: 3897–3904.
- Taguchi, K., Ishiuchi, T., and Takeichi, M. 2011. Mechanosensitive EPLIN-dependent remodeling of adherens junctions regulates epithelial reshaping. J. Cell Biol., 194: 643–656.
- Takeichi, M. 1995. Morphogenetic roles of classic cadherins. Curr. Opin. Cell Biol., 7: 619–627.
- Takeichi, M. 2014. Dynamic contacts: rearranging adherens junctions to drive epithelial remodelling. Nat. Rev. Mol. Cell Biol., 15: 397–410.
- Torres, M., Stoykova, A., Huber, O., Chowdhury, K., Bonaldo, P., Mansouri, A., Butz, S., Kemler, R., and Gruss, P. 1997. An α-E-catenin gene trap mutation defines its function in preimplantation development. Proc. Natl. Acad. Sci. USA, 94: 901–906.
- van Hengel, J., Gohon, L., Bruyneel, E., Vermeulen, S., Cornelissen, M., Mareel, M., and van Roy, F. 1997. Protein Kinase C Activation Upregulates Intercellular Adhesion of α-Catenin–negative Human Colon Cancer Cell Variants via Induction of Desmosomes. J. Cell Biol., 137: 1103–1116.
- Vasioukhin, V., Bauer, C., Degenstein, L., Wise, B., and Fuchs, E. 2001. Hyperproliferation and Defects in Epithelial Polarity upon Conditional Ablation of α-Catenin in Skin. Cell, 104: 605–617.
- Vasquez, C.G. and Martin, A.C. 2016. Force transmission in epithelial tissues. Dev. Dyn., 245: 361–371.
- Voss, A.K. and Strasser, A. 2020. The essentials of developmental apoptosis [version 1; peer review: 3 approved]. F1000Research, 9: 148.
- Wang, J.-C., Liu, W., Tu, Q., Ma, C., Zhao, L., Wang, Y., Ouyang, J., Pang, L., and Wang, J. 2014. High throughput and multiplex localization of proteins and cells for in situ micropatterning using pneumatic microfluidics. Analyst, 140: 827–836.
- Wang, Y.-C. 2021. The origin and the mechanism of mechanical polarity during epithelial folding. Semin. Cell Dev. Biol., 120: 94–107.
- Watabe, M., Nagafuchi, A., Tsukita, S., and Takeichi, M. 1994. Induction of polarized cell-cell association and retardation of growth by activation of the E-cadherin-catenin adhesion system in a dispersed carcinoma line. J. Cell Biol., 127: 247–256.
- Watabe-Uchida, M., Uchida, N., Imamura, Y., Nagafuchi, A., Fujimoto, K., Uemura, T., Vermeulen, S., van Roy, F., Adamson, E.D., and Takeichi, M. 1998. α-Catenin-Vinculin Interaction Functions to Organize the Apical Junctional Complex in Epithelial Cells. J. Cell Biol., 142: 847–857.
- Watanabe, T., Hosoya, H., and Yonemura, S. 2007. Regulation of Myosin II Dynamics by Phosphorylation and Dephosphorylation of Its Light Chain in Epithelial Cells. Mol. Biol. Cell, 18: 605–616.
- Wilson, H.V. 1907. On some phenomena of coalescence and regeneration in sponges. J. Exp. Zool., 5: 245–258.
- Winklbauer, R. 2015. Cell adhesion strength from cortical tension—an integration of concepts. J. Cell Sci., 128: 3687–3693.
- Wu, Z. and Hjort, K. 2009. Surface modification of PDMS by gradient-induced migration of embedded Pluronic. Lab Chip, 9: 1500–1503.
- Yao, M., Qiu, W., Liu, R., Efremov, A.K., Cong, P., Seddiki, R., Payre, M., Lim, C.T., Ladoux, B., Mège, R.-M., and Yan, J. 2014. Force-dependent conformational switch of α-catenin controls vinculin binding. Nat. Commun., 5: 4525.
- Yonemura, S. 2014. Differential Sensitivity of Epithelial Cells to Extracellular Matrix in Polarity Establishment. Plos One, 9: e112922.
- Yonemura, S. 2017. Actin filament association at adherens junctions. J. Med. Invest., 64: 14–19.
- Yonemura, S., Itoh, M., Nagafuchi, A., and Tsukita, S. 1995. Cell-to-cell adherens junction formation and actin filament organization: similarities and differences between non-polarized fibroblasts and polarized epithelial cells. J. Cell Sci., 108: 127–142.
- Yonemura, S., Wada, Y., Watanabe, T., Nagafuchi, A., and Shibata, M. 2010. α-Catenin as a tension transducer that induces adherens junction development. Nat. Cell Biol., 12: 533–542.
- Zhang, J., Betson, M., Erasmus, J., Zeikos, K., Bailly, M., Cramer, L.P., and Braga, V.M.M. 2005. Actin at cell-cell junctions is composed of two dynamic and functional populations. J. Cell Sci., 118: 5549–5562.
Abbreviations
2Dtwo-dimensional
3Dthree-dimensional
AFMatomic force microscopy
AJadherens junction
CEconvergent extension
DAPI4',6-diamidino-2-phenylindole
DICdifferential interference contrast
DMEMDulbecco’s modified Eagle medium
ECMextracellular matrix
FBSfetal bovine serum
HRPhorse radish peroxidase
PApunctum adherens
PDMSpolydimethylsiloxane
TIRFtotal internal reflection fluorescence
TJtight junction
ZAzonula adherens
