Materials and Methods
Plasmids
To determine the ability to induce translational arrest, we constructed a series of arrest reporter plasmids, pcDNA3.1(+) GFP-X-RFP. In the constructs, tester sequences were inserted at position “X,” which was located between the enhanced green fluorescent protein (EGFP) and mCherry sequences (Fig. S1A). The exact sequences of the testers and linkers surrounding the testers are shown in Fig. S1B. Note that the C-terminus of mCherry was tagged with HA. The pcDNA3.1(+)_Fluc-ER plasmid has been described previously (Nakamura et al., 2011). To generate Fluc-ER[R30], 30 consecutive arginine (R30) residue-encoding sequences were inserted between the firefly luciferase- and KDEL (Lys-Asp-Glu-Leu; ER retention sequence)-encoding sequences in pcDNA3.1(+)_Fluc-ER using polymerase chain reaction (PCR) and DNA ligation. In the case of Fluc[R30], the SS was deleted from pcDNA3.1_Fluc-ER[R30] by PCR. The exact sequences of R30 and the surrounding sequences are shown in Fig. S2A. pcDNA3.1(+)_α-1-antitrypsin (A1AT) was generated by inserting human A1AT complementary DNA (cDNA) into pcDNA3.1(+). Then, A1AT[PrP] and A1AT[Lep] were generated by substituting the SS of A1AT (amino acids 1 to 24: MPSSVSWGILLLAGLCCLVPVSLA) with that of human prion (amino acids 1 to 22: MANLGCWMLVLFVATWSDLGLC) or human leptin (amino acids 1 to 21: MHWGTLCGFLWLWPYLFYVQA) by PCR and DNA ligation. To generate A1AT[R30], 30 consecutive arginine (R30) residue-encoding sequences were inserted just upstream of the termination codon of A1AT in pcDNA3.1(+)_A1AT using PCR and DNA ligation.
Antibodies
Anti-firefly luciferase (Abcam, Cambridge, UK; ab187340, 1:4000), anti-GAPDH (CST, Danvers, MA, USA; #2118, 1:1000), anti-calnexin (Stressgen, San Diego, CA, USA; SPA-860, 1:1000), anti-Sec61α (Sigma Aldrich, St. Louis, MO, USA; SAB2500917, 1:1000), anti-β-actin (CST, #4970, 1:1000), anti-FLAG M2 (Sigma Aldrich; F1804, 1:1000), anti-α-1-antitrypsin (DAKO, Glostrup, Denmark; A0012, 1:1000), anti-IRE1α (CST, #3294, 1:1000), anti-PERK (CST, #3192, 1:500), anti-CHOP (CST, #2895T, 1:500), anti-IgG (H+L chain) (Rabbit) pAb-horseradish peroxidase (HRP) (MBL, Tokyo, Japan; 458, 1:5000), peroxidase AffiniPure goat anti-mouse IgG (H+L) (Jackson Immuno Research Laboratories, West Grove, PA, USA; 115-035-003, 1:5000), anti-rabbit IgG, HRP-linked antibody (CST, 7074, 1:3000), and anti-mouse IgG, HRP-linked antibody (CST, 7076, 1:3000) were purchased. Anti-Sec61β (1:1000) was a kind gift from Dr Tom A. Rapoport (Harvard Medical School, Boston, MA, USA). Anti-ERP57 antibody (1:1000) was generated in our laboratory (Sopha et al., 2012).
In vitro transcription and translation
For in vitro transcription, pcDNA3.1(+)_GFP-X-RFP was amplified by PCR using the forward primer 5'-ATTTAGGTGACACTATAGAAGAGacccaagctggctagcg-3' (the uppercase letters indicate the SP6 promoter, and the lowercase letters indicate the sequence that hybridizes to pcDNA3.1(+)), and the reverse primer 5'-TTTTTTTTTTTTTTTTTTTTTTTTTTTTTTcacctactcagacaatgcgatgc-3' (the uppercase letters indicate the sequence for the poly A template, and the lowercase letters indicate the sequence that hybridizes to pcDNA3.1(+)). Thermal cycling conditions were as follows: denaturation at 98°C for 5 min, and 30 cycles with denaturation at 98°C for 10 s, and then annealing/elongation at 68°C for 3 min using SimpliAmpTM Thermal Cycler (Applied Biosystems/Life Technologies Japan, ThermoFisher Scientific K.K., Tokyo, Japan). The 5'-capped mRNAs were transcribed from the purified PCR products at 37°C for 2 h according to the manufacturer’s instructions for Riboprobe in vitro transcription systems (Promega, Madison, WI, USA). Note that we used SP6 polymerase (Promega) and Ribo m7G Cap analogue (Promega) for the transcription. The template DNA was removed using DNase I (TaKaRa, Kusatsu, Japan) at 37°C for 20 min. The synthesized mRNAs were purified using ISOGEN-LS (Nippon Gene, Tokyo, Japan).
The synthesized RNAs were translated at 30°C with an in vitro translation system using rabbit reticulocyte lysate (Promega). The synthesized proteins were labelled with 35S-labeled methionine and cysteine using the EasyTagTM EXPRE35S35S protein labelling mix (PerkinElmer, Waltham, MA, USA). To prevent proteasomal degradation of the synthesized proteins, the translational mixtures included 10 μM MG-132. Note that we added 8 μg/mL harringtonin (Santa Cruz Biotechnology, Dallas, TX, USA; sc-204771A) to the mixtures after 5 min of translation. The translation was stopped by freezing with liquid N2. The samples were then mixed with lysis buffer A comprising 0.35 M Bis-tris (pH 6.5), 2% sodium dodecyl sulfate (SDS), 10% glycerol, 20 μM MG-132, 1 mM phenylmethylsulfonyl fluoride (PMSF), 10 μg/mL pepstatin A, 1 mM benzamide, and 10 μg/mL leupeptin. For RNase A treatment, 400 μg/mL RNase A (Nacalai, Kyoto, Japan) was added to the lysis buffer, and the mixture was incubated for 30 min at 37°C. Then, a sample buffer comprising 0.35 M Bis-tris (pH 6.5), 2% SDS, and 10% glycerol were added. An RNA purification kit (Ambion, Austin, TX, USA) was added to 1/4 vol. of the cell lysates, and 100 mM dithiothreitol (DTT) was subsequently added. The processed samples were analyzed using 10% NuPAGETM gel (Invitrogen, Waltham, MA, USA) with a buffer comprising 50 mM 3-(N-morpholino) propanesulfonic acid (MOPS) (pH 7.7), 50 mM Tris base, 0.1% SDS, and 1 mM ethylenediaminetetraacetic acid (EDTA). The dried gels were placed in a lightproof case and an imaging plate (Fujifilm, Tokyo, Japan) was exposed to them for 3 days. The imaging plate was analyzed using a Fujifilm BAS-2500 system.
Cell culture
HEK293T cells (RIKEN BRC, Ibaraki, Japan) (approximately 5.0 × 10⁵ cells) were seeded in 6-well dishes coated with collagen (Cellmatrix Type I-C; Nitta Gelatin, Osaka, Japan) and cultured in Dulbecco’s modified Eagle’s medium (DMEM; Nacalai) supplemented with 10% fetal bovine serum (NICHIREI, Tokyo, Japan; Cat. No. 175012, Lot. No. 20C00F) at 37°C under 5% CO2. After 24 h, transfection was performed using polyethylenimine (PEI) Max (Polysciences, Warrington, PA, USA) with 1.25 μg of plasmid DNA. After a further 24 h, the cells were collected for analysis. For the harringtonin pulse-chase experiments, 1 μg/mL harringtonin was added to the HEK293T cells after 22 h of translation, and their lysates were recovered at the indicated times.
Immunoblotting
For NuPAGETM analysis, the cells were lysed on ice for 30 min in lysis buffer A, comprised of 0.35 M Bis-tris (pH 6.5), 2% SDS, 10% glycerol, 20 μM MG-132, 1 mM PMSF, 10 μg/mL pepstatin A, 1 mM benzamide, and 10 μg/mL leupeptin. Four aliquots of the sample buffer, comprised of 0.35 M Bis-tris (pH 6.5), 2% SDS, 10% glycerol, and RNA secure (Ambion), were added to 1/4 vol. of the cell lysates. This was followed by the addition of 100 mM DTT. The proteins were separated on an 8% or 10% NuPAGETM Bis-tris gel comprising 0.35 M Bis-tris (pH 6.5) with MOPS buffer. After electrophoresis, the proteins were transferred onto a polyvinylidene difluoride (PVDF) membrane (Merck, Darmstadt, Germany). Each protein was detected using the indicated antibodies. The PVDF membranes were developed using Amersham ECL western blotting detection reagent (GE Healthcare, Chicago, IL, USA) or Amersham ECL prime western blotting detection reagent (GE Healthcare) using a ChemiDocTM imager (Bio-Rad, Hercules, CA, USA) between 1 s and 60 min. In some cases, the chemiluminescence of the PVDF membranes was detected using an ImageQuantTM LAS 4000 system (Fujifilm) between 1 s and 60 min (Fig. 1B, C, D). When the cell lysates were treated with RNase A or Endo H, 40 μg/mL RNase A (Nacalai) or 2 units/L Endo H (NEB, Ipswich, MA, USA) was added, and the mixture was incubated for 30 min at 37°C. For normal Laemmli SDS–polyacrylamide electrophoresis (SDS-PAGE), the cells were lysed for 30 min on ice in lysis buffer B, comprised of 50 mM Tris-HCl (pH 8.0), 150 mM NaCl, 1% Triton-X, 0.5% SDS, 20 μM MG-132, 1 mM PMSF, 10 μg/mL pepstatin A, 1 mM benzamide, and 10 μg/mL leupeptin. They were then analyzed using 8% or 10% Laemmli SDS-PAGE gels. After electrophoresis, the procedures were the same as those described above.

For phosphorylation assay, the cells were lysed for 30 min on ice in lysis buffer C, comprised of 50 mM Tris-HCl (pH 8.0), 150 mM NaCl, 1% Triton-X, 0.5% SDS, 20 μM MG-132, 1 mM PMSF, 10 μg/mL pepstatin A, 1 mM benzamide, 10 μg/mL leupeptin and Phos-STOP (Roche, Basel, Switzerland). They were then analyzed using 6% Laemmli SDS-PAGE gels for PERK or 4.5% Phos-tag gels, comprised of 0.375 M Tris-HCl (pH 8.8), 0.1% SDS, 0.1 mM MnCl2, and 12.5 μM Phos-tag (Wako, Osaka, Japan) for IRE1α.
Polysome analysis
HEK 293T cells (approximately 3.0 × 10⁶ cells) were seeded on a 10 cm2 dish coated with collagen. After 24 h, they were transfected with plasmid DNA (7.5 μg). After a further 24 h, the cells were washed once with 10 mL of phosphate-buffered saline (PBS). The cells were lysed on ice for 30 min in 500 μL of lysis buffer C, comprised of 20 mM 4-(2-hydroxyethyl)-1-piperazineethanesulfonic acid/potassium hydroxide (HEPES-KOH) (pH 7.5), 100 mM KCl, 10 mM MgCl2, 0.25% NP-40, 20 μM MG-132, 1 mM PMSF, and a protease inhibitor cocktail (Nacalai). The cell lysate was centrifuged at 10,000 × g for 10 min at 4°C. The supernatant (500 μL) was then layered onto a 14 mL 10–50% sucrose gradient comprising 20 mM HEPES-KOH, 100 mM KCl, and 10 mM MgCl2. The samples were centrifuged at 35,000 rpm (200,000 × g) for 190 min at 4°C in a SW-40Ti rotor (Beckman Coulter, Brea, CA, USA). After centrifugation, the ribosomal distribution was estimated by measuring the optical absorbance at 254 nm. The proteins in each fraction were precipitated with trichloroacetic acid (TCA), as described previously (Shao and Hegde, 2014). The proteins were then analyzed by immunoblotting with NuPAGETM using MOPS buffer.
Digitonin fractionation
The HEK293T cells were transfected with pcDNA3.1(+)_Fluc-ER (R30) and harvested using trypsin–EDTA. The cells were then suspended in DMEM and precipitated by centrifugation at 1,000 × g for 5 min at 4°C. After washing with ice-cold PBS, the cells were lysed on ice for 5 min in lysis buffer D, comprised of 50 mM HEPES-KOH (pH 7.5), 25 μg/mL digitonin (Wako), 150 mM KOAc, 2.5 mM Mg(OAc)2, 20 μM MG-132, 1 mM PMSF, 10 μg/mL pepstatin A, 1 mM benzamide, and 10 μg/mL leupeptin. The lysates were then centrifuged at 3,000 × g for 3 min at 4°C. The supernatants were obtained as cytosol fractions, and the pellets were washed and suspended again on ice for 5 min in lysis buffer E, comprised of 50 mM HEPES-KOH (pH 7.5), 1% TritonX-100, 0.5% deoxycholate, 500 mM KOAc, 2.5 mM Mg(OAc)2, 20 μM MG-132, 1 mM PMSF, 10 μg/mL pepstatin A, 1 mM benzamide, and 10 μg/mL leupeptin. The lysates were then centrifuged at 8,000 × g for 3 min at 4°C, and the supernatants were obtained as membrane fractions. The proteins in the resultant fractions were precipitated with TCA, dissolved in a smaller volume of lysis buffer E, and analyzed by immunoblotting with NuPAGETM using MOPS buffer.
Immunoprecipitation
The HEK293T cells were transfected with pcDNA_Fluc-ER or pcDNA_Fluc-ER[R30]. After 24 h, the cells were lysed on ice for 5 min in IP buffer A, comprised of 50 mM HEPES-KOH (pH 7.5), 100 mM KCl, 10 mM MgCl2, 20 mg/mL dodecylmaltoside, 20 μM MG-132, 1 mM PMSF, 10 μg/mL pepstatin A, 1 mM benzamide, and 10 μg/mL leupeptin. The cell lysates were centrifuged at 17,700 × g for 20 min at 4°C, and the supernatant was precleared with equilibrated protein G-Sepharose 4 Fast Flow (GE Healthcare) for 30 min at 4°C. The supernatant was then incubated with 5 μg anti-Fluc antibody for 1 h at 4°C. Then, the protein G-Sepharose was added and the mixture was incubated for a further 30 min. The samples were then centrifuged at 2,000 × g for 30 s at 4°C, and the supernatant was removed. The beads were washed four times with IP buffer and then incubated with 1 × sample buffer for 30 min at 37°C.
Statistical analysis
Quantification was performed using Multi Gauge ver.3.1 (Fujifilm) or Image Lab ver.6.0 software. One-way ANOVA with Tukey’s multiple comparison test was performed on data generated from n ≥ 3 biological replicates using GraphPad Prism version 8.00 software (GraphPad Software, San Diego, CA, USA). Results were deemed significant if P < 0.05, and were denoted *P < 0.05, **P < 0.01, and ***P < 0.001.
Results
Design of an ER-destined translational arrest protein (ER-TAP)
To clog translocons in mammalian cells, we designed an ER-TAP by attaching translational arrest motifs to model SPs at the C-terminus. As a model SP, we used Fluc-ER in which firefly luciferase was fused in-frame with the SS derived from calreticulin at the N-terminus (Nakamura et al., 2011). An arginine (Arg, R) repeat sequence was used for the translational arrest sequence because it reportedly causes translational slowdown (Lu and Deutsch, 2008). We examined the translational arrest capability of Arg-repeat motifs ranging from 0 to 30 Arg residues. In the experiment, the Arg-repeat motifs were inserted between enhanced GFP (EGFP) and mCherry in-frame (the insertion segments were adjusted to 30 amino acids by replacing Arg with alanine (Ala, A) (Fig. S1A, B). These were then translated with an in vitro translation (IVT) system using a rabbit reticulocyte lysate. As a result, 30 consecutive Arg residues (R30) were found to induce strong translational arrest, judging by the appearance of an RNase A treatment-sensitive intermediate composed of covalently attached tRNA and polypeptide synthesized until the arresting point (Fig. S1C, upper left panel). We then attached the R30 motif to the C-terminus of Fluc-ER and named it Fluc-ER[R30] (Fig. 1A). As expected, the transiently expressed Fluc-ER[R30] predominantly existed as translationally arrested intermediates in the HEK293T cells (Fig. 1B, right panel). Furthermore, polysome analysis of the protein revealed that almost all the Fluc-ER[R30] proteins were associated with ribosomes, whereas Fluc-ER was distributed in lighter fractions in addition to the ribosome fractions (Fig. 1C). Importantly, the level of the translationally arrested intermediates did not decrease even after 30 min of treatment with the translational initiation inhibitor, harringtonin in vivo, although the level of intermediates gradually decreased in the following chase period (Fig. 1D). Taken together, R30 motif induced a strong translational arrest in vitro and in vivo.
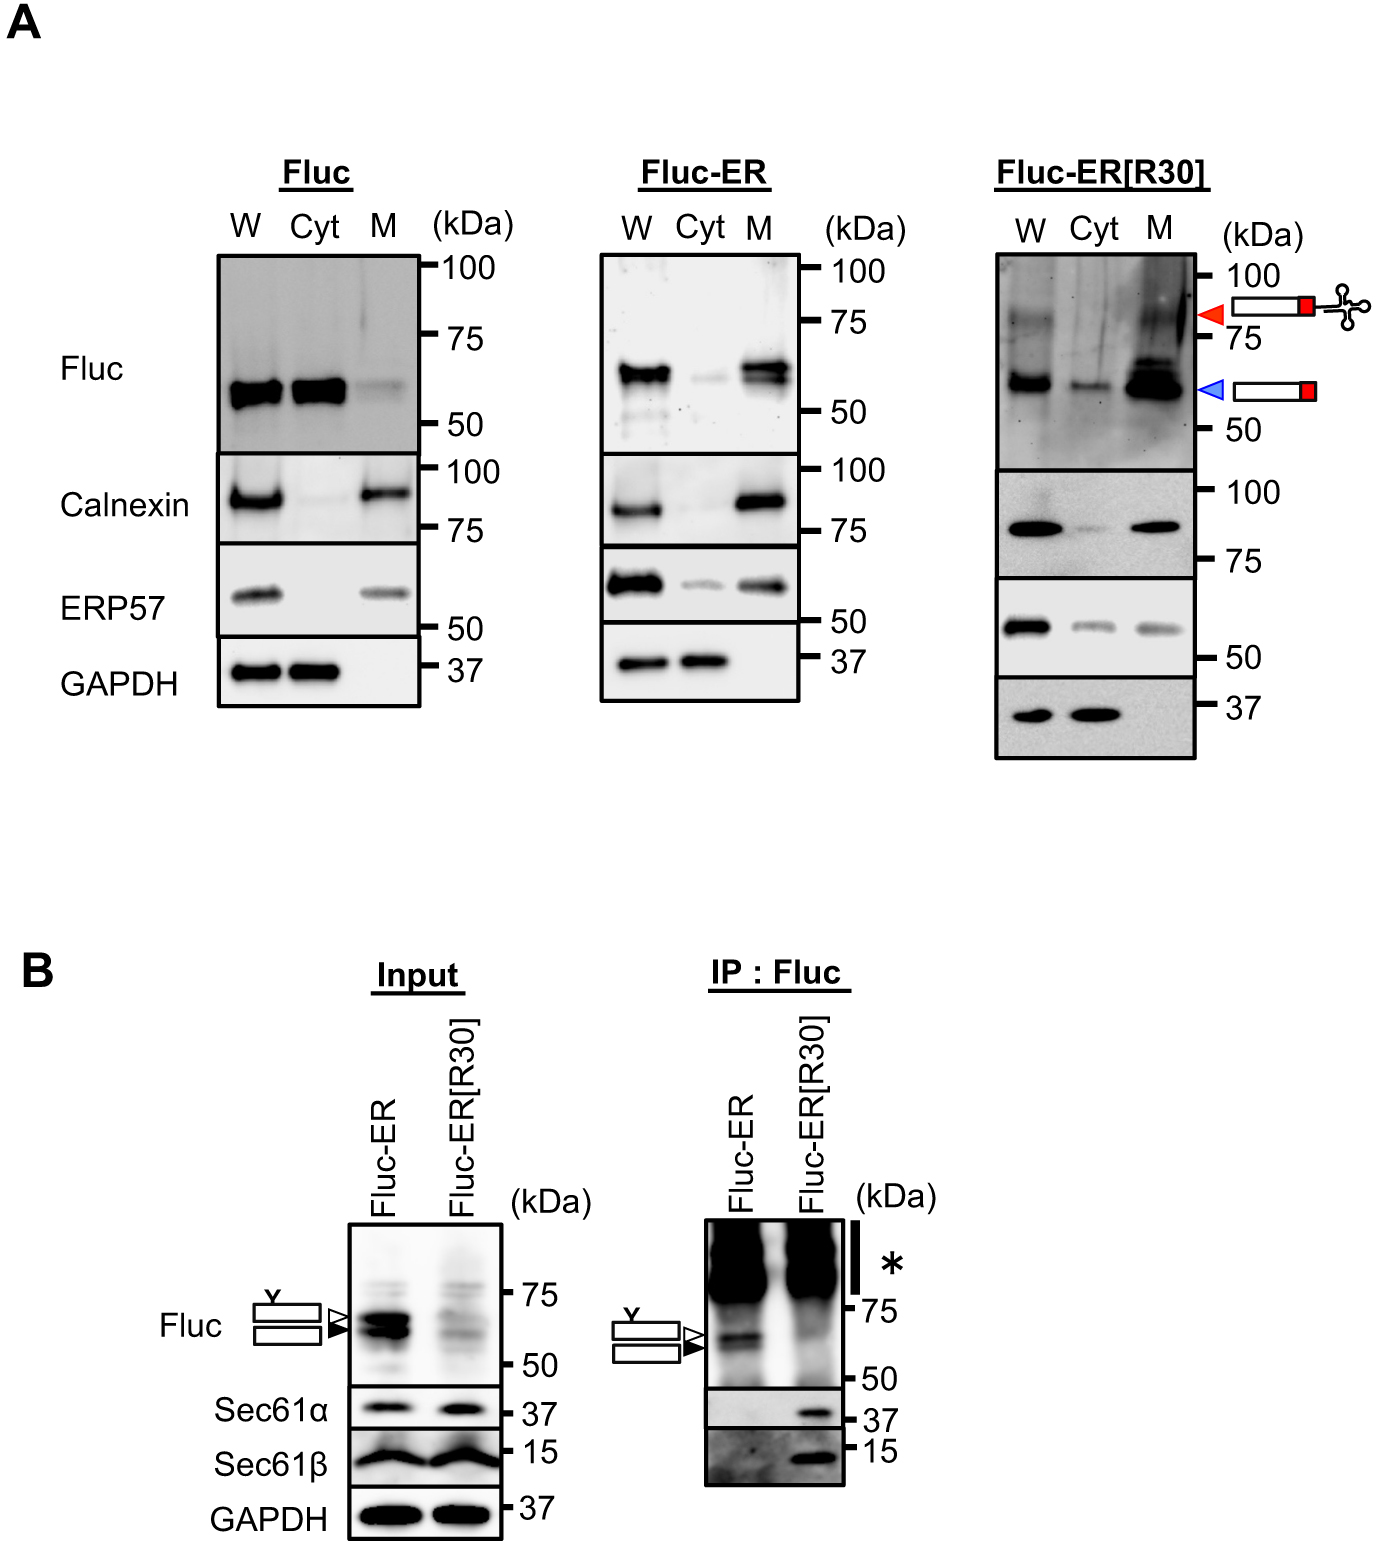
We next examined the subcellular distribution of Fluc-ER[R30] (Fig. 1A and Fig. S2A). Biochemical cell fractionation using digitonin showed that the translationally arrested Fluc-ER[R30] was predominantly partitioned in the membrane fraction as Fluc-ER, whereas cytosolic control, Fluc was predominantly partitioned in the cytosol fraction (Fig. 2A and Fig. S2B). Importantly, Fluc-ER[R30] was associated with translocon components Sec61α and Sec61β, whereas Fluc-ER was not (Fig. 2B). Collectively, we concluded that Fluc-ER[R30] exists as translationally arrested intermediates at translocons in the ER membrane (Fluc-ER[R30] is described as ER-TAP in the later part).
SS selection is exaggerated in the presence of ER-TAP
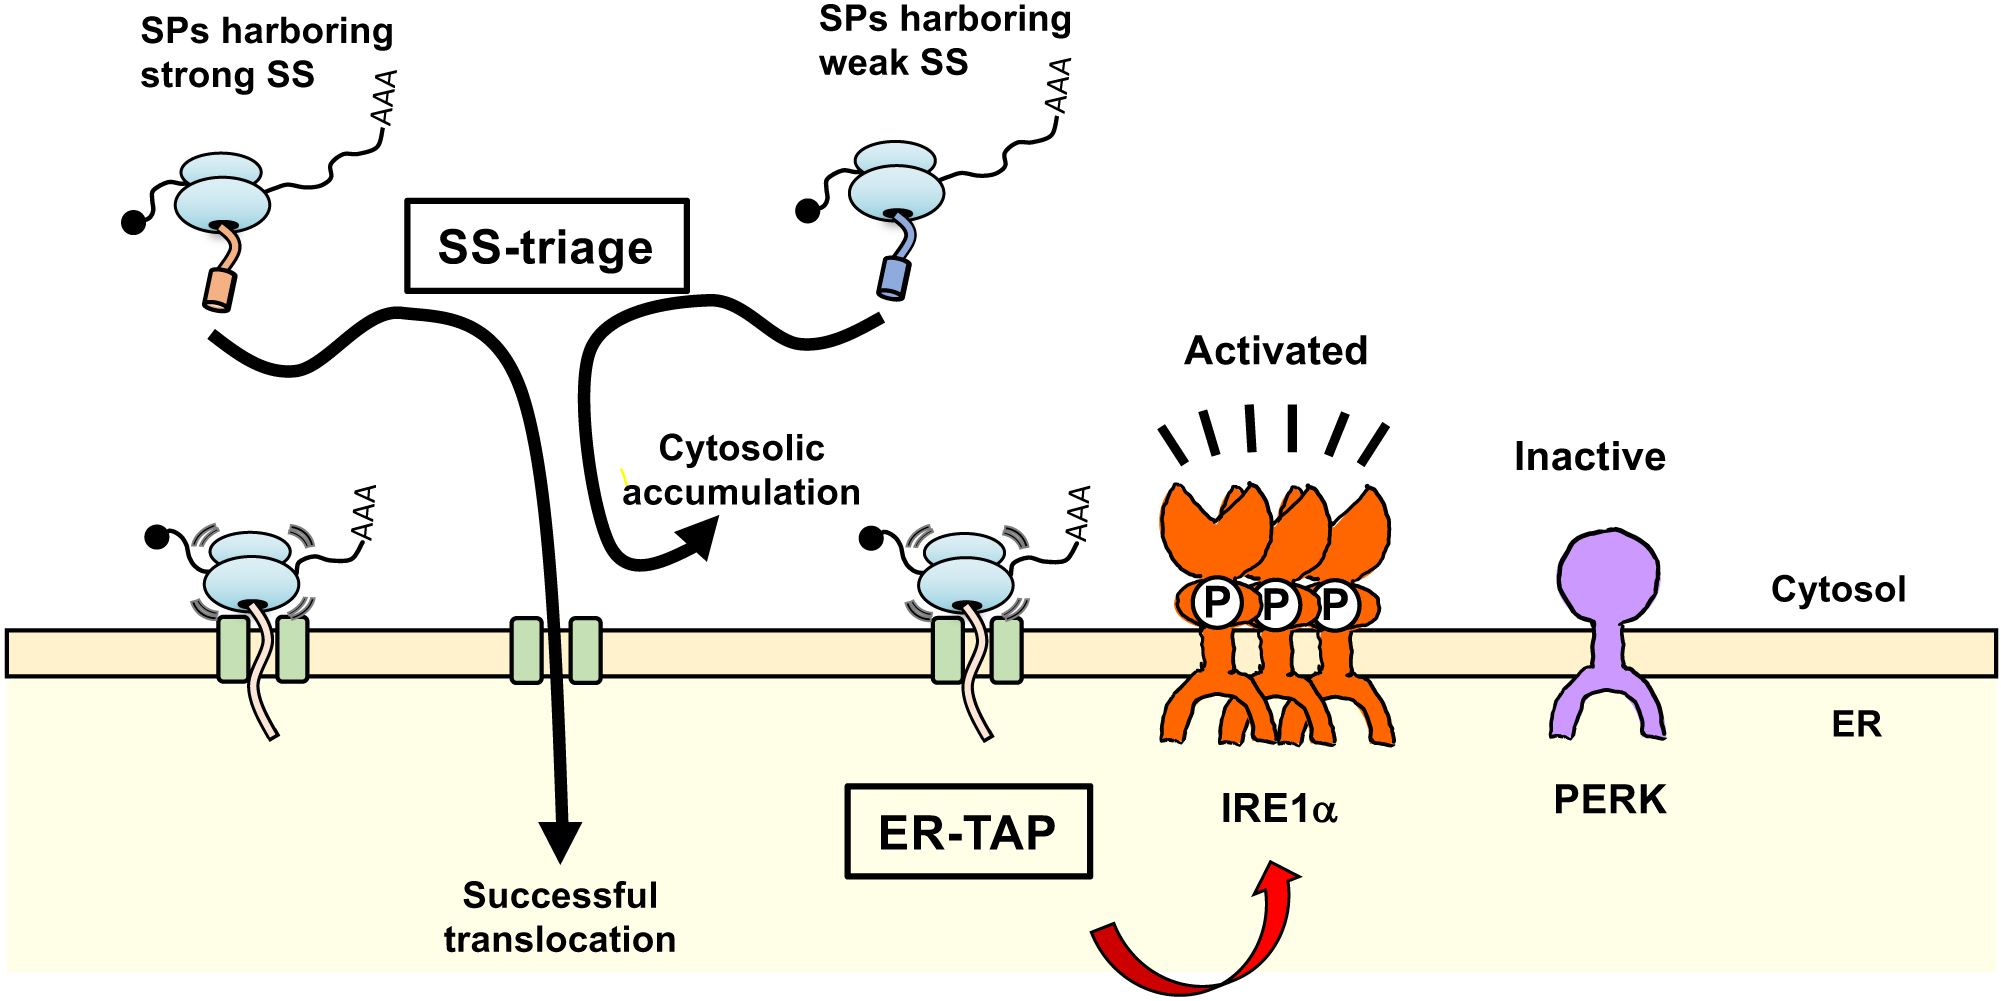
Given that ER-TAP obstructs translocons, we speculated that the expression of this protein may compromise the translocation efficiency of other SPs. To test this possibility, we evaluated the effect of ER-TAP/Fluc-ER[R30] on the translocation of a model SP—i.e., α1-antitrypsin (A1AT)—by measuring its glycosylated form. As shown in Fig. 3A and B, A1AT has three asparagine (N)-linked glycosylation sites, which can be removed by endoglycosidase H (Endo H) treatment. Given that N-linked glycosylation occurs after the translocation of SPs into the ER, the translocation efficiency of A1AT can be determined by measuring the ratio between the unglycosylated and glycosylated forms. As shown in Fig. 3D and E, the translocation efficiency of A1AT was 86% (lane 7). This value was modestly decreased to 58% when an excessive amount of Fluc-ER[R30] was co-expressed with A1AT (Fig. 3D and E, lanes 8–10). A previous report suggests that the translocation efficiencies of SPs depend on their SS (Kim et al., 2002). Furthermore, a group of proteins harboring weak SS, including prion protein and leptin, have been shown to not translocate into the ER under ER stress conditions due to compromised translocation capacity (Kang et al., 2006). This inspired us to examine the effect of ER-TAP/Fluc-ER[R30] in the translocation of proteins harboring weak SS. For this purpose, we changed the SS of A1AT to weak SS derived from prion protein or leptin (A1AT[PrP], A1AT[Lep]) (Fig. 3A). As shown in Fig. 3C, the untranslocated species of A1AT[PrP] and A1AT[Lep] were more evident than A1AT[WT], as expected (lanes 1, 4, and 7). Biochemical cell fractionation using digitonin showed that almost all glycosylated and unglycosylated A1AT were partitioned in the membrane fraction and cytosol fraction, respectively (Fig. 3C, lanes 5, 6 and 8, 9). This again confirmed that the lower bands were untranslocated species. We then determined whether the expression of ER-TAP/Fluc-ER[R30] would affect the translocation efficiencies of A1AT[PrP] and A1AT[Lep]. As shown in Fig. 3D and E, the ER translocation efficiency of A1AT[PrP] and A1AT[Lep] were more compromised than that of A1AT[WT] when Fluc-ER[R30] was co-expressed (lanes 7–10, 11–14, and 15–18), which indicates that weak SS-harboring proteins are more severely repelled under the ER-TAP/Fluc-ER[R30]-expressed condition. This SS-dependent repulsion was triggered by translocon obstruction because expression of Fluc, ER-targeted Fluc (Fluc-ER) or cytosolic Fluc with C-terminal translational arrest motif (Fluc[R30]) did not affect or modestly compromised translocation efficiency of A1AT variants (Fig. 3F and G, lanes 7–11, 12–16, and 17–21). These results indicate that SS selection is exaggerated under limited translocation capacity.

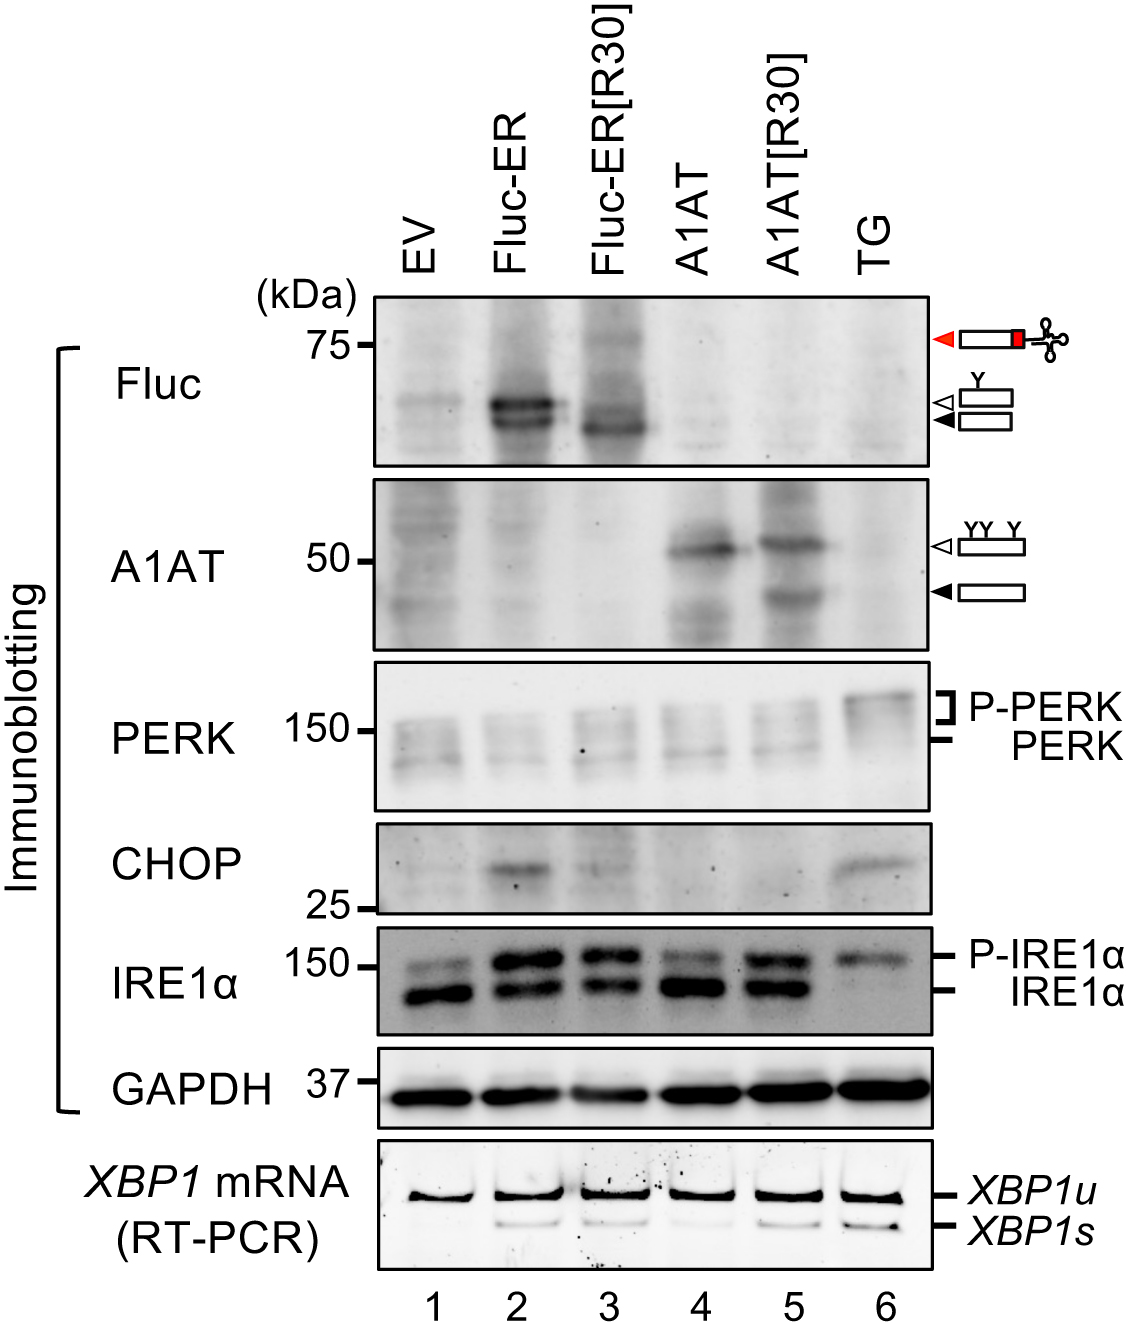
Perturbation of proteostasis in the ER is believed to be sensed by ER stress sensors. Therefore, we tested how these sensors respond to the translocon obstruction using the Fluc variants. In this experiment, activation status of ER stress sensors, PKR-like ER kinase (PERK) and IRE1α, were monitored by detecting the phosphorylation levels of these proteins and downstream events which are induced by the activation of the ER stress sensors. As the downstream events, splicing of XBP1 mRNA and CHOP protein up-regulation were monitored for activation of IRE1α and PERK pathway, respectively. The phosphorylation of PERK and IRE1α were detected by super-shift of these proteins by Laemmli SDS-PAGE and Phos-tag PAGE, respectively (Yang et al., 2010; Kanda et al., 2016). As expected, both PERK and IRE1α pathways were activated upon over-expression of ER-destined protein, Fluc-ER (Fig. 4, lane 2; Fig. S3A–D), not upon over-expression of cytosolic Fluc or Fluc[R30] (Fig. S3A and B). This was presumably due to excess protein influx into the ER and long-term retention in the ER of the proteins mediated by ER-retention signal in Fluc-ER, which would overwhelm the protein-folding capacity in the ER. In contrast, over-expression of ER-TAP/Fluc-ER[R30] strongly activated the IRE1α pathway whereas PERK pathway was unresponsive (Fig. 4, lane 3; Fig. S3). In addition to Fluc-ER[R30], we also tested another translocon clogger A1AT[R30] and its control A1AT (Fig. S2B and C; Fig. 4; Fig. S3C and D). As shown in Fig. 4, expression of A1AT[R30] induced activation of the IRE1α pathway but not the PERK pathway, whereas expression of A1AT did not activate both pathways. The two independent translocon cloggers specifically activate the IRE1α pathway but not the PERK pathway. Taken together, we proposed that ER-translocon clogging specifically activates the ER stress sensor IRE1α but not PERK. This model is based on the observation that expression of translocon cloggers specifically activates the IRE1α pathway. Considering that the two independent translocon cloggers specifically activate the IRE1α pathway, it is likely that translocon clogging specifically activates the IRE1α pathway. However, this phenomenon does not rule out a secondary effect of the expression of translocon clogger. In the future, following confirmation that the interaction between IRE1α and translocon is inhibited by expression of the translocon cloggers, our model will become more reliable.