Regular Article
Quantitative Analysis of Chromosome Polytenization in Synthetic Autopolyploids of Arabidopsis thaliana
2020 年 85 巻 3 号 p. 189-195
詳細
2020 年 85 巻 3 号 p. 189-195
The analysis of chromosome polytenization in the nuclei of autopolyploids may help to determine how polyploidy affects plant growth. We performed fluorescence in situ hybridization (FISH) analysis with a centromeric DNA probe on diploid and synthetic autopolyploid series (tetraploid, hexaploid, and octaploid) of Arabidopsis thaliana to observe and quantify chromosome polytenization in polyploid plants. Our FISH analysis revealed that the number of signals of centromeric sequence was smaller than the number of chromosomes in the nuclei of basic genomes in polyploid strains, which indicates the polytenization of chromosomes. In addition, the degree of chromosome polytenization increased as the degree of ploidy increased. This result suggests that the suppression of cell proliferation in polyploid plants may be related to chromosome polytenization. The FISH analysis confirmed that chromosome polytenization occurred in the nuclei of endoreduplicated cells in all strains. We also demonstrated that the degree of polytenization increased according to the endoreduplication level. In particular, chromosomes in the nuclei of endoreduplicated octaploid cells were highly polytenized, which is likely related to the severe growth suppression observed in these cells. This is the first report to explicitly show that chromosome polytenization occurs not only in the nuclei of endoreduplicated cells but also in those of non-endoreduplicated cells (cells with a basic genome) in autopolyploid plants.
Polyploidy is widespread in plants and is a major factor contributing to the speciation of polyploid species (Leitch and Bennett 1997). Polyploid species are suggested to have more potential than the original diploid species in terms of environmental adaptation, such as resistance to pathogens and tolerance to mineral-nutrient deficiencies, which are likely due to the changes in growth caused by polyploidization (Levin 1983, Otto and Whitton 2000). There are two kinds of polyploid species, allopolyploid and autopolyploid. Autopolyploids are formed through the multiplication of genomes within species, while allopolyploids are formed through the union of chromosome sets from different species either by hybridization between autopolyploids or chromosome doubling of diploid hybrids (De Bodt et al. 2005, Husband et al. 2013). Although scientific interest in both auto- and allopolyploids is continually increasing, most studies have focused on allopolyploids (Spoelhof et al. 2017). However, studies focusing on autopolyploids are important to elucidate the direct effect of genome multiplication per se on plant growth (Parisod et al. 2010).
Several studies have focused on the effect of genome multiplication on plant growth using synthetic autopolyploid series of the model plant A. thaliana. In the cortical cell file of roots, the cell growth rate and cell volume of tetraploids are larger than those of diploids, while the cell proliferation rate of tetraploids is decreased compared with that of diploids (Iwamoto et al. 2006). The epidermal pavement cell size of a sepal also increases linearly with the degree of ploidy, while the cell number in one sepal decreases (Robinson et al. 2018). The rosette growth rates of polyploids, tetraploids, hexaploids, and octaploids are slower than those of diploids, while tetraploids and hexaploids (but not octaploids) generate larger rosettes due to delayed flowering (Corneillie et al. 2019). The same study also showed that polyploidy affects the epidermal pavement of leaves with increased size and reduced cell number per one leaf blade with increasing ploidy.
Although we now understand how polyploidy affects plant growth, the chromosome dynamics in the polyploid series of A. thaliana are not well understood. There are only observations of chromosome behavior during meiosis in synthetic tetraploids and octaploids in Arabidopsis (Hayakawa et al. 2007, Iwamoto et al. 2008). However, the analysis of chromosome dynamics in polyploids is important to elucidate how polyploidy affects plant growth. This is because polyploidy is known to impair mitosis due to the segregation and arrangement of chromosomes during the M phase (Comai 2005, Hollister 2015).
On the other hand, chromosome polytenization generally occurs in endoreduplicated nuclei (Nagl 1976, D’amato 1989, Carvalheira 2000, Martinez-Perez et al. 2001), which makes it difficult for nuclei to segregate their chromosomes and divide. Studies using FISH analysis revealed that chromosome polytenization actually occurs in endoreduplicated nuclei in A. thaliana, both in roots (Fang and Spector 2005) and leaves (Breuer et al. 2007). If chromosome polytenization also occurs in the nuclei of polyploid strains, whose genomes have duplicated as in endoreduplicated nuclei, it likely affects mitosis and cell proliferation, as observed in the cortical cell file of Arabidopsis (Iwamoto et al. 2006).
Hence, in this study, we observed and quantified the degree of chromosome polytenization using FISH analysis in synthetic autopolyploid series of A. thaliana, including a diploid, tetraploid, hexaploid, and octaploid strain. We also aimed to identify how endoreduplication affects chromosome polytenization in each polyploid strain.
All Arabidopsis (A. thaliana) plants were of the Columbia ecotype. Synthetic polyploid series of A. thaliana (tetraploid, hexaploid, and octaploid) were obtained through colchicine treatment of diploid seedlings and flow cytometry (FCM)-based somatic ploidy analysis of their progeny obtained by self-fertilization for at least three generations.
Plant growth conditions for phenotypic, FCM, and FISH analyses were constant temperature, a 14-h light period, and a 10-h dark period (22°C, 80 µmol m−2 s−1).
FCM analysisCauline leaves were collected 30–40 days after sowing (DAS) seedlings of each strain, and their ploidy was confirmed with a flow cytometer (Ploidy Analyzer PA; Partec) using a chopping method according to Johnston et al. (1999).
FISH analysisChromosome spreads were prepared from mesophyll cells of 45-DAS seedlings according to Ross et al. (1996), with minor modifications. The spreads were then treated with 0.1 mg mL−1 RNase A at 37°C for 30 min, 2.5 mg mL−1 pepsin at 37°C for 2 min, and 4% formaldehyde at room temperature for 10 min before being dehydrated in an ethanol series. FISH probe was the centromere-specific 180-bp repeat sequence amplified by PCR (Heslop-Harrison et al. 1999) and labeled with Cy3-dCTP (GE Healthcare). The prepared probe was dissolved in 50% formamide/2×SSC (SSC is 0.15 M NaCl and 0.015 M sodium citrate) and applied to the chromosome spreads. Chromosome spreads were incubated at 37°C for over 16 h, washed with 50% formamide/2×SSC, 2×SSC, and SSC at 37°C for 30 min, and mounted with Vectashield (Vector Laboratories) containing 1.5 mg mL−1 4′,6-diamidino-2-phenylindole (DAPI). The spreads were observed with a fluorescence microscope (Olympus BX53) and photographed with a CCD camera (Olympus DP73).
Images of each cell were processed with Adobe Photoshop CS4 software and analyzed using ImageJ software (NIH) to quantify nuclear size (area) and the sum of the number of Cy3 spots in each nucleus. Non-hierarchical cluster analysis using the K-means method was performed for the data set of the number of Cy3 spots and DAPI stained area (K=3).
First, we observed the seedlings of polyploid series, including a diploid strain, to compare the rosette growth and flowering among the strains (Fig. 1). A severe delay in the rosette growth of seedlings before flowering was observed in the plants with higher ploidy levels (hexaploid strain=ColH and octaploid strain=ColO), particularly in ColO at 20 DAS (the first row of Fig. 1). The growth rates of the diploid strain (ColD) and tetraploid strain (ColT) were similar, although the seedling of ColT was slightly larger than that of ColD at the same developmental stage. Flowering was observed for ColD and each polyploid strain at 30 DAS, while a severe delay occurred in ColO (the second row of Fig. 1). The seedling of ColD was significantly larger than that of any other polyploid strain at the same stage. Then, the inflorescences of ColD and polyploid series grew, but the seedling of ColD was still larger than that of any other polyploid strain at 40 DAS (the third row of Fig. 1). The seedling size was inversely proportional to the ploidy level, while the seedling size of ColO was significantly smaller than that of other strains at this developmental stage. The growth of all strains almost completely stopped at 60 DAS (the fourth row of Fig. 1). The height of ColT was slightly taller than that of ColD, while the number of flowers and the rosette size of ColD were clearly larger than those of ColT. However, the growth of plants with a higher ploidy level (ColH and ColO) was still delayed at this mature stage, especially for ColO.

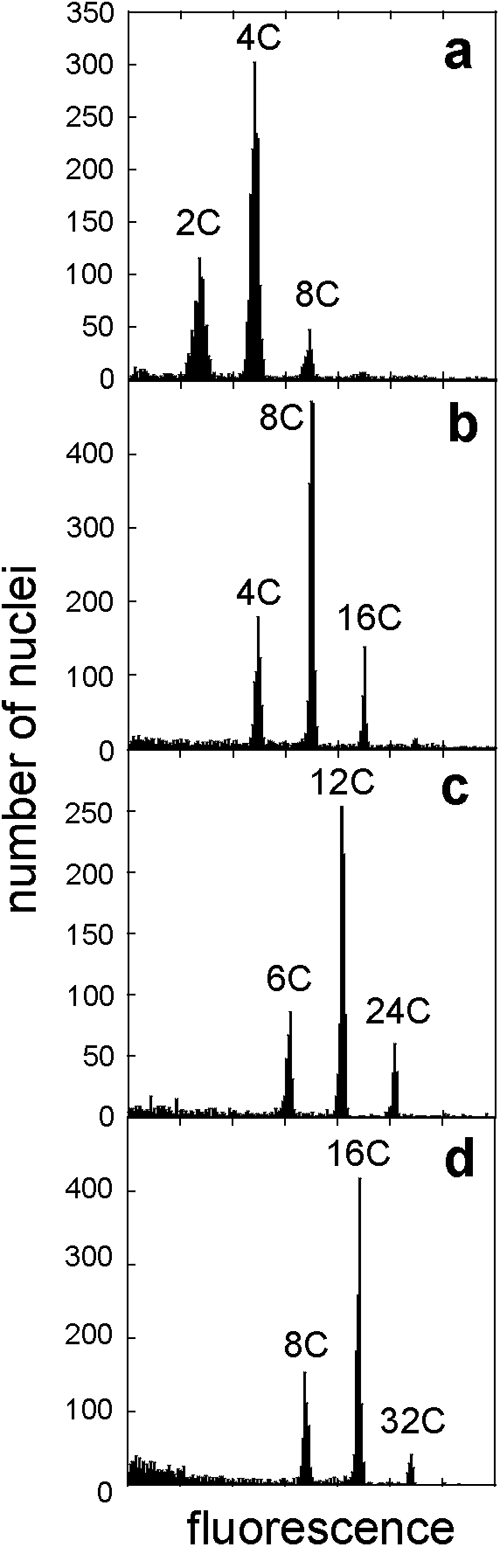
The FCM analysis revealed that there were only three peaks in the FCM histogram of the isolated leaf nuclei for each strain (Fig. 2), in which the first peak corresponds to nuclei of a basic genome, the second one corresponds to nuclei that underwent one cycle of endoreduplication, and the third one corresponds to nuclei that underwent two cycles of endoreduplication. For example, we observed three peaks in ColD at 2C, 4C, and 8C, which correspond to the nuclei of the basic genome, after one endoreduplication, and after a second endoreduplication, respectively. The following FISH analysis was performed using these polyploid strains whose ploidy was confirmed.
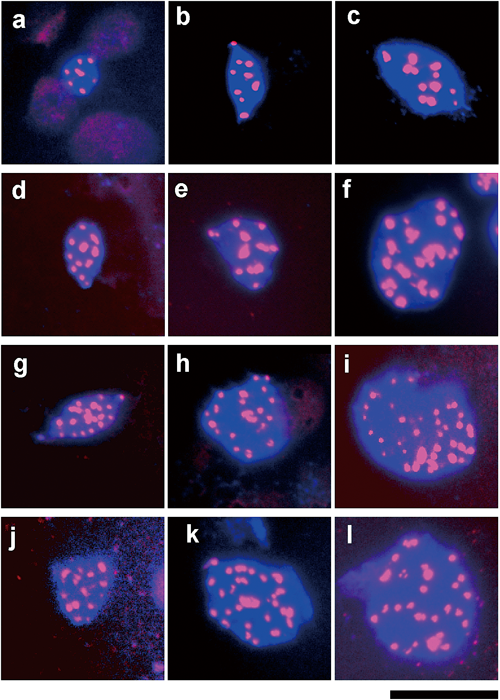
Our FISH analysis using a probe of centromere-specific repetitive DNA revealed that the nuclei of the basic genome in polyploid cells did not contain the expected number of centromeres (Fig. 3). Although the observed number of Cy3 spots in ColD was almost same to the expected number (10) (Fig. 3a), the observed number of Cy3 spots in the polyploid cells was much fewer than the expected number; the expected number of centromeres is 20 in ColT, but the observed number was about 11–15 (Fig. 3d); the expected number is 30 in ColH, but the observed number was about 13–24 (Fig. 3g); the expected number is 40 in ColO, but the observed number was about 15–24 (Fig. 3j). However, the observed number in ColD was almost the same as the expected number (10) (Fig. 3a), suggesting that the chromosomes of the basic genome in polyploid cells are polytenized. The FISH analysis also revealed that the number of Cy3 spots in endoreduplicated cells in all strains was increased, but it was much fewer than the expected number; the expected number of centromeres in cells after one endoreduplication is 20 in ColD, but the observed number was about 8–12 (Fig. 3b); and the expected number of centromeres in cells after a second endoreduplication is 40 in ColD, but the observed number was about 10–17 (Fig. 3c); the expected number of centromeres in cells after one endoreduplication is 40 in ColT, but the observed number was about 13–25 (Fig. 3e); the expected number of centromeres in cells after a second endoreduplication is 80 in ColT, but the observed number was about 17–32 (Fig. 3f); the expected number of centromeres in cells after one endoreduplication is 60 in ColH, but the observed number was about 16–30 (Fig. 3h); the expected number of centromeres in cells after a second endoreduplication is 120 in ColH, but the observed number was about 28–38 (Fig. 3i); the expected number of centromeres in cells after one endoreduplication is 80 in ColO, but the observed number was about 18–30 (Fig. 3k), and the expected number of centromeres in cells after a second endoreduplication is 160 in ColO, but the observed number was about 18–33 (Fig. 3l). We determined the ploidy level of nuclei based on the number of Cy3 spots and the DAPI-stained area using a method described in the following paragraph.
Then, we quantified the degree of chromosome polytenization in each strain. We first clustered the data set of Cy3 spots and DAPI-stained area using K-means clustering with K=3 (Fig. 4), because every strain includes nuclei of three kinds of ploidy level (Fig. 2). Each cluster recognized in Fig. 4 corresponds to the nuclei of a basic genome, cells after one endoreduplication, and cells after two endoreduplications. The clustering analysis classified a few of data points into the clusters of the nuclei of basic genomes, although their numbers of Cy3 spots are a bit more than the expected chromosome numbers of the nuclei of basic genomes; three points in ColD (11, 11, 12. The chromosome number is 10), four points in ColT (21, 22, 22, 25. The chromosome number is 20) and two points in ColH (34, 35. The chromosome number is 30). We moved these data points to the clusters of nuclei of cells after one endoreduplication.
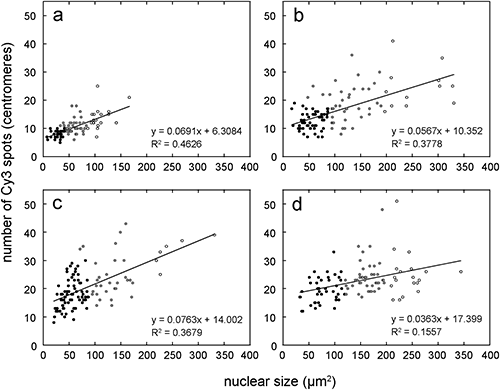
Then, we averaged the nuclear size and number of Cy3 spots for every cluster of each strain and determined the degree of chromosome polytenization by the equation shown in the bottom right of Table 1. The results of the quantitative analysis indicate that the degree of polytenization in the nuclei of the basic genome increases with the ploidy level (Table 1). In addition, the degree of polytenization also increases according to the endoreduplication level in each strain. In particular, the chromosomes of ColO were highly polytenized. More than half of the chromosomes were polytenized, even in the nuclei of the basic genome, and most chromosomes (more than 80%) were polytenized in the nuclei after a second endoduplication. The regression analysis of the number of Cy3 spots and nuclear size also showed a higher degree of polytenization in the endoreduplicated nuclei of ColO compared with those of ColT and ColH (Fig. 4).
| Strain | Ploidy | Nuclear size (µm2)±SD | Number of Cy3 spots±SD (a) | Expected number of chromosomes (b) | Degree of polytenization (%) (c) |
|---|---|---|---|---|---|
| ColD | 2C (41) | 28.2±8.7 | 8.0±1.3 | 10 | 20 |
| 4C (41) | 58.8±12.3 | 10.7±2.5 | 20 | 46.5 | |
| 8C (21) | 107.9±18.5 | 13.7±3.9 | 40 | 65.8 | |
| ColT | 4C (55) | 56.3±19.3 | 12.7±3.0 | 20 | 36.5 |
| 8C (39) | 123.6±33.9 | 18.6±6.3 | 40 | 53.5 | |
| 16C (12) | 256.7±53.2 | 24.7±7.4 | 80 | 69.1 | |
| ColH | 6C (72) | 53.8±18.0 | 18.0±5.2 | 30 | 40.0 |
| 12C (30) | 127.2±28.0 | 23.9±7.5 | 60 | 60.2 | |
| 24C (6) | 251.5±42.9 | 33.2±5.1 | 120 | 72.3 | |
| ColO | 8C (42) | 77.8±24.6 | 19.5±4.5 | 40 | 51.3 |
| 16C (43) | 161.7±20.4 | 24.1±5.6 | 80 | 69.9 | |
| 32C (19) | 242.3±32.1 | 25.1±8.0 | 160 | 84.3 |
c=[(b−a)/a]×100 The number of observed nuclei for each cluster is shown in parentheses of Ploidy.
Our results reveal that polyploidization accelerates chromosome polytenization because the degree of chromosome polytenization increases according to the ploidy level (Table 1). This is the first report showing that chromosome polytenization occurs not only in the nuclei of endoreduplicated cells but also in those of basic genomes in polyploid cells.
Chromosome polytenization likely affects arrangement and segregation during mitosis in polyploid cells. In fact, a quantitative analysis of the root cortical cell file in A. thaliana revealed that the cell proliferation rate of synthetic tetraploids decreases compared with that of diploid strains (Iwamoto et al. 2006). Corneillie et al. (2019) also showed that cell proliferation was more suppressed with the progression of polyploidization in the epidermal pavement cells of A. thaliana. That is, the cell proliferation rate in polyploid strains may be reduced compared with that of diploid strains due to the delay of mitosis caused by chromosome polytenization. Although previous studies observed chromosome behavior during meiosis in synthetic tetraploids and octaploids of A. thaliana (Hayakawa et al. 2007, Iwamoto et al. 2008), chromosome behavior during mitosis in polyploid strains needs to be described in detail to elucidate the effect of chromosome polytenization on cell proliferation.
Chromosome polytenization in endoreduplicated cells is accelerated in polyploid strainsSimilar to previous studies, we confirmed that the degree of chromosome polytenization increased due to endoreduplication in A. thaliana (Fang and Spector 2005, Breuer et al. 2007) and found that chromosome polytenization was accelerated as the endoreduplication level increased in each strain (Table 1). Chromosome polytenization in endoreduplicated nuclei of A. thaliana is usually considered to be complete polytenization (Tsukaya 2008); i.e., replicated chromosomes are completely polytenized, and the chromosome number of endoreduplicated nuclei appears to be the same as in the nuclei of a basic genome. In this study, we revealed that endoreduplicated chromosomes were highly polytenized, but not completely polytenized in A. thaliana.
The acceleration of polytenization in endoreduplicated cells is particularly distinct in the octaploid (ColO) (Fig. 4d, regression line; Table 1), which may be associated with the severe suppression of growth observed in ColO (Fig. 1). Growth suppression in high polyploids (more than octaploid) is well known as the high-ploidy syndrome (Tsukaya 2008, 2013). The high-ploidy syndrome is likely common in the autopolyploids of angiosperm, and the acceleration of polytenization in endoreduplicated cells in high polyploids may be a primary factor contributing to the syndrome. It is necessary to quantify chromosome polytenization in endoreduplicated cells of high polyploids in species other than A. thaliana in a future study.
We would like to thank Dr. Yoshitaka Azumi, Kanagawa University for his technical advice on FISH analysis. This work was supported by MEXT KAKENHI Grant-in-Aid for Scientific Research on Innovative Areas “Plant-Structure Optimization Strategy” Grant Numbers JP19H05358 (to A.I.) and by JSPS KAKENHI Grant Numbers JP19K06718 (to A.I.).