Regular Article
Cytotoxic and Cytostatic Effects of Leaf Aqueous Extract of Crinum asiaticum in Allium cepa Root Apical Meristem Cells
2022 年 87 巻 2 号 p. 107-112
詳細
2022 年 87 巻 2 号 p. 107-112
Crinum asiaticum is a well-known medicinal plant of the family Amaryllidaceae. The present study aimed to analyze the cytotoxic and cytostatic effects of leaf aqueous extract of C. asiaticum (LAECA). The 48-h aged Allium cepa roots were treated with LAECA (0.25–2.0 mg mL−1) and root growth inhibition, mitotic index (MI), chromosomal and cytological aberrations were analyzed. The LAECA induced a concentration-dependent root growth retardation, decreased MI, and increased the various cytological aberrations, like giant cells, hyperchromasia, sticky chromosome, chromosome break, polar deviation, and binucleated cells in A. cepa root apical meristem. Thus, the present study explores the cytotoxic and cytostatic effects of LAECA.
The Crinum asiaticum L. is a perennial, evergreen, small or medium-sized herbaceous, and bulbous. It that belongs to the family Amaryllidaceae and distributes throughout America, Africa, India, Southern Asia, and Australia. It is used traditionally in the treatment of hemorrhoids, lumbago, fever, aches, earaches, headaches, and piles (Hutchings et al. 1996). In Southeast Asian countries, its leaves are used in treating various acne problems, swellings, inflammation, and oil extracted from the leaves have been used as a wound healer (Rahmatullah et al. 2010). In some places, its leaf juice is used to cure earache, digestive problems, wounds, fever, and inflammatory problems (Ji and Meerow 2000, Meena et al. 2010). Its leaf ointment is traditionally used against fractures, injuries, and piles (Singh et al. 2010). In some places in Thailand, the leaves are used against fever (Chuakul et al. 2002). This plant is used by the tribes of Chittagong hilly areas in Bangladesh for treatments of multiple ailments (Ghani 1998, Ji and Meerow 2000). C. asiaticum contains all the major secondary metabolites such as phenolics, flavonoids, terpenoids, amides, coumarins, alkaloids, etc. and the pharmacological activities of the Amaryllidaceae family (Ghosal et al. 1985, Fennell and Van Staden 2001, Sun et al. 2009, Goswami and Ray 2017, Goswami et al. 2020).
The leaf ethanolic extract of this plant showed excellent antibacterial activity against Staphylococcus aureus, Bacillus subtilis, Escherichia coli, and Psuedomonas aeruginosa (Ilavenil et al. 2010). Indradevi et al. (2012) explained the beneficial effect of this extract to treat hepatotoxicity. Further research on the leaves of this plant established the wound healing property of methanolic extract in the rat model (Kumar 2011). Rahman et al. (2013) reported that the crude leaf extract of this plant possessed potential anti-inflammatory and analgesic activities in Wistar rats. The anti-inflammatory activity of chloroform and methanolic leaf extract fractions of this plant was comparable to standard drug indomethacin (Samud et al. 1999). Further investigation on the anti-inflammatory effect of C. asiaticum on normal human fibroblast cells, established its potential efficacy against inflammation (Kim et al. 2008). Similarly, Fu et al. (2012) reported the antimicrobial effect of essential oil of C. asiaticum against pathogenic fungi. Jeong et al. (2016) showed a significant anti-obesity activity of the aerial ethanolic extract fraction. Earlier, we have reported the antioxidant activity of the leaf aqueous extract of C. asiaticum and the comparative antioxidant and antimicrobial efficacies of the different extract fractions of C. asiaticum leaves (Goswami et al. 2020). The anti-angiogenic and cytotoxic effects of methanolic leaf extract were observed in EAhy-926 cells. In addition to resisting cellular migration and blood vessel formation this extract also prevented the release of cytokine VEGF in EAhy-926 cells (Mohamed et al. 2017). Recently, Tan et al. (2019) also showed cytotoxic effects of essential oil, extracted from C. asiaticum leaves, in MCF-7 cells. They also showed the potent antimicrobial activity of this essential oil against Rhizopus sp, Shigella boydii, and Candida albicans. But, the detailed cytotoxic and cytostatic effects of leaf aqueous extract of this plant are not clear. Therefore, we aimed to explore cytotoxic and cytostatic effects of leaf aqueous extracts of C. asiaticum by A. cepa assay, a sensitive and cheap system to measure the cytotoxic effects of pollutants, chemical substances, and plant extracts (Andrade et al. 2008, Bakare et al. 2012, Frescura et al. 2013, Ray et al. 2013a, b, Chaudhuri and Ray 2015, Kundu and Ray 2016, Barman et al. 2020, 2021, Roy et al. 2021, Chakraborty et al. 2021, Das et al. 2021).
The fresh leaves of C. asiaticum were collected from the Golapbag campus of the University of Burdwan, West Bengal and it was taxonomically identified, a voucher specimen (No. BUBCRD-018) was preserved in the Department of Zoology of The University of Burdwan. The collected leaves were properly washed, shade-dried and pulverized in an electric mixer grinder (Philips Mixer Grinder HL1605, Kolkata, West Bengal, India). The pulverized leaf powder (50 g) was then used for extraction through a regulated heater (70–80°C) by using 500 mL distilled water for consecutive 3 hours. After heating the leaf aqueous extract was filtered through Whatman filter paper #1, coded as LAECA, and stored in a deep refrigerator (−20°C).
A. cepa root growth retardation and cytotoxic effectsThe similar-sized onion bulbs were selected, and their outer scales were peeled off along with the old, dry roots, and surface sterilized by 1% sodium hypochlorite solution for 10–15 min. Then the sterilized bulbs were washed in tap water and allowed for root sprouting in distilled water within small glass containers that were maintained in an environmental test chamber (27–30°C). The 48-h aged the equal-sized (1.5–2 cm) roots were treated with 0.25, 0.5, 1, and 2 mg mL−1 concentrations of LAECA and the root lengths were measured at 24, 48, and 72 h. Simultaneously the control sets were maintained only in distilled water.
The cytotoxic and cytostatic effects of LAECA were analyzed from the squashed A. cepa root tip cells by the standard protocol, as described earlier (Ray et al. 2013a, b), with slight modifications. The LAECA treated (2, 4, and 6 h) and untreated root tips were fixed in freshly prepared aceto–methanol (1 : 3) for 24 h. The root tips were hydrolyzed in 1 M HCl for 10 min, stained with 2% aceto-orcein, and squashed in 45% acetic acid (Ray et al. 2013a, b). At least three slides of squashed root tips were prepared for each concentration and visualized through a microscope (Magnus MLX). The digital images were captured using the software Future Win Joe, Future Optics (Version 1.6.5.1207).
Scoring and statistical analysisThe cytological and chromosomal abnormality frequencies were scored using the formula:
Cytological Abnormality=(Number of aberrant cells during interphase/Total number of cells)×100, Chromosomal Abnormality=(Number of aberrant cells during mitosis/Total number of dividing cells)×100, MI=(Number of dividing cells/Total number of cells)×100. The root growth inhibitory effect of LAECA was analyzed through Student’s t-test using the origin 5.0 software. The frequencies of chromosomal and cytological abnormalities and MI were analyzed with a 2×2 contingency χ2 test. The difference between the control and treated samples was significant at p≤0.01 or p≤0.001 or p≤0.0001.
The LAECA treatment (0.25–2 mg mL−1) in A. cepa root apical meristem cells showed a concentration-dependent root growth inhibitory effect. The highest concentration of LAECA (2 mg mL−1) showed the maximum root growth inhibitory effect (92.32±1.9%) and the lowest root growth (0.13±0.0 cm) at 72 h (Table 1). The used lowest concentration (0.25 mg mL−1) of LAECA inhibited the root growth more efficiently at 72 h (52.32±4.1%) in comparison to 24 h (28.94±5.1%) and the root lengths records were 0.83±0.1 and 0.44±0.0 cm respectively at 72 and 48 h. The LAECA (1 mg mL−1) treatment also showed increased root growth inhibitory effect (87.81±2.4%) at 72 h. The increasing duration of LAECA treatment reflected the time-dependent root growth retardation effect and the IC50 values were scored as 0.486, 0.296, and 0.240 mg mL−1 at 2, 4, and 6 h, respectively indicating cytostatic effects. There are earlier reports about the plant extract-induced root growth retardation effects in root apical meristem cells of A. cepa (Ray et al. 2013a, b, Barman et al. 2020).
| LAECA concentration (mg mL−1) | Root growth (cm) [Root growth inhibition %] MEAN±SEM | ||
|---|---|---|---|
| 24 h | 48 h | 72 h | |
| 0 | 0.62±0.2 [0] | 1.15±0.1 [0] | 1.77±0.1 [0] |
| 0.25 | 0.44±0.0 [28.94±5.1]a | 0.62±0.01 [43.44±4.6]b | 0.83±0.1 [52.32±4.1]b |
| 0.50 | 0.24±0.0 [61.17±5.0]b | 0.31±0.1 [73.65±3.5]b | 0.35±0.0 [80.10±2.5]b |
| 1 | 0.18±0.0 [73.25±5.5]b | 0.21±0.0 [80.51±3.8]b | 0.21±0.0 [87.81±2.4]b |
| 2 | 0.08±0.0 [84.38±4.0]b | 0.09±0.0 [91.71±2.3]b | 0.13±0.0 [92.32±1.9]b |
| IC50 | 0.486 mg mL−1 | 0.296 mg mL−1 | 0.240 mg mL−1 |
The values of treated groups are significant (at a p<0.01, b p<0.0001) as compared to their respective control by Student’s t-test (two population).
The reduction in MI, cytostatic effect, indicates the possible induction of cytotoxicity, and A.cepa is commonly used to determine the cytotoxic effects (Prajitha and Thoppil 2016). Here, we tested the cytostatic effect of LAECA in root apical meristem cells of A. cepa. A considerable difference was found between the MI values of LAECA treated samples (0.5–4 mg mL−1) and the untreated control. The maximum reduction in MI values was scored as 2.89±0.7, 2.07±0.2, and 1.67±0.0% respectively at 2, 4, and 6 h at the highest LAECA treatment concentration (4 mg mL−1). The lowest treatment concentration (0.50 mg mL−1) also showed a reduction in MI (4.73±0.3, 2.87±0.1, and 2.79±0.1%) with increasing treatment durations (2, 4, and 6 h) (Table 2). These results refer to both the time and concentration-dependent cytostatic effect of LAECA. Previous reports suggested that reduction in MI values may be the result of the discontinuation of the replication of DNA or blockage during the G2 phase of the cell cycle or disturbances in the mitotic phases such as insufficient synthesis of ATP during spindle fiber formation and elongation, Which can prevent the cells from further division (Sudhakar et al. 2001, Sreeranjini and Siril 2011, Pandey et al. 2014). The appearance of various cytological and chromosomal aberrations in root apical meristem cells of A. cepa after treatment with different chemicals attributed to their cyto-genotoxic effect (Rosculete et al. 2019). During interphase various cytological abnormalities were increased with the increasing treatment concentrations of LAECA. The prevalent cytological abnormalities were giant cells and hyperchromatinized cells during interphase (Fig. 1). The frequency of giant cells was maximized at 6 h and the highest percentage (5.91±0.6) was recorded from 4 mg mL−1 LAECA treatment. The LAECA treatment (2 and 4 mg mL−1) induced a significant (p≤0.0001) increase of hyperchromasia at 4 and 6 h. The maximum percentage (8.03±0.6) of hyperchromasia was found at 4 mg mL−1 of LAECA at 4 h. Few binucleate cells were also observed. The higher percentages of cellular abnormalities (3.64±0.5, 9.53±0.5, and 12.66±1.9%) were found at the highest treatment concentration (4 mg mL−1) of LAECA (at 2, 4, and 6 h, respectively) (Table 2). The giant cells are generated as a result of endoreplication or endomitosis whereas the binucleated cells appear due to the aborted cytokinesis.
| Time (h) | Conc. (mg mL−1) | TCS | MI (%) | TADC % | Cellular abnormalities in mitotic phases | TAC % | Cellular abnormalities in interphase | ||||
|---|---|---|---|---|---|---|---|---|---|---|---|
| SC % | PD % | CB % | GC % | HC % | BN % | ||||||
| 2 | 0.0 | 3774 | 4.73±0.3 | 0.06±0.1 | 1.18±0.6 | 1.09±0.6 | 0.0±0.0 | 0.29±0.0 | 0.19±0.1 | 0.18±0.1 | 0.00±0.0 |
| 0.5 | 2833 | 4.73±0.3 | 1.83±0.2c | 24.63±1.9c | 11.96±1.0c | 2.01±1.1 | 2.81±0.5c | 0.61±0.2b | 2.19±0.3c | 0.00±0.0 | |
| 1 | 3568 | 3.63±0.7a | 1.70±0.2c | 28.05±0.9c | 18.21±1.5c | 1.62±0.8 | 3.55±0.6c | 2.53±0.7c | 0.38±0.2 | 0.63±0.1c | |
| 2 | 4216 | 3.59±0.3a | 1.32±0.4c | 23.66±5.6c | 11.23±3.6b | 2.69±0.7 | 3.56±0.1c | 0.54±0.1b | 3.01±0.1c | 0.00±0.0 | |
| 4 | 4517 | 2.89±0.7c | 0.99±0.2c | 26.19±7.0c | 12.24±4.9b | 0.00±0.0 | 3.64±0.5c | 1.39±0.1c | 2.09±0.5c | 0.16±0.1 | |
| 4 | 0.0 | 1480 | 6.70±0.3 | 0.00±0.0 | 0.00±0.0 | 0.00±0.0 | 0.00±0.0 | 0.73±0.07 | 0.21±0.02 | 0.26±0.13 | 0.27±0.1 |
| 0.5 | 2502 | 2.87±0.1c | 1.03±0.1c | 29.95±2.7c | 6.00±1.8 | 0.00±0.0 | 2.72±0.4c | 0.90±0.3a | 1.87±0.3c | 0.26±0.1 | |
| 1 | 3023 | 2.62±0.4c | 0.68±0.1c | 21.59±2.9c | 4.01±0.7 | 0.-0±0.0 | 4.43±0.2c | 2.65±0.0c | 1.38±0.2b | 0.39±0.0 | |
| 2 | 2796 | 2.46±0.3c | 0.68±0.1c | 27.76±5.2c | 0.00±0.0 | 0.00±0.0 | 8.18±1.9c | 1.67±0.2c | 6.19±1.9c | 0.32±0.1 | |
| 4 | 3318 | 2.07±0.2c | 0.66±0.1c | 29.78±5.8c | 0.00±0.0 | 3.03±1.5 | 9.53±0.5c | 1.38±0.2c | 8.03±0.6c | 0.11±0.1 | |
| 6 | 0.0 | 2480 | 7.09±0.5 | 0.05±0.1 | 0.00±0.0 | 1.09±0.6 | 0.0±0.0 | 0.36±0.1 | 0.19±0.1 | 0.17±0.1 | 0.00±0.0 |
| 0.5 | 2713 | 2.79±0.2c | 2.01±0.2c | 60.07±4.3c | 11.85±3.9 | 0.0±0.0 | 4.38±0.5c | 1.54±0.1c | 2.77±0.4c | 0.07±0.0 | |
| 1 | 4954 | 2.14±0.1c | 0.38±0.1a | 13.09±3.5c | 3.67±1.9 | 1.84±0.9 | 6.05±0.8c | 1.24±0.2c | 4.73±0.7c | 0.07±0.0 | |
| 2 | 4102 | 1.71±0.2c | 0.37±0.0 | 17.92±2.9 | 4.48±0.7 | 0.0±0.0 | 10.83±0.8c | 4.16±0.3c | 6.57±0.5c | 0.09±0.0 | |
| 4 | 4468 | 1.67±0.0c | 0.36±0.0 | 13.16±0.3 | 5.40±1.5 | 2.49±1.3 | 12.66±1.9c | 5.91±0.7c | 6.59±1.3c | 0.13±0.1 | |
a Significant at p<0.01, b p<0.001 and c p<0.0001as compared to their respective control analyzed with 2×2contingency χ2-test with respective d.f.=1. TCS-total cells scored, TADC=Total abnormal dividing cell, SC=Sticky chromosome, PD=Polar deviation, CB=Chromosomal bridge, TAC-Total abnormal cells, GC-Giant cells, HC-Hyperchromasia, BN=Binucleate cell.
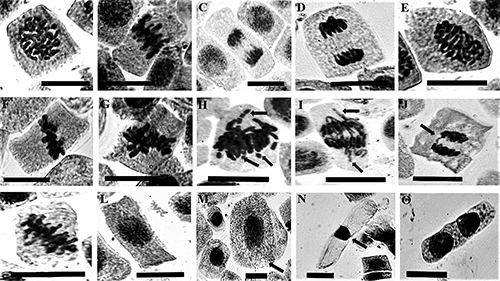
The percentages of chromosomal abnormalities during mitotic phases were found to be decreased with increase in concentrations of LAECA. The highest treatment concentration (4 mg mL−1) of LAECA showed the lower percentages (0.99±0.17, 0.66±0.07, and 0.36±0.03) of mitotic abnormalities respectively at 2, 4, and 6 h (Table 2). The most common abnormalities were stickiness, laggards, chromatid breakages, chromosomal bridges, and polar deviations during different mitotic phases and all of these aberrations are considered as markers of cytotoxicity (Aşkin Çelik and Aslantürk 2010, Barman et al. 2020, Roy et al. 2021) (Fig. 1). Among the various chromosomal abnormalities, the stickiness of chromosomes was found to be the most common, and the maximum percentage (60.07±4.2) was reported from 0.500 mg mL−1 LAECA treatment at 6 h. But with the increase in LAECA concentrations their percentages were reduced whereas a comparatively higher percentages were found at 2 and 4 h. A significant (p≤0.0001) increase in polar deviation was noticed at 2 h. The polar deviations were maximum (20.84±4.1) at 1 mg mL−1 LAECA treatment at 2 h and their frequencies were decreased with increasing time and doses of LAECA. The frequency of chromosomal bridges was comparatively lower than the other previously mentioned chromosomal abnormalities. The maximum percentage (3.03±1.5) of chromosomal bridges was found at 4 mg mL−1 LAECA treatment at 4 h. The stickiness of chromosomes may be the result of excessive elongation of chromatin fibers which causes their improper condensation and can alter the physicochemical properties of nucleic acids, therefore ceasing the normal process of cell division and promoting cell death (Joti et al. 2012, Renjana et al. 2013, Moustafa et al. 2016, El-Ghamery and Mousa 2017). Laggards may appear as a result of irregular chromosomal movements or spindle-poisoning effect (Adam and El-Ashry 2010, Khanna and Sharma 2013, Moustafa et al. 2016). Chromosome bridges are the most common clastogenic effect that is formed either due to the chromosome or chromatid breaks or uneven chromatid exchange during translocation (Radić et al. 2010, Liman et al. 2015). Polar deviation of chromosomes may occur due to the disturbances within spindle fiber and indicates the presence of compounds that can interrupt the process of spindle fiber formation (El-Ghamery and Mousa 2017). In the present study, we found the cytostatic and mitotic abnormality-inducing effects of LAECA. Halili et al. (2019) suggested that plant extracts induced cytological abnormalities indicating their cyto-genotoxic potentials. The other reports suggested that the occurrence of various chromosomal aberrations following treatment with plant extracts refers to their cytotoxicity (Barman et al. 2020, Roy et al. 2021). Therefore, our findings attribute the LAECA may contain phytochemicals having cytostatic and cytotoxic effects. Thus, in traditional medicine, the indiscriminate use of LAECA should be restricted.
The authors express gratitude to Prof. A. Mukherjee, Department of Botany, The University of Burdwan for authenticating the plant species. Authors acknowledge the financial support of The Government of West Bengal as the Swami Vivekananda Scholarship for Ph.D., UGC SRF fellowship, and the DST-PURSE, DST-FIST, UGC MRP, and UGC-DRS-sponsored infrastructural facilities in the Department of Zoology.