Regular Article
Karyomorphological and genome size variation in Iranian endemic populations of coriander (Coriandrum sativum L.)
2024 年 89 巻 1 号 p. 21-27
詳細
2024 年 89 巻 1 号 p. 21-27
Coriandrum sativum L. is an important member of the Apiaceae family. It’s a heliophytic plant and native to the Mediterranean regions and southwestern Asia. This study aimed to investigate variations and clustering of 14 Iranian endemic populations of coriander based on karyomorphological and genome size features. Results showed that all populations were diploid (2n=2x=22), having the mean values for chromosome length (CL) and total chromosome volume (TCV) of 2.56 µm and 2.53 µm3, respectively. Three chromosome types (“m”, “sm”, and “st”) formed nine different karyotype formulas: “sm” appeared to be the major chromosome type in most karyotypes. Karyotypes of all populations were ordered in the 3A and 4A classes of Stebbins classification. Analysis of variance (ANOVA) confirmed significant intraspecific variation in chromosomal parameters, but not in monoploid genome size (2Cx DNA). The overall mean genome size was 4.15 pg, ranging from 4.03 to 4.27 pg. Correlation between the amount of 2Cx DNA with environmental conditions showed that the amount of 2Cx DNA had a positive and significant correlation only with the average annual temperature (r=0.67**). The obtained results from this study may provide relevant information for coriander breeding studies.
Coriander (Coriandrum sativum L.) as an important member of the Apiaceae family is an herbaceous, annual, and allogam plant (Msaada et al. 2007). It’s a heliophytic plant and native to southwestern Asia and the Mediterranean regions (Msaada et al. 2007). Coriander cultivation takes place in many regions in Iran. The therapeutic properties and pharmacological effects of this plant have been proven (Emamghoreishi et al. 2005, Qaiser 2009, Silva et al. 2011). In plant systematics and plant breeding, karyotypes can make available evidence and data for species identification and the study of populations resulting from a cross between individuals (Anjali and Srivastava 2012). Furthermore, in plant sciences, flow cytometry (FCM) is a powerful and reliable technique for screening DNA content for many plants (e.g., Karimzadeh et al. 2011, Tarkesh Esfahani et al. 2020, Abbasi-Karin et al. 2022, Mehravi et al. 2022, Zarabizadeh et al. 2022). In the study on C. sativum, it was found that this plant is diploid with a chromosome number 22 (Baijal and Kaul 1973, Saha 2017). For C. sativum, the estimated genome size was 5.08 pg (Loureiro et al. 2007). Awareness of genetic diversity and the management of genetic resources are considered as the main parts of plant breeding programs; The first step in plant breeding is to understand the genome structure and the germplasm collection (Lee et al. 2021). This study was aimed to investigate variations and clustering of 14 Iranian endemic populations of coriander based on karyomorphological and genome size features.
Root tips were excised from 14 Iranian endemic populations of Coriandrum sativum L. of the living collection originated from diverse places in Iran via Iranian Biological Resource Center (IBRC) as described in Table 1.
| Populations codes | Iranian local collection locations | Latitude (N) | Longitude (E) | Altitude (m) | Mean Temp (°C) | Mean rainfall (mm) |
|---|---|---|---|---|---|---|
| P1 | Mashhad, Khorasan Razavi | 36°16′18.42″ | 59°37′06.76″ | 974 | 22.91 | 5.54 |
| P2 | Tabriz | 38°06′13.56″ | 45°55′45.09″ | 1,292 | 10.50 | 20.80 |
| P3 | Tehran | 35°41′21.11″ | 51°23′20.30″ | 1,160 | 17.74 | 15.08 |
| P4 | Urmia | 37°32′59.30″ | 45°04′43.06″ | 1,349 | 9.80 | 21.32 |
| P5 | Yazd | 32°06′43.40″ | 54°38′23.80″ | 2,158 | 20.42 | 4.32 |
| P6 | Hamedan | 34°47′55.89″ | 48°30′54.08″ | 1,818 | 12.30 | 21.87 |
| P7 | East Azarbaijan | 37°23′21.11” | 46°015′2.20” | 1,478 | 11.45 | 19.72 |
| P8 | Estahbanan, Fars | 29°07′44.79″ | 54°02′08.80″ | 1,738 | 18.44 | 22.32 |
| P9 | Kerman | 30°17′02.18″ | 57°05′00.11″ | 1,760 | 20.00 | 9.04 |
| P10 | Behbahan, Khuzestan | 30°35′28.17″ | 50°14′05.08″ | 445 | 25.30 | 10.5 |
| P11 | Fars | 29°06′15.77″ | 53°02′45.22″ | 1,498 | 20.82 | 15.87 |
| P12 | Markazi, Arak Iran | 34°05′43.28″ | 49°42′04.85″ | 2,227 | 13.69 | 31.83 |
| P13 | Zanjan | 36°40′58.82″ | 48°30′31.40″ | 1,675 | 11.19 | 16.80 |
| P14 | Alborz | 35°59′45.77″ | 50°55′44.13″ | 1,760 | 20.24 | 18.35 |
Chromosome analyses were performed according to Sayadi et al. (2021) except that the root tips were pretreated in 0.02% (w/v) α-bromonaphthalene at 4°C for 5 h. The fixed roots were then hydrolyzed in 1 M HCl at 60°C for 5 min. After chromosome counting, long arm (L) and short arm (S) lengths and chromosome length (CL) were measured. Other measured parameters included arm ratio (AR=L/S), r-value (S/L), centromeric index (CI%=S/CL), The total chromosome volume (TCV=πr2 × CL, r=average radius of chromosome), form percentage of chromosome (F%=S/ΣCL). MicroMeasure 3.3 software (Reeves 2002) was applied for karyotype analysis. To determine the karyotype formula, the method of Levan et al. (1964) was used. Relative length of the shortest chromosome (S%), total form percentage (TF%=ΣS/ΣCL) ×100, dispersion index (DI, the ratio of centromeric gradient [ΣS/ΣCL] ×100) to the coefficient of variation [CV] of chromosome length), difference of range relative length (DRL=RL%max–RL%min) were calculated for karyotype symmetrical evolution. For karyotype asymmetrical evolution, the coefficient of variation of chromosome length (CVCL) and Stebbins asymmetry categories were estimated. Moreover Coefficient of variation of centromeric index (CVCI=standard deviation of CI/mean of CI)×100, asymmetry Index [AI=(CVCL×CVCI)/100]. mean centromeric asymmetry{[∑ni=1(Li−Si)/(Li+Si)/n]×100}, Zarco (1986) indices: intrachromosome asymmetry index (A1) and interchromosome asymmetry index (A2) were measured (Stebbins 1971, Zarco 1986, Watanabe et al. 1999, Paszko 2006).
Flow cytometric analysisFCM analyses were performed according to Sayadi et al. (2022). Solanum lycopersicum cv. Stupicke (2C DNA=1.96 pg) was used as an internal reference standard. A BD FACSCantoTM-KE flow cytometer (BD Biosciences, Bedford, MA, USA), equipped with an argon ion laser (488 nm) was used for the nuclei suspension analysis. Raw data were analyzed via a BD FACSDiva™ software (Mehravi et al. 2022) and the gating of histograms was carried out using Partec FloMax ver. 2.4e. (Partec, Münster, Germany).
Statistical analysesThe experiment was performed with five replications for karyological data and three replications for genome size in a completely randomized design (CRD). The mean value of the G1 peak represents the absolute DNA amount of a sample (Doležel et al. 2003). Normality tests of data and analysis of variance (ANOVA) were performed via the PROC GLM of SAS (SAS Institute Inc. 2009). Fisher’s least significant difference (LSD) was utilized for mean comparisons. The multivariate analysis was performed, using Minitab 17 software.
All the 14 coriander (C. sativum) papulations studied were diploid (2n=2x=22; Fig. 1). Karyotypes of somatic complement and the idiograms of the haploid complement of the studied populations are shown in Figs. 1 and 2, respectively. Mostly, in this family the diploids are more frequent, and the obtained results in the present study agree with previously reported on coriander (Poggio et al. 1994, Asl et al. 2007, Saha 2017). Based on the ANOVA results, among populations for S, L, CL, r-value, F%, AR, CI, and TCV were significant differences (p<0.01; Table 2). Their ranges and means are presented in Table 4. The mean value of CL was determined as 2.56 µm, varied from 2.09 µm (P2) to 3.21 µm (P12). The mean TCV was 2.53 µm3, ranged from 1.83 µm3 (P9) to 4.01 µm3 (P4). The mean CI% of the complement, varied from 0.18% (P3, P7, P10) to 0.31% (P6; Table 5). The symmetry information and karyotype formula are presented in Table 5. Three chromosome types (“m”, “sm”, “st”) formed nine different karyotype formulas, including 22sm (P7, P10, P14), 4m+10sm+8st (P3), 18sm+4st (P2), 10sm+12st (P13), 8sm+14st (P11), 6sm+16st (P4), 4sm+18st (P1, P5, P12), 2sm+20st (P9), and 22st (P6, P8); “sm” appeared to be the major chromosome type in the most karyotypes. This situation shows a degree of symmetry. Generally, karyotypes with more symmetry display earlier stages in the plant’s evolution (Stebbins 1971). The differences in the karyotype formula among the studied populations suggest that changes in chromosome structure such as translocations may have been involved in the variation of the populations (Naranjo 2015). Karyotypes of all populations were ordered in the 3A and 4A classes of Stebbins’ classification (Stebbins 1971). Some have argued and suggested that Stebbins’ classification as a qualitative method is not so strong and less flexible regarding the types of conclusions it can provide (Paszko 2006). Hence, moreover, karyotype symmetry was evaluated via S%, TF%, CVCL, DRL, and DI (Table 5). For TF%, P10 with the maximum value (31.09%) among populations was the most symmetrical and P6 with the lowest value (18.01%) had the minimum symmetry of the karyotype. The higher value for S% represents higher symmetry of a karyotype (Gennur et al. 2011), P4 (S%=47.06%) and P8 (S%=32.46%) had the most symmetric and asymmetrical karyotypes, respectively. The studied P6 with the highest (5.04%) and P13 with the lowest (7.22%) values of DRL contained asymmetrical and symmetrical karyotypes, respectively (Table 5). A1 for P6 was 0.78 which denoted the most asymmetric karyotype and P2, P3, and P10 had the most symmetrical karyotype among all papulations (A1=0.53). According to A2, (P1, P3, P8, P12, and P13) had the most symmetry, and (P6 and P7) had the most asymmetrical karyotypes (Table 5). The high CVCL% indicates karyotype asymmetry (Venora and Conicella 1991). P3 had the highest CVCL% (17%) therefore, this population is asymmetric as compared to another population. The lowest CVCL% (13.3%) belonged to P7 which represents a symmetric karyotype between the examined populations (Table 5). The studied P6 had the lowest (12.74%) and P8 had the highest (59.28%) values of MCA (Table 5). The highest value of AI was identified in P13 (2.45) while P6 demonstrated the lowest value (1.07%). In P11, a high CVCI value indicates the most asymmetric karyotype in this population (Table 5). It can be stated that the genus diversity may have resulted from the structural changes. Some differences in asymmetry indices and karyotype formula between species may have contributed to this diversity (Seijo and Fernández 2003). Multivariate analysis was also performed. In which, the presence of three groups was denoted through cluster analysis (Fig. 3B). The first group included four papulations (P1, P9, P6, P8), the second group comprised four papulations (P4, P5, P11, P12), and the third group included six papulations (P2, P7, P14, P3, P10, P13). Based on the results from principal components analysis (PCA), 82% of the total variation was related to the first two principal components The first two components were projected in a 2-dimensional graph (Fig. 3A). The first component was highly related to r-value (0.98) and F% (0.98), and the second component was related to S (−0.74). Understanding taxon evolution and interrelations is facilitated through the information obtained from karyomorphology (Furo et al. 2020, Sayadi et al. 2021). In the current study, the scatter diagram shows the populations in three groups that exactly match the species arrangement obtained from the principal component analysis. Furthermore, the results noted that populations inside a cluster have the maximum homology of chromosomes. Crossing between populations in a cluster is recommended. Peak 1 on the histograms of nuclear DNA content refers to the G1 of the population samples and peak 2 refers to the G1 of S lycopersicum cv. Stupicke (2C DNA=1.96 pg; Fig. 4). The variation coefficients (CV%) of G1 peaks were less than 5% for coriander populations and S. lycopersicum samples. The overall average genome sizes of those were 4.15 pg, varying from 4.03 pg (P12) to 4.27 pg (P1; Fig. 4). Based on ANOVA (Table 3), there was no significant difference among the coriander populations in terms of monoploid genome size (2Cx DNA), indicating the absence of intraspecific variation in the amount of genomic DNA. It was reported that 2Cx DNA average for C. sativum was 5.08 pg, (Loureiro et al. 2007), while in other studies, this value was 1.7 pg (Tomar et al. 2022). Correlation between the amount of 2Cx DNA with environmental conditions showed the amount of 2Cx DNA had a positive and significant correlation only with the average annual temperature (r=0.67; Table 6). It may be moved in response to environmental stress, suggesting that quick processes exist that are able to change the genome in a few generations even between very closely related organisms (Arnault and Dufournel 1994, Capy et al. 2000, Fablet and Vieira 2011).

Scale bars=5 µm.

| S.O.V. | df | MS | |||||||
|---|---|---|---|---|---|---|---|---|---|
| S | L | CL | AR | r-Value | F% | TCV | CI | ||
| Population | 13 | 12.14** | 21.96** | 18.90** | 22.17** | 22.00** | 0.01ns | 21.21** | 13.20** |
| Error | 756 | 0.80 | 0.63 | 0.68 | 0.63 | 0.63 | 1.01 | 0.64 | 0.78 |
| CV% | 22.41 | 19.92 | 20.73 | 19.87 | 19.92 | 25.16 | 20.12 | 22.16 | |
Significances are indicated: **p<0.01, ns: non-significant p>0.05
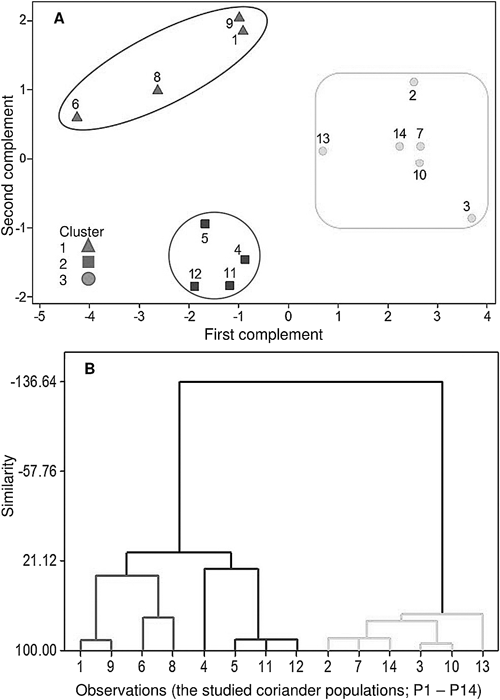
(A) Diagram resulting from principal components analysis (PCA); The first complement was highly related to r-value (0.98) and F% (0.98), and the second was related to S (−0.74) of the complements. (B) Dendrogram showing the phonetic relationships among the studied coriander populations. constructed using the matrix of karyotype similarities with Complete. Cophenetic correlation r=0.84. (P1–P14).

The left peaks refer to G1 of the Solanum lycopersicum cv. Stupicke (2C DNA=1.96 pg) reference standard and the right peaks refer to G1 of the populations. samples.
| S.O.V. | Df | 2Cx DNA |
|---|---|---|
| Population | 13 | 0.190ns |
| Error | 33 | 0.029 |
| CV% | 4.14 |
Significances are indicated: **p<0.01, ns: non-significant p>0.05
| Chromosomal parameters | Mean | Range | Papulations related to the range | |
|---|---|---|---|---|
| High | Low | |||
| S | 0.64 | 0.53–0.74 | P11 | P6 |
| L | 1.92 | 1.44–2.48 | P12 | P2 |
| CL | 2.56 | 2.09–3.21 | P12 | P2 |
| AR | 3.15 | 2.29–4.77 | P6 | P10 |
| r-Value | 0.36 | 0.31–0.47 | P2, P3, P10 | P6, P10, P13 |
| F% | 2.34 | 1.64–2.79 | P2, P7 | P6 |
| TCV | 2.53 | 1.83–4.01 | P4 | P9 |
| CI | 0.26 | 0.18–0.31 | P3, P7, P10 | P6 |
| Pops. | Karyotype symmetry method | DI | CVCL% | DRL% | S% | TF% | MCA | CVCI | AI | |||
|---|---|---|---|---|---|---|---|---|---|---|---|---|
| Zarco (1986) | Stebbins (1971) | Levan et al. (1964) | ||||||||||
| A1 | A2 | |||||||||||
| P1 | 0.68 | 0.17 | 4A | 4sm+18st | 0.01 | 16.93 | 6.47 | 41.86 | 23.34 | 52.93 | 12.35 | 2.09 |
| P2 | 0.53 | 0.15 | 3A | 18sm+4st | 0.02 | 15.33 | 5.70 | 45.99 | 30.65 | 37.14 | 12.05 | 1.85 |
| P3 | 0.53 | 0.17 | 3A | 4m+10sm+8st | 0.02 | 17.00 | 6.38 | 45.28 | 30.71 | 33.82 | 15.00 | 2.55 |
| P4 | 0.68 | 0.14 | 4A | 6sm+16st | 0.02 | 13.83 | 5.55 | 47.06 | 24.07 | 43.16 | 8.61 | 1.19 |
| P5 | 0.69 | 0.16 | 4A | 4sm+18st | 0.01 | 16.25 | 6.29 | 46.89 | 22.97 | 44.51 | 9.82 | 1.60 |
| P6 | 0.78 | 0.13 | 4A | 22st | 0.01 | 16.93 | 5.04 | 39.81 | 18.01 | 12.74 | 8.43 | 1.07 |
| P7 | 0.54 | 0.13 | 3A | 22sm | 0.02 | 13.24 | 5.72 | 50.48 | 30.69 | 32.87 | 8.84 | 1.17 |
| P8 | 0.73 | 0.17 | 4A | 22st | 0.01 | 16.72 | 7.20 | 32.46 | 20.56 | 59.28 | 7.85 | 1.31 |
| P9 | 0.69 | 0.16 | 4A | 2sm+20st | 0.02 | 15.61 | 6.13 | 33.20 | 23.20 | 53.73 | 10.53 | 1.64 |
| P10 | 0.53 | 0.16 | 3A | 22sm | 0.02 | 15.88 | 5.77 | 45.52 | 31.09 | 31.31 | 7.89 | 1.25 |
| P11 | 0.66 | 0.16 | 4A | 8sm+14st | 0.02 | 15.65 | 6.94 | 39.48 | 24.22 | 43.03 | 15.48 | 2.42 |
| P12 | 0.69 | 0.17 | 4A | 4sm+18st | 0.01 | 16.87 | 6.21 | 32.61 | 23.03 | 45.25 | 10.45 | 1.76 |
| P13 | 0.61 | 0.17 | 3A | 10sm+12st | 0.02 | 16.74 | 7.22 | 42.38 | 26.96 | 39.91 | 14.61 | 2.45 |
| P14 | 0.55 | 0.16 | 3A | 22sm | 0.02 | 16.38 | 6.47 | 36.19 | 30.47 | 32.93 | 7.27 | 1.19 |
| Trait | Latitude (N) | Longitude (E) | Altitude (m) | Mean annual temperature (°C) | Mean annual rainfall (mm) |
|---|---|---|---|---|---|
| 2Cx DNA | −0.22ns | 0.49ns | −0.12ns | 0.67** | −0.49ns |
Significances are indicated: **p<0.01, ns: non-significant p>0.05
These results may provide relevant information for coriander breeding studies. To increase the potential applicability of this genus, this annual plant still needs more investigation on the genetic variability, expanding the range of research on its genetic characteristics as well as developing breeding methods.
The authors gratefully acknowledge the support provided for this survey by the Tarbiat Modares University, Tehran, Iran.
Ghasem Karimzadeh verified the methods and supervised the study. Azadeh Khakshour carried out the experiment. Mohammad Sadegh Sabet contributed to the implementation of the research, and to the analysis of the data. Vahid Sayadi verified the data and wrote the manuscript. All authors discussed the results and contributed to the final manuscript.