Abstract
Sweetness and texture are key factors in determining sweet potato quality, but traditional evaluation methods often permanently destroy the product. In this study, we utilized a cost-effective handheld near-infrared (NIR) spectrometer (operating at 900–1,700 nm) to assess Brix and moisture content of yellow-fleshed Japanese sweet potato cultivars grown in Memuro, Hokkaido. Measurements were taken across the growth and storage stages. Spectral data showed that the tip of the sweet potato root showed consistent patterns, making it effective for Brix prediction, with model ratio of prediction to deviation of 2.5.
1. Introduction
Sweet potato (Ipomoea batatas (L.) Lam.) is an important global crop, particularly in warm tropical and subtropical regions, valued for its sweetness, and high starch and nutritional content. In Japan, sweet potatoes are cultivated in the Honshu and Kyushu Islands for starch, alcohol production, confectionery, natural pigments, and direct consumption. Recently, global warming has negatively impacted the quality and yield of both global (Sapakhova et al., 2023) and Japanese sweet potatoes. Consequently, sweet potato cultivation has since expanded into northern regions (Katayama et al., 2017). Fortunately, cultivars that can adapt to cooler conditions have been successfully developed (NARO, 2022) enabling substantial growth during the summer and autumn seasons. As a result, sweet potatoes have become increasingly popular among northern farmers owing to growing nationwide demand, and recent improvements in cultivation practices have led to yields nearly tripling (Hokuren, 2024). In addition, sweet potatoes cultivated in colder regions are generally sweeter and contain less starch than those cultivated in warmer regions (Nakamura, et al., 2014). However, this difference due to climate remains unexplored, with limited research on the quality of sweet potatoes cultivated in colder areas (Ishiguro et al., 2022).
Sweetness and starch content are the key quality indicators (Kitahara et al., 2017) to select cultivars, the harvest time, period to storage, and temperature to storage (Zhang et al., 2002). These indicators can be varied owing to the sugar content in sweet potatoes being higher during storage from starch conversion but eventually decreasing after reaching a maximum level (Katayama et al., 1999). Sweetness is used as an indicator of taste, and starch content as an indicator of texture. However, the measurement of starch content is time consuming and laborious. Consequentially, moisture content is commonly used as simple indicator of starch content (Sakaigaichi et al., 2023). Most traditional methods used to assess sweet potato sugar content, such as high-performance liquid chromatography (HPLC) and juice extraction followed by refractometry, are destructive. Additionally, HPLC is expensive and time-consuming, often requiring specialized equipment, environment and hours of analysis, while refractometry, though faster, still requires sample alteration. Therefore, new, easy, more sustainable and measurable evaluations methods to evaluate sweetness and starch content throughout the growth and storage phases are essential.
Near-infrared (NIR) spectroscopy is a fast, cost-efficient, and accurate technique that has been emphasized in agriculture and food quality research (Manley et al., 2021; Williams et al., 2019). Several research studies that utilized NIR spectroscopy for the evaluation of sweet potato quality have been reported; Kim et al. (2021) successfully created an inline NIR spectroscopy system to estimate starch hydrolysis in sweet potatoes. Amankwaah et al. (2023) developed a calibration model for sugar content in baked sweet potatoes, using spectra from freeze-dried and milled sweet potato roots. The hyperspectral imaging technique is part of NIR spectroscopy and has also gained popularity for its ability to combine visual images with spectral data (Cheng et al., 2025; Ishikawa et al., 2021). With advancements, multiple studies have been conducted on sweet potatoes. Shao et al. (2020) demonstrated that hyperspectral imaging can visually predict the soluble solid content (SSC) of sliced sweet potatoes. Heo et al. (2021) showed that hyperspectral imaging could estimate the moisture content in both steamed and dried purple sweet potatoes. He et al. (2023) reported that hyperspectral imaging can be applied to simultaneously quantify and illustrate the distribution of moisture, ash, and proteins in sweet potatoes. These studies demonstrate that NIR spectroscopy and hyperspectral imaging for quality assessment of sweet potatoes already fulfill the industry needs.
NIR spectroscopy becoming more compact, portable, and user-friendly, has made it suitable for on-farm evaluations (Beć et al., 2022). Recently, machine learning-assisted NIR spectra collected from a pocket-sized NIR spectrometer was reportedly used to quantify the content of cellulose, hemicellulose, lignin, and pectin in sweet potato roots (He et al., 2025), demonstrating the advancements and efficiency achieved in quality analysis of sweet potato and a potential future trend. Similarly, our research on sugar beet has proved the practicality of this approach for assessing Brix in sugar beet using NIR spectra collected by a handheld NIR spectrometer (Aparatana et al., 2025). These findings further support the feasibility of using a handheld NIR device for rapid, non-destructive quality assessment of sweet potatoes.
Therefore, this study focused on developing a rapid method to assess Brix and moisture content of yellow-fleshed Japanese sweet potatoes cultivated in the northern region using samples collected during growth and storage stages, using a commercially available handheld NIR spectrometer alongside a refractometer.
2. Materials and methods
2.1. Sweet potato samples
Yellow-fleshed Japanese sweet potato cultivars, Yukikomachi and Kokei No. 14, were cultivated at the Hokkaido Agricultural Research Center, a part of the National Agricultural and Food Research Organization in Memuro, Hokkaido, Japan. This study involved a growth stage experiment and storage after harvest. The sweet potatoes were transplanted on May 23, 2024. The growth-stage experiment began in mid-September, when sweet potato roots started to develop, and continued until mid-October. All sweet potatoes were harvested on October 8 and were immediately stored without curing. Only undamaged and uninfected roots were selected based on visual inspection and stored in a controlled facility at 15 °C with 90 % relative humidity until December. During this period, experimental procedures were performed weekly in the afternoon. A total of 144 sweet potato roots were obtained: 74 roots of the ‘Yukikomachi’ cultivar and 70 roots of the ‘Kokei No. 14’ cultivar. On the morning of the experiment day, the sweet potato roots were rinsed with tap water to remove any adhering soil and then dried with a towel.
2.2. Acquisition of NIR spectra and spectra correction
An S-G1 spectrometer, a cost-effective handheld device from the InnoSpectra Corporation (Taiwan), was used in this study. The device includes smartphone-compatible software applications that allow for raw sample signals acquisition (Isample), automatic conversion to absorbance spectrum (AS) using Eq. (1), and data storage in .csv format. Iref refers to a white reference signal acquired by scanning white reference provided by same spectrometer company.
|
A
S
=
−
log
(
I
r
e
f
I
s
a
m
p
l
e
)
| (1)
|
The spectrometer dimensions is (82.2 × 66 × 43.5) mm, this palm-sized device weighs 139.6 g and has a detector surface area of (8.5 × 4) mm. Operating over a wavelength range of 900–1700 nm, the spectrometer measured at 228 wavelengths, effectively covering significant regions related to sugar content, such as sucrose at 1,433 nm and glucose at 1,195, 1,385, 1,520, 1,590, and 1,688 nm for the OH stretch 1st overtone (López et al., 2017). The spectrometer operates in Diffuse Reflective mode, configured in a linear (column) setting and utilizes six consecutive scan averages, with exposure times of 0.635 ms and a programmable gain amplifier set to 64, each scan lasting approximately 4 s.
Due to the limitations of the NIR spectrometer and the goal of developing a less invasive method to ensuring sustainable sample use, this study focused on the flesh at the tip of the sweet potato. After trimming with pruning scissors, a flesh flat surface approximately 1 cm in diameter was exposed (Fig. 1 (a)) and then scanned using a handheld NIR spectrometer to collect spectral data for sugar modeling, Then, the sweet potato roots were sliced parallel to a depth of about 2 cm from the scanned surface (Fig. 1 (b)), and the surrounding skin was removed. This entire section was used for Brix measurements and served as a representative sample of the whole sweet potato. However, it should be noted that this study does not infer that a correlation between the tip and other regions (e.g., center or base) exists.

(a)
Sweet potato
A second scan was performed at the center of the freshly cut flesh from the remaining root using a handheld NIR spectrometer. Following the second scan, this segment was used to determine moisture content based on weight, using the same slicing method. In total, 144 sweet potato samples were scanned, producing 144 pieces for Brix measurement. However, only 118 samples were scanned for moisture content, owing to oven capacity constraints, resulting in 118 pieces.
2.3. Brix and moisture content measurements
2.3.1. Brix content measurement
A total of 144 sweet potato samples were manually squeezed to extract juice. Approximately 0.4 mL of this juice was placed directly onto the detector surface of a digital pocket PAL-1 refractometer (ATAGO Co., Ltd., Japan), where the Brix value was quickly determined. Once the analysis was complete, the sample was removed from the refractometer, the detector surface was cleaned with distilled water to reset the measurement to zero, and the surface was dried with tissue. In total, 144 Brix measurements were obtained.
2.3.2. Moisture content measurement
The 118 sweet potato samples were weighed using benchtop scale (AE100S, Mettler-Toledo GmbH, Switzerland) to obtain their initial wet weights, before being placed in an oven at 80 °C for at least 72 h. Subsequently, they were weighed again for dry weight. This resulted in a total of 118 samples from which moisture content calculated using the wet and dry weights.
2.4. Data processing and analysis
MATLAB R2024b (version: R2024b Update 3, MathWorks, Inc., USA), along with the PLS_Toolbox (version 9.5, Eigenvector Research, Inc., USA), was used for data processing and analysis.
2.4.1. Dataset preparation
This study created two datasets: one comprising 144 pairs of raw spectral and Brix data and the other comprising 118 pairs of raw spectral and moisture content data. These datasets were used to analysis and develop regression models to predict the Brix and moisture content using three primary datasets: the mixed both cultivar model and individual cultivar datasets. Each dataset was divided into two subsets: a calibration set and a validation set, with 70 % allocated for calibration and cross-validation and the remaining 30 % allocated for validation. The Venetian blind method was used for cross-validation modeling, utilizing a single split with ten blinds to minimize the risk of overfitting.
Full wavelength datasets were then preprocessed using the standard normal variate (SNV) and multiplicative scatter correction (MSC), and differentiation through the first (D1) and second (D2) orders with the Savitzky–Golay method (SG) (Savitzky et al., 1964). Since this study employed differentiation with SG which typically amplifies scatter-related distortions and increases noise at both the beginning and end of the spectra, the wavelength range was trimmed for high-noise regions at the beginning and end (950–1,650 nm) to minimize the impact of noise amplification. The optimal widths of the SG were selected based on the regression model with the lowest root mean square error of cross-validation (RMSECV). Thus, the study focused on two aspects: full wavelength and cut wavelength (950–1,650 nm). Regression models were fit to both preprocessed full-wavelength and cut-wavelength datasets (first cut and then preprocessed)
Only the optimal model for each category (full wavelength and cut wavelength: both cultivars and individually cultivar) was selected for the tables. Consequently, this study developed 24 regression models of the best possible outcome, computed as two regression methods × two variable sets (Brix and moisture content) × six models (with and without preprocessing).
2.4.2. Multiple linear regression and partial least squares regression
This study used multiple linear regression (MLR) as the main regression analysis technique because of its straightforwardness and speed in application to NIR spectroscopy. To complement MLR, partial least squares (PLS) regression was also utilized. Although more complex, PLS regression offers enhanced accuracy and is generally used when MLR does not perform optimally. These techniques are recognized as essential regression methods in NIR spectroscopy. MLR incorporates an additional procedure known as the stepwise search method, which effectively identifies the best factors or wavelengths by evaluating the highest correlation coefficients. The number of factors was first determined using the minimum RMSECV and then capped at five to prevent overfitting. For PLS regression, model latent variable (LV) was selected based on the minimum RMSECV, capped LV at ten to prevent overfitting. Finally, the ideal of each regression model categories was selected using the ratio of prediction to deviation (RPD), based on William’s RPD interpretation table (Williams, 2014), where values below 1.9 are considered unacceptable, values between 1.9 and 2.5 are acceptable for rough screening, and values exceeding 2.5 are suitable for thorough screening.
3. Results and discussion
3.1. Reference measurements and spectra of sweet potatoes
In growth stage, the Brix value of ‘Yukikomachi’ cultivar gradually increased, as shown in Fig. 2 (a). In contrast, ‘Kokei No. 14’ cultivar experiences a decline in Brix value due to the sweet potato root still expanding. In storage stage, the Brix value in both cultivars significantly increased due to starch conversion into sugar. In the moisture content case, this pattern differed from the Brix content showed in Fig. 2 (b), which increased consistently during the growth stage and then declined over time during storage in both cultivars. However, the differences between the two cultivars during the growth stage cannot be fully explained, as they may be influenced by multiple factors. Even comparisons with yearly data based on multiple quality parameters show inconsistent results (Katayama et al., 1999). Table 1 displays the Brix and moisture content characteristics for the regression modeling of sweet potato samples. Based on 118 paired observations of Brix and moisture content, there is a significant negative correlation between the two variables (r = −0.65, p = 1.18 × 10⁻¹⁵).

(a)
Brix
Table 1
Brix and moisture content values from the upper section of sweet potatoes were used for calibration and validation
| Component |
Indicators |
n
|
Average (%) |
Minimum (%) |
Maximum (%) |
StDev (%) |
| All |
| %Brix |
Calibration set |
102 |
8.4 |
3.1 |
13.7 |
2.6 |
| Validation set |
42 |
8.4 |
4.3 |
12.9 |
2.5 |
| %MC |
Calibration set |
85 |
65.8 |
60.1 |
72.4 |
2.3 |
| Validation set |
33 |
65.7 |
62.2 |
70.6 |
2.0 |
| Yukikomachi |
| % Brix |
Calibration set |
53 |
8.4 |
4.4 |
13.7 |
2.7 |
| Validation set |
21 |
8.6 |
4.1 |
12.9 |
2.7 |
| % MC |
Calibration set |
42 |
65.2 |
60.9 |
72.4 |
2.3 |
| Validation set |
17 |
65.2 |
62.2 |
68.7 |
1.8 |
| Kokei No.14 |
| % Brix |
Calibration set |
49 |
8.2 |
3.1 |
12.2 |
2.5 |
| Validation set |
21 |
8.5 |
4.3 |
11.9 |
2.4 |
| % MC |
Calibration set |
41 |
66.4 |
61.8 |
72.4 |
2.4 |
| Validation set |
18 |
66.4 |
62.1 |
71.6 |
2.6 |
n: number of samples, StDev: standard deviation, MC: moisture content.
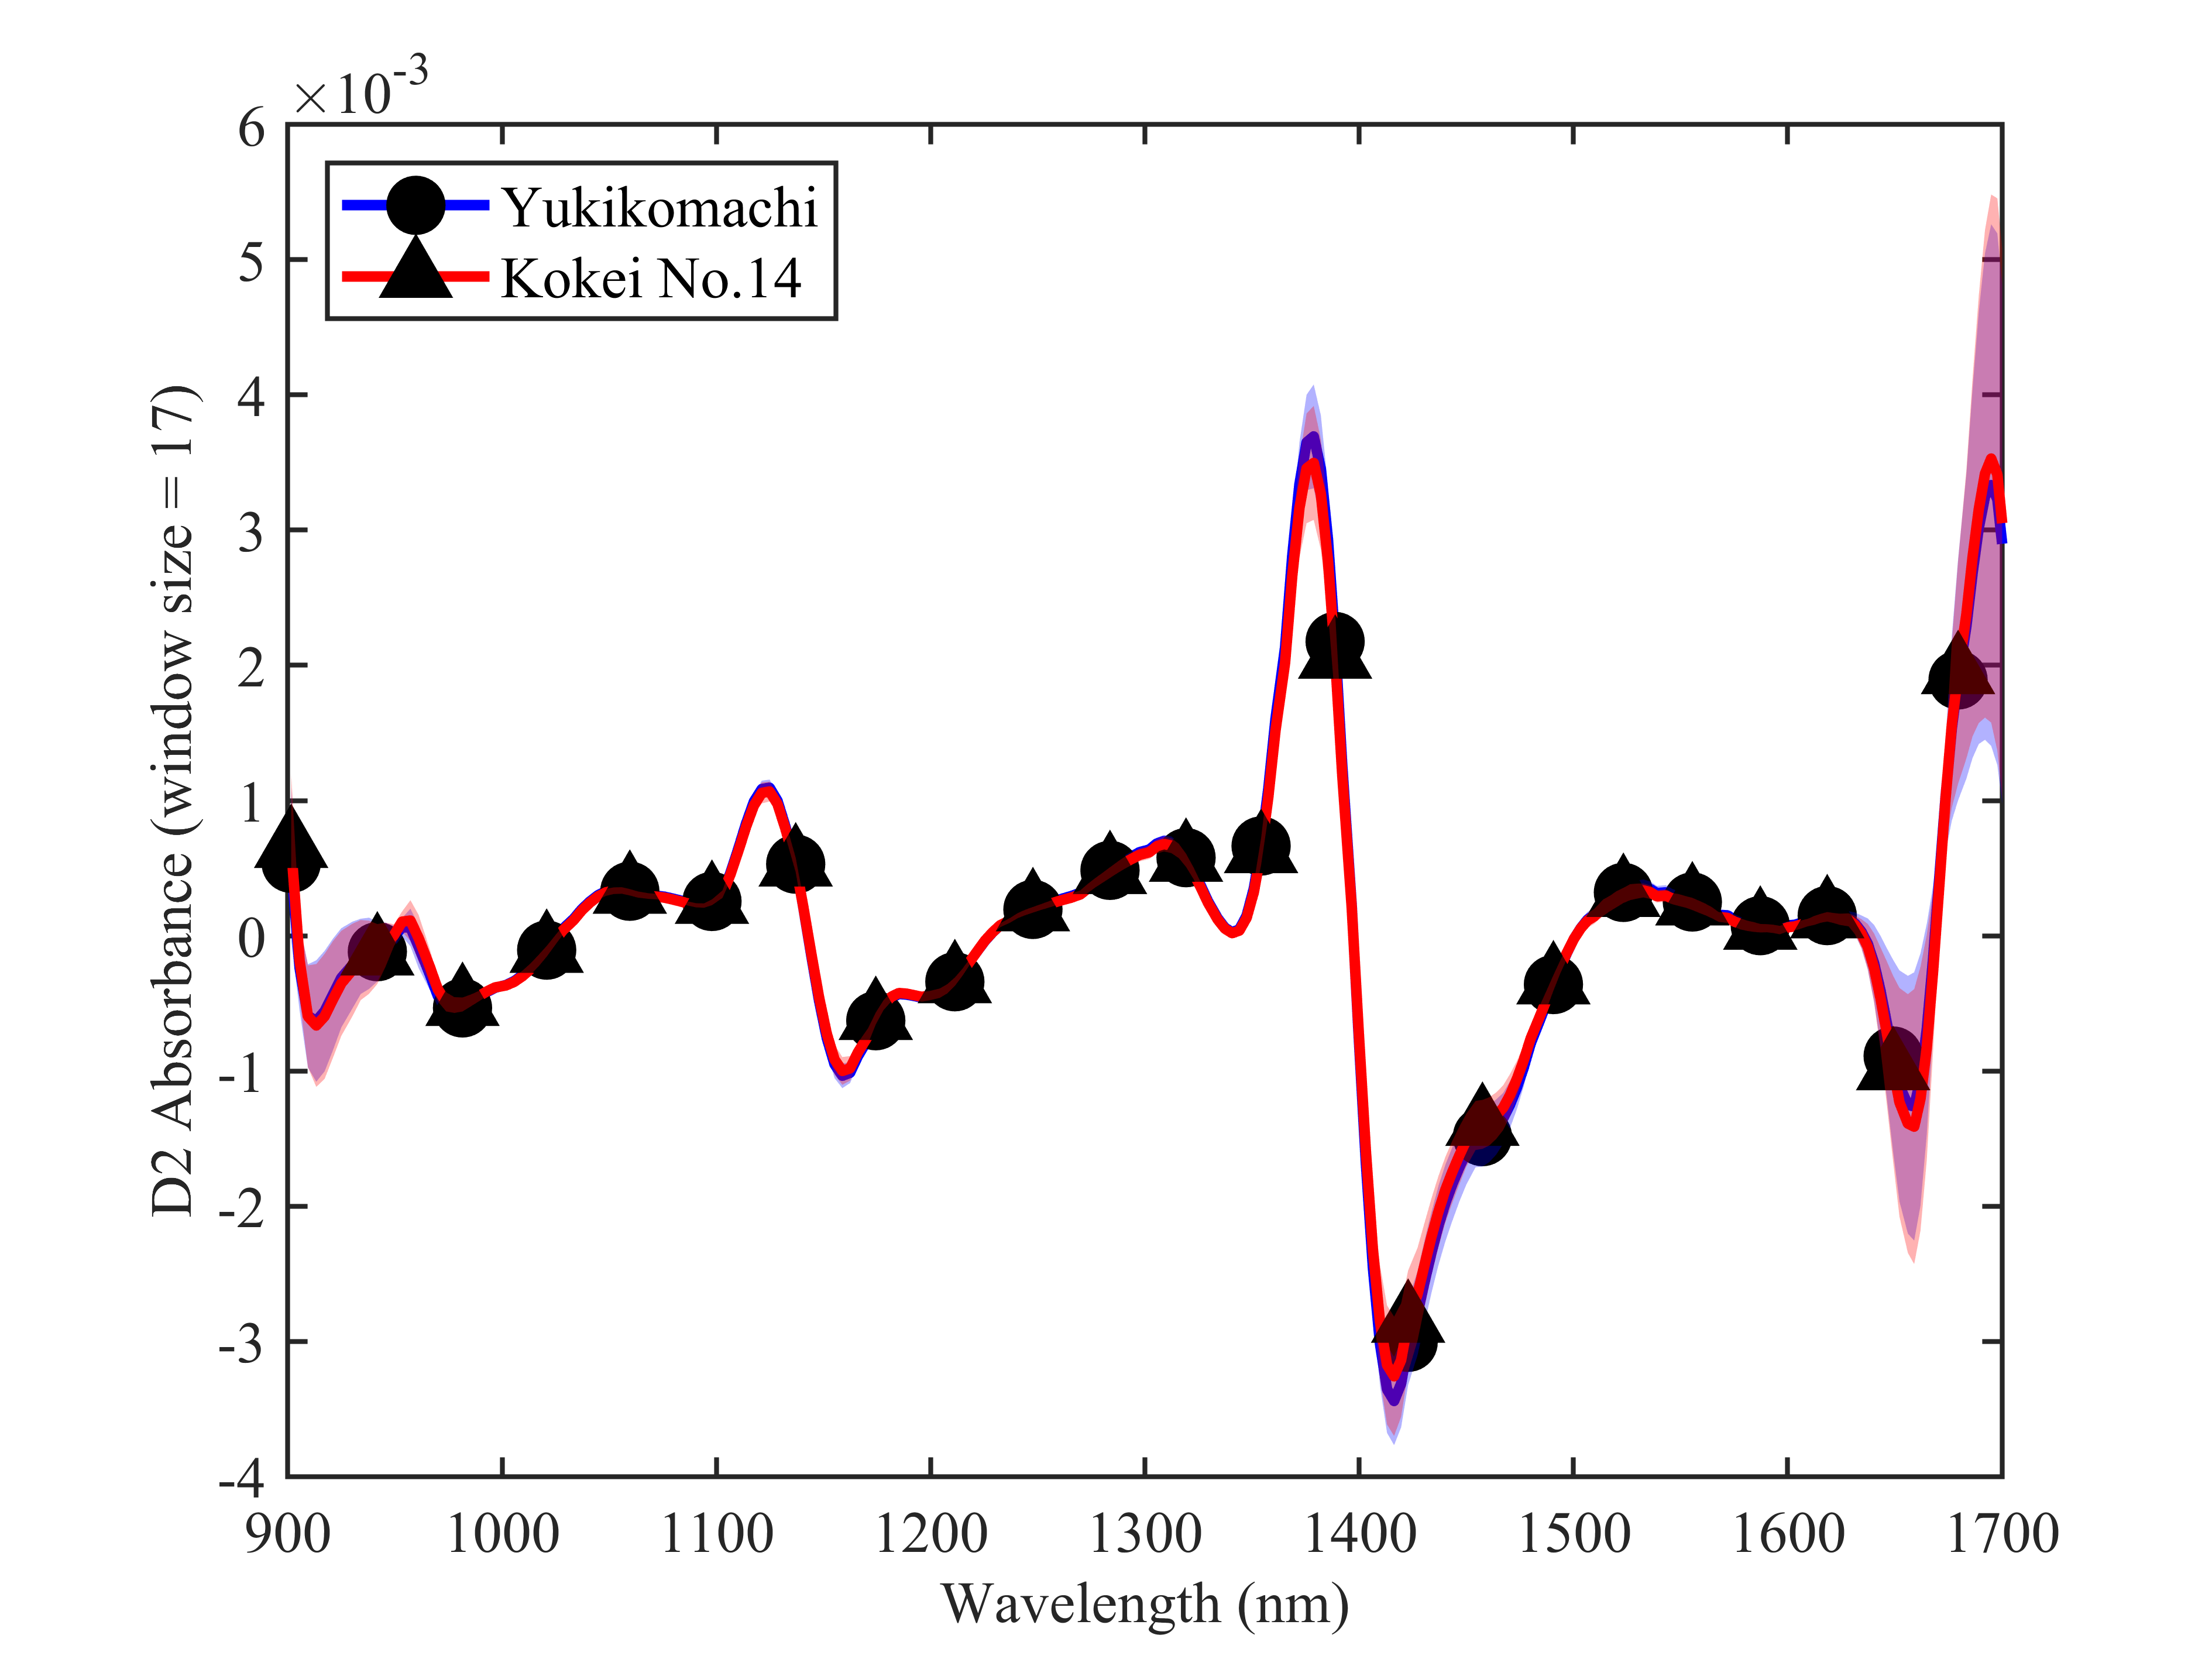
Figures 3 (a) and (b) show the averaged spectra of sweet potato roots from the first and second sections, respectively, in the 900–1,700 nm range, whereas Figs. 3 (c) and (d) shows the D2 averaged spectra within the same range. This analysis showed that the two sweet potato cultivars exhibited nearly identical spectra between 900 and 1,400 nm in the first section. However, the cultivars can be distinguished by their unique profiles, which may be related to sugar or starch content, such as the levels of sucrose, fructose, and glucose observed at the first overtone of OH stretching at approximately 1,400–1,500 nm. The key wavelength for glucose detection was approximately 1,690 nm (López et al., 2017). However, because of the significant noise at both ends of the spectra, as shown in Figs. 3 (a), (b), (c), and (d), caused by the instrument, this should be avoided.

(a)
First section

(b)
Second sectiont
(c)
First section
Specifically, in the second section, the spectral trends varied among cultivars, consistent with the differences observed in the first section (Fig. 3). Although the spectra were derived from the same samples, deeper sections showed greater variation. This may be because the first section had a more condensed vascular system with less varied information, resulting in more uniform spectra. In contrast, the deeper section contains more cellular tissues and encompasses a broader range of information, leading to more diverse spectra. This observation aligns with one of the results reported by Shao et al. (2020), where the predicted SSC distribution map based on spectral analysis across six slices of two sweet potato cultivars revealed greater variation in the middle slices for one cultivar, whereas the other cultivar exhibited a more uniform SSC distribution. Both cultivars, however, shared similarly high SSC in the central areas.
3.2. Regression results
3.2.1. MLR
The results indicated that among all cultivars evaluated using the full wavelength range, the most effective model for predicting Brix was the one without any pre-treatment, yielding an RPD of 2.3, as shown in Table 2. Segregating cultivars during regression model development reduces RMSECV to 1.0 % for ‘Yukikomachi’ without pre-treatment, due to its distinct spectral profile. However, this adjustment does not improve RMSECV for ‘Kokei No. 14,’ indicating cultivar-specific effects that warrant further investigation. Moreover, the model included noise data at 1,680, 1,686, 1,695, and 1,701 nm, which introduces inaccuracies; therefore, we do not recommend using these models.
Table 2
MLR results for predicting Brix in sweet potatoes using spectra from the S-G1 spectrometer
| Model |
Selected wavelengths (nm) |
Rc2
|
RMSEC (%) |
Rcv2
|
RMSECV (%) |
Rp2
|
RMSEP (%) |
Bias (%) |
RPD |
| Full wavelength |
| All |
| Raw |
1,701, 1,382, 1,549, 1,344, 1,403 |
0.82 |
1.1 |
0.79 |
1.2 |
0.80 |
1.1 |
0.17 |
2.3 |
| Yukikomachi |
| Raw |
1,695, 1,382, 1,491, 1,348, 1,204 |
0.89 |
0.9 |
0.87 |
1.0 |
0.84 |
1.0 |
0.14 |
2.6 |
| Kokei No.14 |
| Raw |
1,686, 1,680, 1,464, 1,413, 1,294 |
0.82 |
1.1 |
0.77 |
1.2 |
0.83 |
1.0 |
−0.30 |
2.6 |
| 950–1,650 nm |
| All |
| D2 (11) |
1,141, 953, 1,348, 1,397, 1,649 |
0.84 |
1.1 |
0.82 |
1.1 |
0.76 |
1.2 |
0.21 |
2.1 |
| Yukikomachi |
| D2 (11) |
1,144, 953, 1,103, 1,348, 1,255 |
0.93 |
0.7 |
0.91 |
0.8 |
0.79 |
1.2 |
−0.22 |
2.3 |
| Kokei No.14 |
| D2 (15) |
1,141, 1,593, 1,222 |
0.85 |
1.0 |
0.83 |
1.0 |
0.80 |
1.1 |
−0.19 |
2.3 |
MLR: multiple linear regression, SNV: standard normal variate, MSC: multiplicative scatter correction, D1: first order derivative, D2: second order derivative, Rc2: coefficient of determination for calibration, Rcv2: coefficient of determination for cross-validation, Rp2: coefficient of determination for prediction, RMSEC: root mean square error of calibration, RMSECV: root mean square error of cross-validation, RMSEP: root mean square error of prediction, RPD: ratio of prediction to deviation.
For the cut wavelength and differentiation methods, the results were similar, with minor improvements, even though the model accuracy decreased due to exclusion of the inaccurate region. Nevertheless, these approaches appear more suitable for practical use, based on the observed results. The key wavelength shared by both cultivars for predicting Brix was approximately 1,140 nm, located at second overtone of CH stretching related to sugar (Golic et al., 2003).
For moisture content prediction, the models demonstrated inadequate accuracy; all models had RPD values below 1.9, as shown in Table 3 which is unsatisfactory for moisture content prediction. This low accuracy may stem from the fact that the spectra cannot accurately represent the sample size in the second section, which is deeper in the sweet potatoes and contains more heterogeneous information. This heterogeneity causes substantial variation in moisture content even within the same sample. Furthermore, a handheld NIR spectrometer can only scan a circular area of approximately 1 cm in diameter, limiting coverage. To improve accuracy, multiple scans or dividing the samples into smaller sections before drying for moisture determination would be beneficial. Future studies could also visualize spectral variability in deeper sections to better understand this heterogeneity.
Table 3
MLR results predicting moisture content in sweet potatoes using spectra measured with the S-G1 spectrometer
| Model |
Selected wavelengths (nm) |
Rc2
|
RMSEC (%) |
Rcv2
|
RM SECV (%) |
Rp2
|
RMSEP (%) |
Bias (%) |
RPD |
| Full wavelength |
| All |
| MSC |
1,397, 1,677, 925 |
0.59 |
1.5 |
0.54 |
1.5 |
0.58 |
1.3 |
0.14 |
1.6 |
| Yukikomachi |
| MSC |
1,400, 1,668 |
0.66 |
1.0 |
0.59 |
1.1 |
0.62 |
1.1 |
−0.13 |
1.7 |
| Kokei No.14 |
| SNV |
1,397, 1,677, 934 |
0.63 |
1.4 |
0.56 |
1.5 |
0.67 |
1.4 |
−0.31 |
1.8 |
| 950–1,650 nm |
| Full |
| D2 (15) |
1,148, 1,241 |
0.58 |
1.5 |
0.54 |
1.5 |
0.47 |
1.4 |
0.26 |
1.4 |
| Yukikomachi |
| D2 (17) |
1,144 |
0.63 |
1.1 |
0.60 |
1.1 |
0.53 |
1.2 |
−0.24 |
1.5 |
| Kokei No.14 |
| D2 (11) |
1,144, 1,251, 1,401 |
0.63 |
1.4 |
0.58 |
1.5 |
0.47 |
1.8 |
−0.48 |
1.5 |
n: number of samples, StDev: standard deviation, MC: moisture content.
3.2.2. PLS regression
The full wavelength of the sweet potato spectra models yielded RPD values between 1.8 to 2.2 (Table 4). When using the full wavelength with both cultivars and applying MSC, the prediction of Brix performed poorly, with an RPD of 1.9. Although segregating cultivars during regression model development resulted in an RPD of 2.2 for the ‘Kokai No. 14’ cultivar model, the RMSECV remained unchanged compared to the model combining both cultivars. In contrast, using cut wavelengths and differentiation methods enhanced further the results of the MLR. This approach increased RPD values to between 2.2 and 2.5. Differentiation was significantly beneficial in all cases, as it enhanced characteristic peaks, resulting in an RMSECV of 1.1% for all models. However, when comparing segregated cultivar models with mixed-cultivar models, there was no improvement from segregation when modeling with the PLS regression method. The regression vector of the best model for mixed both cultivars indicated that the key wavelengths for predicting Brix in sweet potato are approximately 1,403, 1,369, 1,488, and 1,621 nm, all located within the OH stretch first overtone region, which is related to sugar content (López et al., 2017), as shown in Fig. 4.
Table 4
PLS regression results for predicting Brix in sweet potatoes using spectra measured with the S-G1 spectrometer
| Model |
LVs |
Rc2
|
RMSEC (%) |
Rcv2
|
RMSECV (%) |
Rp2
|
RMSEP (%) |
Bias (%) |
RPD |
| Full wavelength |
| All |
| MSC |
5 |
0.78 |
1.2 |
0.75 |
1.3 |
0.71 |
1.3 |
0.15 |
1.9 |
| Yukikomachi |
| MSC |
3 |
0.81 |
1.2 |
0.79 |
1.2 |
0.71 |
1.5 |
0.16 |
1.8 |
| Kokei No.14 |
| Raw |
5 |
0.78 |
1.2 |
0.71 |
1.3 |
0.74 |
1.2 |
−0.53 |
2.2 |
| 950–1,650 nm |
| ALL |
| D1 (13) |
7 |
0.87 |
1.0 |
0.82 |
1.1 |
0.84 |
1.0 |
0.17 |
2.5 |
| Yukikomachi |
| D2 (17) |
5 |
0.89 |
0.8 |
0.83 |
1.1 |
0.86 |
1.1 |
−0.01 |
2.5 |
| Kokei No.14 |
| D2 (17) |
6 |
0.92 |
0.7 |
0.80 |
1.1 |
0.81 |
1.1 |
0.02 |
2.2 |
PLS: partial least square, LV: latent variable.

Fig. 4
Regression vector from the mixed-cultivar model in the wavelength range of 950–1,650 nm
For moisture content prediction, the models show that neither the full wavelength nor cut wavelength reaching an RPD of 1.9, as shown in Table 5, suggesting that all models are unsuitable for moisture content prediction and require enhancement, as discussed in the MLR results section.
Table 5
PLS regression results for predicting Brix in sweet potatoes using spectra measured with the S-G1 spectrometer
| Model |
LVs |
Rc2
|
RMSEC (%) |
Rcv2
|
RMSECV (%) |
Rp2
|
RMSEP (%) |
Bias (%) |
RPD |
| Full wavelength |
| All |
| Raw |
5 |
0.61 |
1.4 |
0.52 |
1.6 |
0.58 |
1.3 |
0.35 |
1.6 |
| Yukikomachi |
| MSC |
4 |
0.71 |
1.0 |
0.60 |
1.1 |
0.66 |
1.1 |
−0.25 |
1.7 |
| Kokei No.14 |
| MSC |
4 |
0.59 |
1.5 |
0.45 |
1.7 |
0.64 |
1.6 |
−0.30 |
1.7 |
| 950–1,650 nm |
| All |
| D1 (19) |
4 |
0.58 |
1.5 |
0.51 |
1.6 |
0.54 |
1.3 |
0.24 |
1.5 |
| Yukikomachi |
| SNV |
4 |
0.70 |
1.0 |
0.57 |
1.2 |
0.57 |
1.2 |
−0.41 |
1.6 |
| Kokei No.14 |
| D2 (17) |
4 |
0.57 |
1.5 |
0.45 |
1.7 |
0.65 |
1.5 |
−0.24 |
1.7 |
4. Conclusion
This study demonstrated that the handheld NIR spectrometer was able to rapidly predict Brix in sweet potato cultivated in the northern region using samples collected during growth and storage stages. The best model is PLS regression using cut wavelength spectra (950–1,650 nm) with D1 of the flesh tip of sweet potato root, and is capable of predicting Brix for both cultivars (RPD = 2.5), and shows alternative ways to assess Brix value without wasting the entire of sweet potato root. Unfortunately, this study has been unsuccessful in developing a suitable model for predicting moisture content due to variability in deeper sections of sweet potato roots. Further investigation on spectral or Brix and moisture variability in deeper sections (e.g., the top, middle, and base sections) is required to better understand the heterogeneity, to find correlation between these sections, and expand the reference range to include sucrose, glucose, and fructose, and starch content. Additionally, separate growth and storage stages model should be considered, as it may exhibit distinct spectral characteristics and improve prediction accuracy.
Acknowledgments
The authors thank Mr. Tomohisa Yamada, staff member of NARO, for his help with sweet potato harvesting, as well as the field crop breeding group at the Hokkaido Agricultural Research Center, NARO, for their dedicated maintenance of the field.
Declaration of conflicting interests
The author(s) declared no potential conflicts of interest.
Notes
(URLs on references were accessed on 29 May 2026.)
References
- Amankwaah, V. A. et al. 2023. Development of NIRS calibration curves for sugars in baked sweetpotato. Journal of the Science of Food and Agriculture. 104 (8): 4801–4807. https://doi.org/10.1002/jsfa.12800
- Aparatana, K. et al. 2025. Development and comparison of two handheld near-infrared spectrometer models for rapid Brix prediction in sugar beet. Engineering in Agriculture, Environment and Food. 18 (3): 165–176. https://doi.org/10.37221/eaef.18.3_165
- Beć, K. B. et al. 2022. Miniaturized NIR spectroscopy in food analysis and quality control: promises, challenges, and perspectives. Foods. 11 (10): 1465. https://doi.org/10.3390/foods11101465
- Cheng, M.-F. et al. 2025. Modern trends and recent applications of hyperspectral imaging: a review. Technologies. 13 (5): 170. https://doi.org/10.3390/technologies13050170
- Golic, M. et al. 2003. Short-wavelength near-infrared spectra of sucrose, glucose, and fructose with respect to sugar concentration and temperature. Applied Spectroscopy. 57 (2): 139–145. https://doi.org/10.1366/000370203321535033
- He, H.-J. et al. 2023. Simultaneous quantifying and visualizing moisture, ash and protein distribution in sweet potato [Ipomoea batatas (L.) Lam] by NIR hyperspectral imaging. Food Chemistry: X. 18: 100631. https://doi.org/10.1016/j.fochx.2023.100631
- He, H.-J. et al. 2025. Machine learning-driven pocket-sized NIR analysis for non-invasive quantification of cellulose, hemicellulose, lignin and pectin in sweet potato roots. LWT. 226: 117973. https://doi.org/10.1016/j.lwt.2025.117973
- Heo, S. et al. 2021. Prediction of moisture content in steamed and dried purple sweet potato using hyperspectral imaging analysis. Food Science and Biotechnology. 30: 783–791. https://doi.org/10.1007/s10068-021-00921-z
- Hokuren. 2024. Sweet potato production trends in Hokkaido. Yomiuri Shimbun. November 18, 2024. Japan: The Yomiuri Shimbun Holdings. (In Japanese). https://www.yomiuri.co.jp/economy/20241118-OYT1T50024/
- Ishiguro, K. et al. 2022. Comparison of anthocyanin and polyphenolics in purple sweetpotato (Ipomoea batatas Lam.) grown in different locations in Japan. Plant Production Science 25 (1): 84–94. https://doi.org/10.1080/1343943X.2021.1963292
- Ishikawa, D. et al. 2021. NIR imaging. In Near-infrared spectroscopy, eds. Y. Ozaki et al. 517–551. Singapore: Springer. https://doi.org/10.1007/978-981-15-8648-4_22
- Katayama, K. et al. 1999. Maturing period of sweet potato cultivars estimated by the changes in quality of storage root. Japan Journal of Crop Science. 68 (2): 224–230. (In Japanese.) https://doi.org/10.1626/jcs.68.224
- Katayama, K. et al. 2017. Recent progress in sweetpotato breeding and cultivars for diverse applications in Japan. Breeding Science. 67 (1): 3–14. https://doi.org/10.1270/jsbbs.16129
- Kim, D.-S. et al. 2021. Estimation of starch hydrolysis in sweet potato (Beni Haruka) based on storage period using nondestructive near-infrared spectrometry. Agriculture. 11 (2): 135. https://doi.org/10.3390/agriculture11020135
- Kitahara, K. et al. 2017. Carbohydrate components in sweetpotato storage roots: their diversities and genetic improvement. Breeding Science. 67 (1): 62–72. https://doi.org/10.1270/jsbbs.16135
- López, M. G. et al. 2017. Carbohydrate analysis by NIRS-chemometricst. In evelopments in near-infrared spectroscopy, eds. K. G. Kyprianidis et al. UK: IntechOpen Ltd. https://doi.org/10.5772/67208
- Manley, M. et al. 2021. Applications: food science. In Near-infrared spectroscopy, eds. Y. Ozaki et al. 347–359. Singapore: Springer. https://doi.org/10.1007/978-981-15-8648-4_15
- Nakamura, Y. et al. 2014. The effects of β-amylase activity and starch pasting temperature on maltose generation in steamed storage roots of sweet potato. Nippon Shokuhin Kagaku Kogaku Kaishi. 61 (12): 577–585. (In Japanese.) https://doi.org/10.3136/nskkk.61.577
- National Agriculture and Food Research Organization (NARO). 2022. A new soft and flaky delicious sweet potato cultivar “Yukikomachi”, harvestable even in cool regions. Japan: NARO. https://www.naro.go.jp/english/laboratory/carc/press/yukikomachi/index.html
- Sakaigaichi, T. et al. 2023. Comparison of root dry matter content and root dry matter weight in sweet potato genotypes cultivated by transplanting and direct planting. Plant Production Science. 26 (4): 440–447. https://doi.org/10.1080/1343943X.2023.2284977
- Sapakhova, Z. et al. 2023. Sweet potato as a key crop for food security under the conditions of global climate change: a review. Plants. 12 (13): 2516. https://doi.org/10.3390/plants12132516
- Savitzky, A. et al. 1964. Smoothing and differentiation of data by simplified least squares procedures. Analytical Chemistry. 36 (8): 1627–1639. https://doi.org/10.1021/ac60214a047
- Shao, Y. et al. 2020. Application of hyperspectral imaging for spatial prediction of soluble solid content in sweet potato. RSC Advances. 10: 33148–33154. https://doi.org/10.1039/C9RA10630H
- Williams, P. 2014. The RPD statistic: a tutorial note. NIR News. 25 (1): 22–26. https://doi.org/10.1255/nirn.1419
- Williams, P.. et al. 2019. Near-infrared technology (1st ed). South Africa: AFRICAN SUN MeDIA. https://doi.org/10.18820/9781928480310
- Zhang, Z. et al. 2002. Biochemical changes during storage of sweet potato roots differing in dry matter content. Postharvest Biology and Technology. 24 (3): 317–325. https://doi.org/10.1016/S0925-5214(01)00149-1



