Abstract
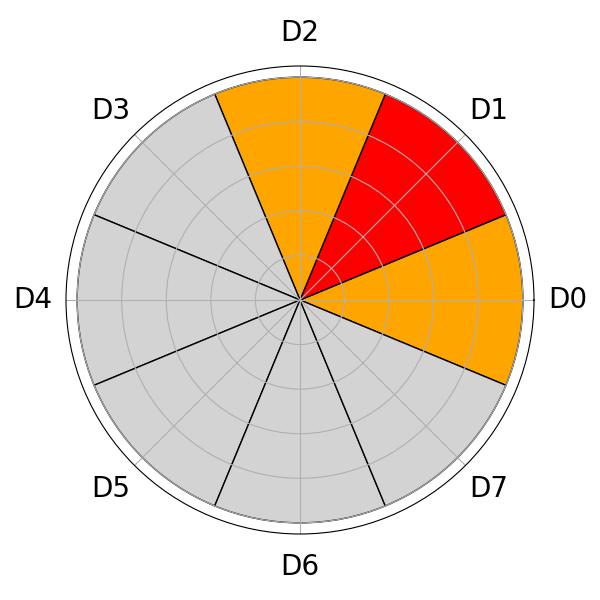
Lodging is a major obstacle to autonomous harvesting. As a first step toward lodging-aware harvesting, this study presents a method based on unmanned aerial vehicles (UAVs) for detecting rice lodging directions. UAV orthomosaics are divided into tiles and classified into eight directions using pretrained convolutional neural network classifiers. On a mixed-field dataset, the method achieved an overall accuracy of approximately 0.85 and a soft accuracy (allowing for classification into adjacent classes) of over 0.97. On separate-field datasets, overall accuracy decreased to approximately 0.78–0.82 due to spatial domain differences, whereas soft accuracy remained above 0.95. Most misclassifications occurred in adjacent direction classes, indicating practical reliability. The resulting lodging direction maps can be used to plan efficient harvesting paths in lodged fields.
1. Introduction
Combine harvesters with autonomous rice harvesting systems have been actively developed in recent years. These systems can harvest rice within predefined field areas using navigation based on global navigation satellite systems. However, their performance is often limited under complex field conditions. A critical challenge for such systems is rice lodging, which is typically caused by external forces, such as strong winds and heavy rainfall, especially during typhoons. Lodging significantly increases grain loss and the risk of header clogging during harvesting. Therefore, fully autonomous harvesting in lodged fields remains difficult and often requires human intervention. Human operators commonly slow the combine harvester down and adjust the header height to adapt to lodging conditions. In particular, a crop-lifting device is often mounted on the divider of a head-feeding combine harvester for severe lodging. This lifting system works most effectively when lodging faces the front or lateral (right or left) side of the harvester, whereas its effect becomes limited when lodging faces its rear. Operators visually assess the lodging direction and location and choose harvesting paths that allow the harvester to approach crops bent toward the front or sides of the harvester. Such visual assessment requires considerable skill and experience.
Researchers have attempted to detect lodging conditions using cameras mounted on combine harvesters, enabling real-time estimation of lodging directions (Masuda et al., 2012; Zhang et al., 2023). Primarily designed to detect lodging directions only in the forward field of view during operation, these techniques suit local, real-time adjustments, such as speed and mechanism control. As they are limited to reactive responses, they focus on adapting to unavoidable lodging conditions rather than strategically avoiding unfavorable ones.
Remote sensing approaches using RGB (Su et al., 2022), multispectral (Kumar et al., 2024), and thermal infrared cameras (Liu et al., 2018) mounted on unmanned aerial vehicles (UAVs) and methods based on satellite remote sensing data (Guo et al., 2023) have also been proposed to detect the extent and location of lodging before harvesting. These studies primarily target field monitoring for farm management and disaster damage assessment; they do not consider the lodging direction, which is crucial for optimizing harvesting strategies in lodged fields.
To address these research gaps, we propose an approach to autonomous rice harvesting that incorporates lodging directions into field-scale planning. Our framework consists of two main steps: (1) generating a lodging direction map using orthomosaics created from UAV-captured imagery and (2) generating field-scale harvesting paths that consider lodging directions based on the map.
This study focuses on the first step—generating a lodging direction map. The aforementioned orthomosaics are divided into tiles, and a convolutional neural network (CNN) is used to classify the lodging direction within each tile. This study is the first to evaluate lodging directions at the field scale using UAV-based imagery, thereby connecting remote sensing observations to autonomous harvesting.
2. Materials and methods
2.1. Data collection
Aerial imagery was collected from two commercial rice fields located in Obama City, Fukui Prefecture, Japan (Fig. 1). These fields were selected due to the visibility of lodging after crop maturation, providing a practical opportunity to capture lodging patterns under real-world agricultural conditions. The rice variety cultivated in these fields is Akisakari, a japonica cultivar commonly grown in the Fukui region.
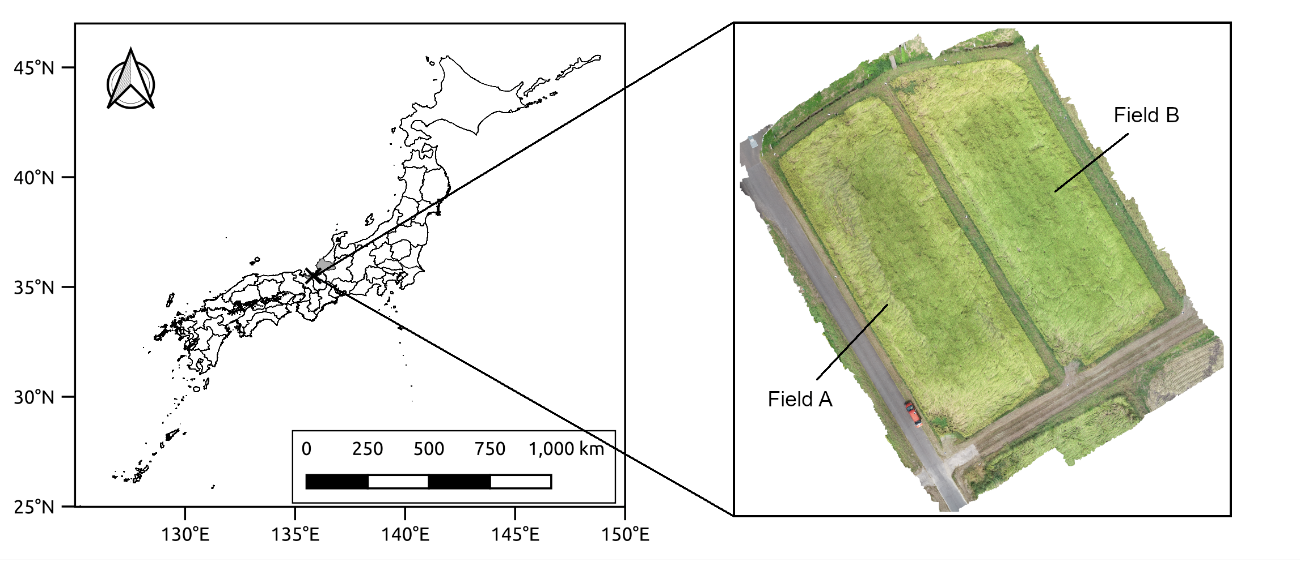
Fig. 1
Location and aerial view of experimental fields
UAV-based aerial imaging was conducted on September 25, 2024, between 11:00 a.m. and 3:00 p.m. under clear weather conditions. The two surveyed fields covered a total area of approximately 0.4 ha.
We used a Phantom 4 Pro UAV (WM331A, DJI Co. Ltd., China), which has a built-in RGB camera (resolution: [5472 × 3648] pixels; focal length: 8.8 mm). Automated flights were conducted using PIX4Dcapture Pro (version 1.4.0, Pix4D S. A., Switzerland), which allows for consistent control of flight altitude and image overlap settings. The UAV flight altitude and speed were 15 m and 1.1–1.6 m/s, respectively. The front and side overlaps were set to 80 % and 70 %, respectively. These parameters resulted in a ground sampling distance (GSD) of 0.41 cm/pixel, ensuring a sufficient spatial resolution for visually identifying lodging patterns.
Orthomosaics were generated by processing the captured images using OpenDroneMap (version 3.5.4) under its default settings, with the 0.41 cm/pixel GSD added as a specification to match the imaging resolution. The resulting orthomosaics were exported in TIFF format and then used to construct a lodging classification dataset (Section 2.2.).
2.2. Dataset construction
Based on the generated orthomosaics, we constructed a dataset for training and evaluating lodging direction classification. The overall procedure included geometric alignment, grid tiling, visual labeling, and data augmentation.
First, each orthomosaic was roughly rotated such that its vertical axis approximately aligned with the direction of the planting rows, which corresponds to the typical harvesting direction. Although this alignment was not directly relevant to the primary objective of this study—lodging direction classification—it was performed in preparation for a subsequent study in which the generated lodging direction map will be utilized for harvesting path planning.
After alignment, the orthomosaics were divided into square tiles measuring (146 × 146) pixels. Given the GSD of 0.41 cm/pixel, each tile corresponded to an area sized approximately (60 × 60) cm on the ground. In the experimental fields, rice was planted at a 30 cm row spacing and a 20 cm hill spacing; thus, each tile contained approximately six rice hills. This spatial unit was selected to ensure that the lodging patterns within each tile could be reliably interpreted through visual inspection for efficient, accurate manual annotation.
Each tile was visually inspected and manually labeled as one of eight lodging direction classes (Fig. 2): the four primary directions relevant to harvesting operations (front, rear, right, and left) and the four intermediate directions for ambiguous angles (those that lie between the primary directions). This eight-direction scheme was designed to maintain a sufficient angular resolution for downstream applications (e.g., path planning). For tiles showing multiple lodging directions, the label was assigned according to the direction occupying the largest visible area. Tiles containing only upright (not lodged) or mildly lodged rice plants were excluded from the dataset. This decision was made for two main reasons. (1) This study primarily aims to estimate lodging directions for harvesting applications. In practical operations, upright or mildly lodged rice plants can be harvested effectively by existing hardware mechanisms and thus do not require direction estimation. We focus on severe lodging conditions, which cannot be handled by hardware alone and under which lodging direction plays a critical role in harvesting performance. (2) The collected data contained few tiles with upright or mildly lodged plants, in which case establishing a separate class and reliably classifying lodging severity would have been impractical. Additionally, tiles located outside cultivated areas were excluded, such as those near field boundaries or regions heavily covered with weeds. These areas fall outside the scope of this study, which aims to classify the lodging directions of rice plants within managed agricultural fields, and often have insufficient visual cues for determining lodging directions. Including such ambiguous samples could introduce noise into the training process and degrade model performance. A well-defined dataset of labeled tiles was constructed through this annotation process, providing a solid foundation for the subsequent training and evaluation of the classification model.
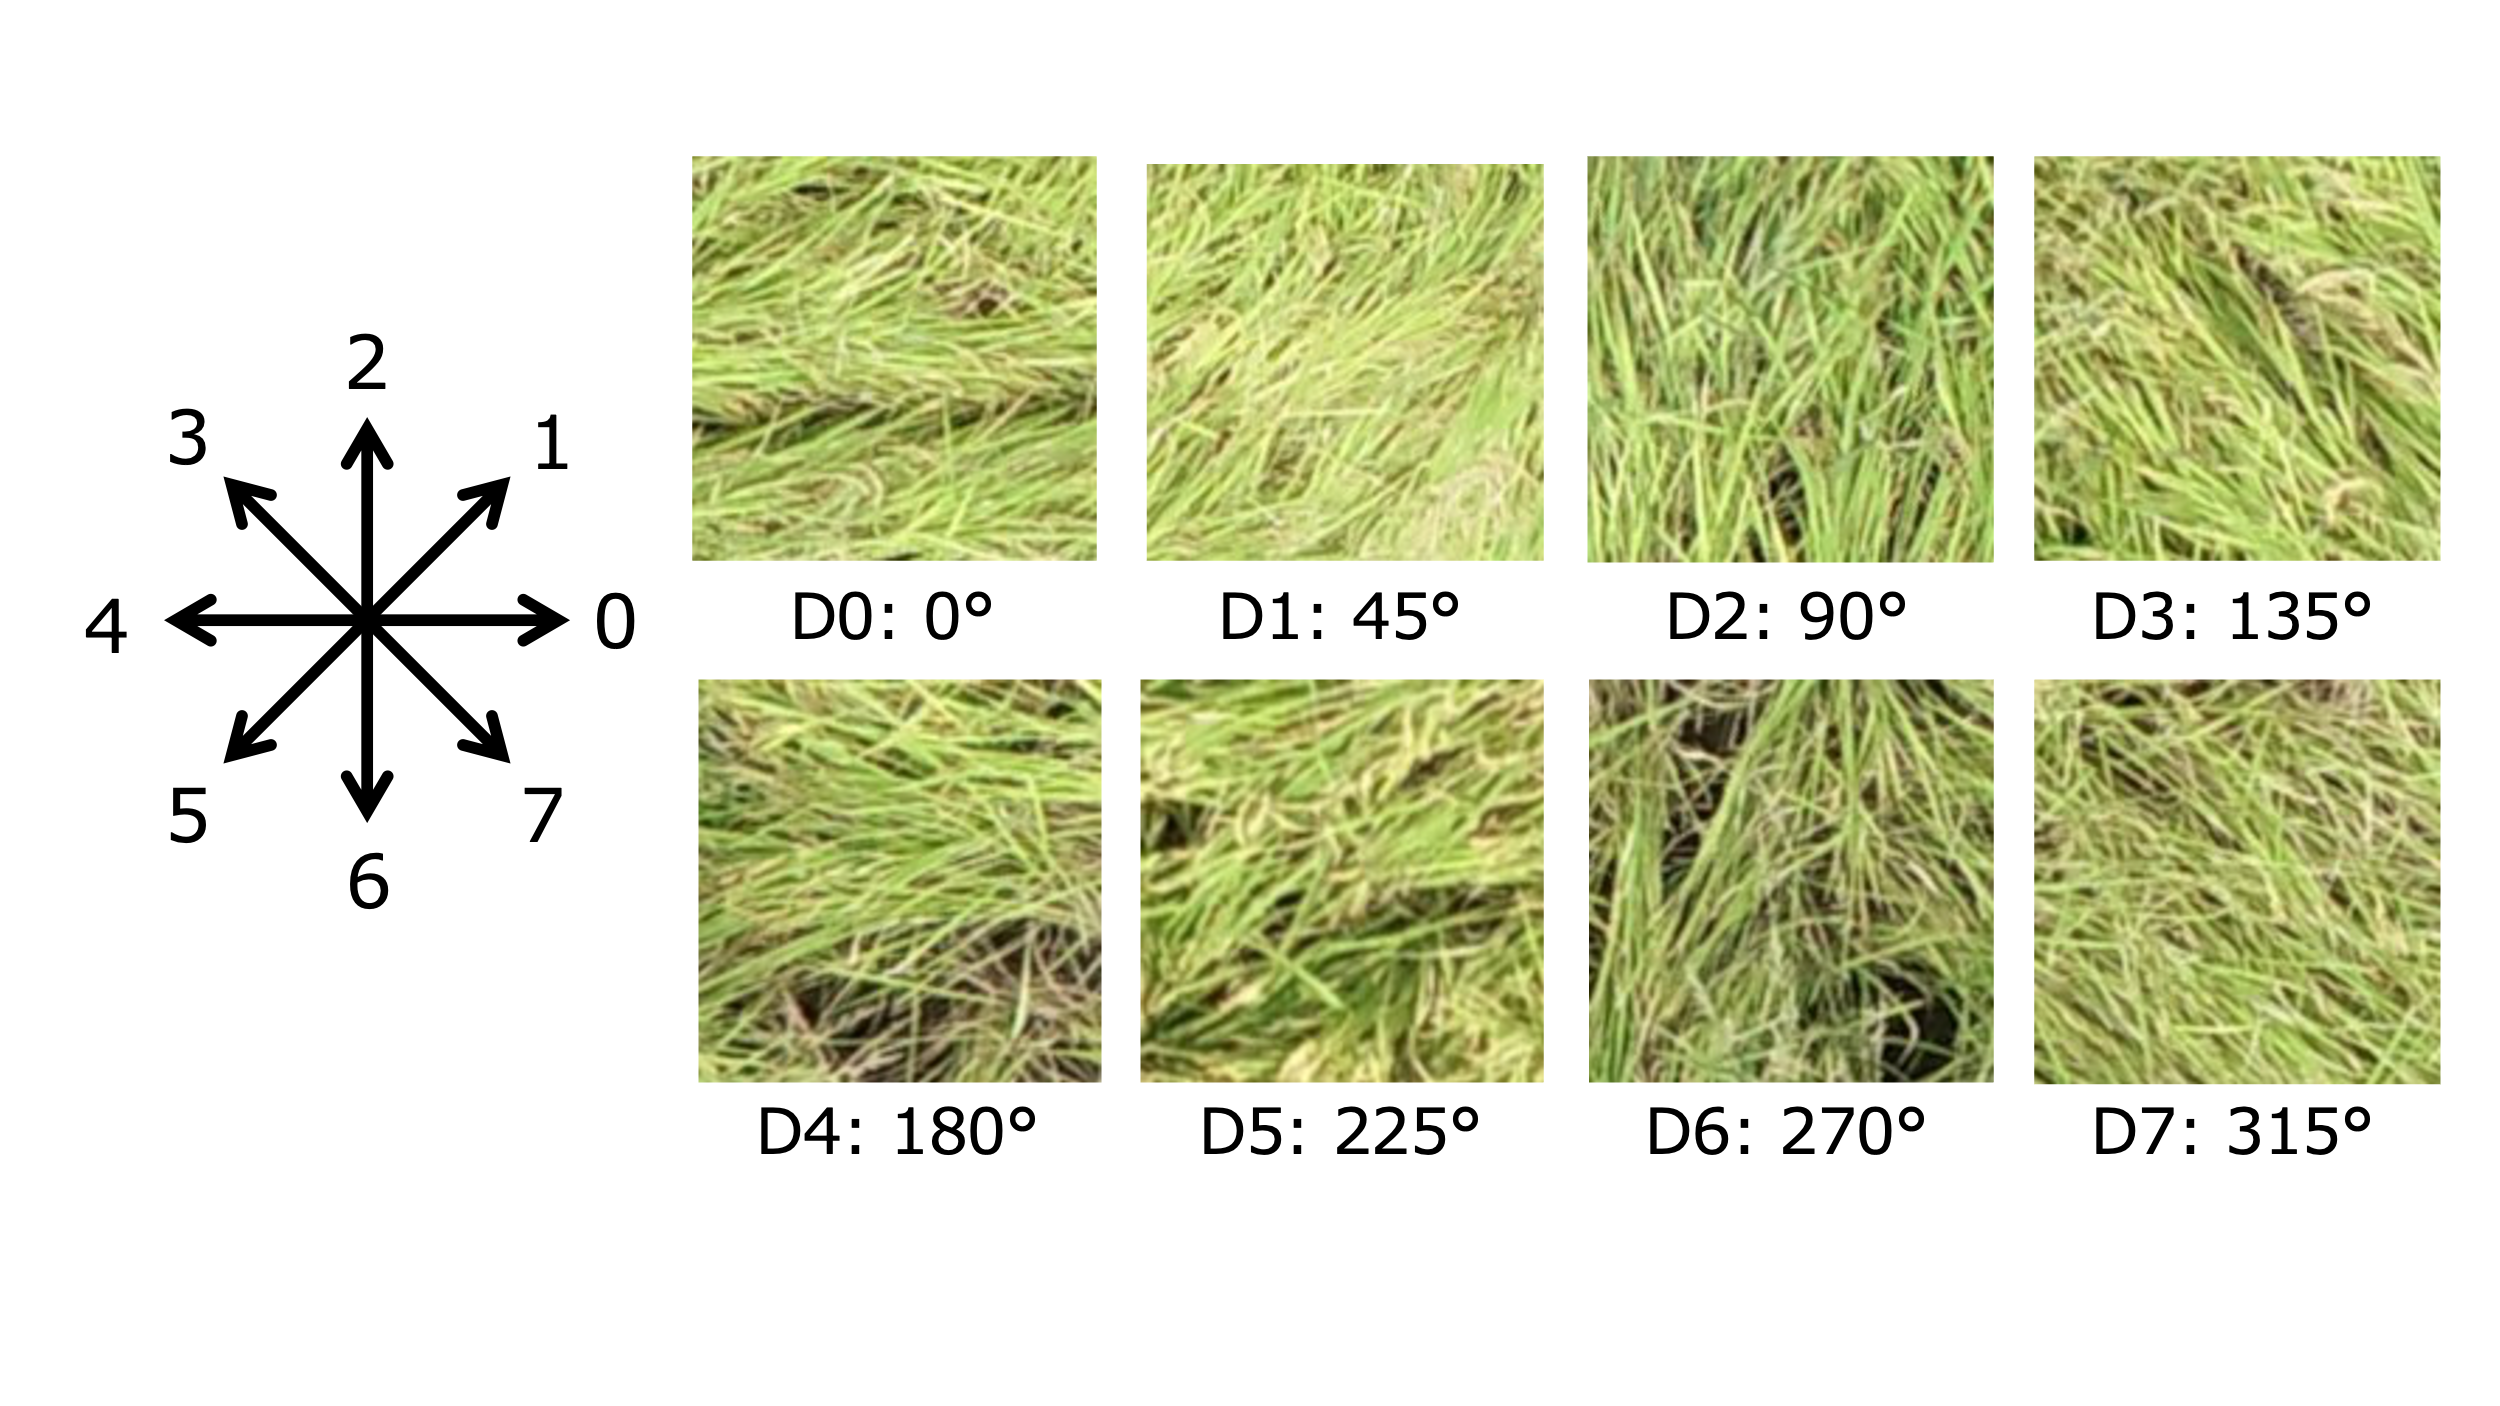
Fig. 2
Lodging direction classes (D0–D7) and corresponding tile samples
Three datasets of two types were constructed using the labeled tiles to evaluate model performance: a mixed-field dataset (Dataset 1) and two separate-field datasets (Datasets 2-a and 2-b). Dataset 1 consisted of tiles from Fields A and B and then divided at a ratio of 8:1:1 into the training, validation, and test subsets. Dataset 2-a was constructed by using all tiles from Field A and dividing them at a ratio of 8:2 into the training and validation subsets; all tiles from Field B comprised the test subset. Dataset 2-b was constructed in the opposite manner, with all tiles from Field A being assigned to the test subset and all tiles from Field B being divided at a ratio of 8:2 into the training and validation subsets.
Rotation-based data augmentation was applied separately to each subset to improve robustness to directional variation and enhance generalization. Specifically, each tile in the training, validation, and test sets was augmented by rotating it by 90°, 180°, and 270°, resulting in three additional versions per original image. Because rotation altered the apparent lodging direction, each augmented tile was relabeled according to the new direction. In our dataset, each orthophoto was arbitrarily rotated during preprocessing, meaning the lodging direction was defined relative to the image coordinate system rather than an absolute geographic reference. Therefore, tile rotation meaningfully changed the lodging direction instead of merely duplicating a sample. This ensured that rotation-based augmentation, even when applied to the test set, would not compromise the independence of the evaluation data or the semantic integrity of classification. No data leakage occurred between subsets because augmentation was performed after dataset splitting and each augmented sample differed visually and semantically from the original.
Undersampling was applied after data augmentation to mitigate class imbalance by reducing the number of tiles in every lodging direction class to match the size of the smallest one, thus preventing overfitting to more frequent classes.
2.3. CNN model training
The models were trained using the annotated datasets (Section 2.2.), which consisted of eight lodging direction classes. The numbers of tiles in the data subsets are summarized in Table 1.
Table 1
Dataset composition
| Dataset |
Training |
Validation |
Test |
| 1 |
2,894 × 8 |
360 × 8 |
366 × 8 |
| 2-a |
1,103 × 8 |
274 × 8 |
2,243 × 8 |
| 2-b |
1,794 × 8 |
447 × 8 |
1,377 × 8 |
We evaluated the effectiveness of eight widely used CNN architectures in lodging direction classification: VGG16, VGG19 (Simonyan et al., 2015), ResNet18, ResNet34, ResNet50, ResNet101 (He et al., 2016), MobileNetV3-Large (Howard et al., 2019), and EfficientNet-B0 (Tan et al., 2019). All models were trained using transfer learning to accelerate convergence and improve training efficiency; weights pretrained on the ImageNet dataset were fine-tuned on our lodging direction dataset. All implementations were conducted using the PyTorch 2.5.1 framework.
The computational environments for training and evaluation are described in Table 2. Training was performed on a multi-GPU workstation, and model inference was conducted separately on a desktop PC, reflecting the practical usage scenario assumed in this study. These environments included Python 3.10, CUDA 12.4, and cuDNN 9.1.0 running on a Docker-based Ubuntu 22.04 system with GPU acceleration. Reproducibility was ensured by fixing random seeds across Python, NumPy, and PyTorch and enforcing deterministic behavior in cuDNN.
Table 2
Computational environment
| Hardware |
Training environment |
Test environment |
| CPU |
Intel Xeon Silver 4210R |
13th Gen Intel Core i9-13900KF |
| RAM |
96 GB |
64 GB |
| GPU |
NVIDIA GeForce RTX 3090 × 4 |
NVIDIA GeForce RTX 4070 |
| VRAM (total) |
96 GB |
12 GB |
| Docker environment |
| OS |
Ubuntu 22.04 |
| CUDA |
12.4 |
| cuDNN |
9.1.0 |
| Language |
Python 3.10 |
| Framework |
PyTorch 2.5.1 |
Each tile was resized to (224 × 224) pixels before training to match the input size requirements of the CNN architectures. The images were converted into tensors and normalized by applying the ImageNet mean and standard deviation values to each of the RGB channels: 0.485, 0.456, and 0.406 for the mean and 0.229, 0.224, and 0.225 for the standard deviation. Preprocessing was applied consistently across all model configurations, both randomly initialized and pretrained networks, for fair, reproducible comparisons.
All models were trained using the cross-entropy loss function, which is appropriate for multiclass classification. Training was conducted for 200 epochs with a batch size of 256. The initial learning rate was set to 1.0 × 10⁻⁵ and optimization was performed using AdamW (Loshchilov et al., 2019) with a weight decay of 1.0 × 10⁻². A step decay learning rate schedule was adopted, where the learning rate was multiplied by 0.8 every 10 epochs. Early stopping was applied such that the training process terminated when the validation loss did not improve over 30 consecutive epochs, thus avoiding unnecessary computations and reducing the training time. Then, the model with the lowest validation loss during training was retained to prevent overfitting (Table 3).
Table 3
Hyperparameters
| Hyperparameter |
Value |
| Optimizer |
AdamW |
| Weight decay |
1.0 × 10⁻²
|
| Loss function |
CrossEntropyLoss |
| Initial learning rate |
1.0 × 10⁻⁵
|
| Learning rate scheduler |
StepLR
(step size = 10, gamma = 0.8)
|
| Batch size |
256 |
| Number of epochs |
200 |
| Random seed |
42 |
| Early stopping patience |
30 |
| Model checkpointing |
Enabled (minimum validation loss) |
2.4. Evaluation metrics
To evaluate lodging direction classification, we adopted accuracy and soft accuracy as evaluation metrics, each computed at the overall and class levels.
Let C ∈
ℕ
K×K be a confusion matrix, where Ci,j is the number of test samples with a ground-truth class i predicted as class j, K = 8 is the number of lodging direction classes, and N is the total number of test samples.
Accuracy is the rate of correct predictions, as below.
|
Accuracy (overall)
=
1
N
∑
i
=
0
K
−
1
𝐂
i
,
i
| (1) |
|
Accuracy (class
i
)
=
𝐂
i
,
i
∑
j
=
0
K
−
1
𝐂
i
,
j
| (2) |
Soft accuracy, as defined in this study, counted a prediction as correct if it fell within a tolerance of ±1 class in the circular direction space (Fig. 3). This relaxed criterion accounted for the inherent ambiguity in the visual assessment of lodging directions, especially near the boundaries between adjacent classes. Because the lodging direction was discretized into eight angular bins, a prediction deviating slightly from the ground truth may still be visually reasonable and practically acceptable. For a ground-truth class
i
, the set of acceptable predictions is as below.
|
𝒜
(
i
)
=
{
(
i
−
1
)
m
o
d
K
,
i
,
(
i
+
1
)
m
o
d
K
}
| (3) |
Accordingly, soft accuracy is as below.
|
Soft Accuracy
(overall)
=
1
N
∑
i
=
0
K
−
1
∑
j
∈
𝒜
(
i
)
𝐂
i
,
j
| (4) |
|
Soft Accuracy
(class
i
)
=
∑
j
∈
𝒜
(
i
)
𝐂
i
,
j
∑
j
=
0
K
−
1
𝐂
i
,
j
| (5) |
3. Results and discussion
Tables 4 and 5 summarize the classification performance of the eight pretrained CNN models on the three test datasets.
Table 4
Test results (accuracy)
Dataset 1 (mixed fields)
| Model |
Overall |
D0 |
D1 |
D2 |
D3 |
D4 |
D5 |
D6 |
D7 |
| VGG16 |
0.854 |
0.828 |
0.853 |
0.855 |
0.902 |
0.817 |
0.842 |
0.831 |
0.902 |
| VGG19 |
0.853 |
0.831 |
0.899 |
0.801 |
0.891 |
0.822 |
0.896 |
0.792 |
0.893 |
| ResNet18 |
0.852 |
0.828 |
0.872 |
0.817 |
0.877 |
0.833 |
0.858 |
0.831 |
0.899 |
| ResNet34 |
0.844 |
0.836 |
0.861 |
0.825 |
0.902 |
0.787 |
0.863 |
0.817 |
0.863 |
| ResNet50 |
0.859 |
0.814 |
0.877 |
0.844 |
0.880 |
0.839 |
0.866 |
0.839 |
0.910 |
| ResNet101 |
0.850 |
0.855 |
0.855 |
0.828 |
0.896 |
0.812 |
0.861 |
0.820 |
0.872 |
| EfficientNet-B0 |
0.849 |
0.814 |
0.880 |
0.790 |
0.883 |
0.814 |
0.869 |
0.831 |
0.913 |
| MobileNetV3-Large |
0.852 |
0.822 |
0.853 |
0.839 |
0.899 |
0.806 |
0.877 |
0.828 |
0.893 |
Dataset 2-a (Field A → Field B)
| Model |
Overall |
D0 |
D1 |
D2 |
D3 |
D4 |
D5 |
D6 |
D7 |
| VGG16 |
0.789 |
0.803 |
0.904 |
0.661 |
0.909 |
0.681 |
0.828 |
0.647 |
0.878 |
| VGG19 |
0.797 |
0.701 |
0.928 |
0.681 |
0.880 |
0.672 |
0.861 |
0.738 |
0.913 |
| ResNet18 |
0.773 |
0.724 |
0.851 |
0.727 |
0.841 |
0.720 |
0.888 |
0.651 |
0.785 |
| ResNet34 |
0.752 |
0.509 |
0.850 |
0.711 |
0.800 |
0.626 |
0.856 |
0.794 |
0.873 |
| ResNet50 |
0.781 |
0.677 |
0.821 |
0.776 |
0.796 |
0.705 |
0.745 |
0.840 |
0.886 |
| ResNet101 |
0.732 |
0.574 |
0.863 |
0.640 |
0.686 |
0.695 |
0.853 |
0.690 |
0.856 |
| EfficientNet-B0 |
0.648 |
0.385 |
0.798 |
0.816 |
0.642 |
0.482 |
0.712 |
0.721 |
0.630 |
| MobileNetV3-Large |
0.728 |
0.827 |
0.731 |
0.751 |
0.704 |
0.708 |
0.698 |
0.659 |
0.746 |
Dataset 2-b (Field B → Field A)
| Model |
Overall |
D0 |
D1 |
D2 |
D3 |
D4 |
D5 |
D6 |
D7 |
| VGG16 |
0.821 |
0.864 |
0.728 |
0.948 |
0.702 |
0.933 |
0.762 |
0.946 |
0.690 |
| VGG19 |
0.802 |
0.960 |
0.714 |
0.937 |
0.732 |
0.807 |
0.699 |
0.841 |
0.723 |
| ResNet18 |
0.808 |
0.764 |
0.835 |
0.922 |
0.749 |
0.831 |
0.726 |
0.879 |
0.761 |
| ResNet34 |
0.823 |
0.763 |
0.810 |
0.844 |
0.814 |
0.860 |
0.792 |
0.897 |
0.806 |
| ResNet50 |
0.821 |
0.906 |
0.670 |
0.924 |
0.796 |
0.912 |
0.720 |
0.917 |
0.722 |
| ResNet101 |
0.806 |
0.829 |
0.702 |
0.935 |
0.690 |
0.885 |
0.781 |
0.910 |
0.713 |
| EfficientNet-B0 |
0.778 |
0.804 |
0.780 |
0.935 |
0.766 |
0.555 |
0.690 |
0.903 |
0.787 |
| MobileNetV3-Large |
0.803 |
0.788 |
0.762 |
0.890 |
0.722 |
0.850 |
0.784 |
0.878 |
0.751 |
Table 5
Test results (soft accuracy)
Dataset 1 (mixed fields)
| Model |
Overall |
D0 |
D1 |
D2 |
D3 |
D4 |
D5 |
D6 |
D7 |
| VGG16 |
0.982 |
0.975 |
0.989 |
0.984 |
0.992 |
0.970 |
0.986 |
0.962 |
0.995 |
| VGG19 |
0.983 |
0.992 |
0.995 |
0.981 |
0.973 |
0.956 |
0.984 |
0.984 |
0.997 |
| ResNet18 |
0.985 |
0.975 |
0.992 |
0.986 |
0.981 |
0.981 |
0.992 |
0.981 |
0.992 |
| ResNet34 |
0.979 |
0.978 |
0.989 |
0.978 |
0.997 |
0.945 |
0.984 |
0.975 |
0.986 |
| ResNet50 |
0.981 |
0.970 |
0.986 |
0.978 |
0.984 |
0.965 |
0.989 |
0.978 |
0.995 |
| ResNet101 |
0.978 |
0.986 |
0.989 |
0.986 |
0.984 |
0.940 |
0.978 |
0.973 |
0.986 |
| EfficientNet-B0 |
0.975 |
0.970 |
0.989 |
0.965 |
0.978 |
0.940 |
0.984 |
0.986 |
0.992 |
| MobileNetV3-Large |
0.975 |
0.954 |
0.970 |
0.981 |
0.984 |
0.954 |
0.989 |
0.981 |
0.986 |
Dataset 2-a (Field A → Field B)
| Model |
Overall |
D0 |
D1 |
D2 |
D3 |
D4 |
D5 |
D6 |
D7 |
| VGG16 |
0.960 |
0.984 |
0.992 |
0.987 |
0.968 |
0.908 |
0.918 |
0.946 |
0.979 |
| VGG19 |
0.970 |
0.985 |
0.993 |
0.979 |
0.955 |
0.924 |
0.954 |
0.982 |
0.990 |
| ResNet18 |
0.955 |
0.925 |
0.949 |
0.972 |
0.984 |
0.956 |
0.980 |
0.951 |
0.924 |
| ResNet34 |
0.945 |
0.898 |
0.928 |
0.937 |
0.912 |
0.940 |
0.982 |
0.986 |
0.981 |
| ResNet50 |
0.952 |
0.959 |
0.957 |
0.951 |
0.922 |
0.916 |
0.943 |
0.976 |
0.989 |
| ResNet101 |
0.919 |
0.915 |
0.914 |
0.910 |
0.831 |
0.916 |
0.929 |
0.970 |
0.967 |
| EfficientNet-B0 |
0.864 |
0.741 |
0.948 |
0.965 |
0.923 |
0.778 |
0.835 |
0.865 |
0.859 |
| MobileNetV3-Large |
0.919 |
0.942 |
0.972 |
0.939 |
0.909 |
0.823 |
0.888 |
0.916 |
0.964 |
Dataset 2-b (Field B → Field A)
| Model |
Overall |
D0 |
D1 |
D2 |
D3 |
D4 |
D5 |
D6 |
D7 |
| VGG16 |
0.972 |
0.930 |
0.962 |
0.975 |
0.972 |
0.984 |
0.993 |
0.980 |
0.981 |
| VGG19 |
0.951 |
0.991 |
0.995 |
0.991 |
0.983 |
0.842 |
0.944 |
0.911 |
0.954 |
| ResNet18 |
0.959 |
0.940 |
0.983 |
0.985 |
0.977 |
0.964 |
0.911 |
0.948 |
0.967 |
| ResNet34 |
0.958 |
0.898 |
0.972 |
0.934 |
0.972 |
0.967 |
0.970 |
0.979 |
0.975 |
| ResNet50 |
0.970 |
0.948 |
0.963 |
0.985 |
0.989 |
0.972 |
0.985 |
0.962 |
0.959 |
| ResNet101 |
0.955 |
0.902 |
0.925 |
0.966 |
0.972 |
0.966 |
0.990 |
0.959 |
0.961 |
| EfficientNet-B0 |
0.925 |
0.962 |
0.980 |
0.978 |
0.945 |
0.702 |
0.911 |
0.946 |
0.975 |
| MobileNetV3-Large |
0.943 |
0.866 |
0.939 |
0.958 |
0.954 |
0.924 |
0.974 |
0.967 |
0.961 |
In Dataset 1 (mixed fields), all models performed stably, with an overall accuracy of approximately 0.85 and a soft accuracy exceeding 0.97. The lowest per-class accuracy was 0.787 (ResNet34), and the lowest per-class soft accuracy was 0.940 (ResNet101 and EfficientNet-B0), confirming that all models maintained reliable detection performance across all direction classes.
In Dataset 2-a (Field A → Field B), EfficientNet-B0 achieved an overall accuracy of 0.648, whereas the other models attained values of around 0.73–0.80, which were all lower than those on Dataset 1. Several per-class accuracies were below 0.70, indicating that certain direction classes were predicted with insufficient reliability. Soft accuracy was relatively high—0.864 for EfficientNet-B0 and approximately 0.91–0.97 for the other models. However, ResNet101 and MobileNetV3-Large showed low per-class soft accuracies of 0.831 and 0.823, respectively.
On Dataset 2-b (Field B → Field A), the overall accuracies of most models ranged from approximately 0.78 to 0.82, which were lower than those on Dataset 1 but higher than those on Dataset 2-a. Although per-class accuracies were generally better compared with those on Dataset 2-a, some models still exhibited classes with accuracies falling below 0.70. Soft accuracy also remained high (0.92–0.97), consistent with the patterns observed on Datasets 1 and 2-a. However, VGG19, EfficientNet-B0, and MobileNetV3-Large showed relatively low per-class soft accuracies of 0.842, 0.702, and 0.866, respectively.
Table 6 presents the inference time per image for each model. The processing speeds of all architectures were within approximately 0.7–3.6 ms per image. Lighter models achieved faster inference, whereas deeper models showed longer processing times.
Table 6
Inference time per image (ms)
| Model |
Dataset 1 |
Dataset 2-a |
Dataset 2-b |
| VGG16 |
2.88 |
2.91 |
2.89 |
| VGG19 |
3.34 |
3.35 |
3.36 |
| ResNet18 |
0.74 |
0.77 |
0.74 |
| ResNet34 |
1.24 |
1.70 |
1.24 |
| ResNet50 |
3.33 |
2.00 |
2.45 |
| ResNet101 |
3.60 |
2.99 |
4.38 |
| EfficientNet-B0 |
3.09 |
1.98 |
2.22 |
| MobileNetV3-Large |
1.56 |
1.50 |
1.71 |
Overall, the models could perform sufficiently when trained and tested on images drawn from the mixed-field distribution of Dataset 1, where tiles from both fields were combined and all models achieved consistently high accuracy. By contrast, they achieved lower accuracies on Datasets 2-a and 2-b, each constructed from a single field to evaluate prediction performance under unseen field conditions. Therefore, models trained on a single field generalized poorly, highlighting the substantial impact of domain shifts on lodging direction estimation. These findings suggest that differences in field and imaging characteristics across datasets, such as lodging texture and illumination, affect the generalization ability of models. Datasets should be constructed from multiple fields and under multiple imaging conditions to increase diversity and improve model robustness to domain shifts.
The models exhibited different degrees of performance degradation when transitioning from Dataset 1 to Datasets 2-a and 2-b, suggesting that robustness to domain shifts varied between architectures. In particular, EfficientNet-B0 showed more noticeable reductions in accuracy and per-class performance during separate-field evaluation, indicating limited generalization to unseen conditions. By contrast, models such as VGG16 and ResNet50 maintained relatively stable accuracy across datasets. Thus, robustness to distributional variations is important for lodging direction estimation.
We investigated the sources of variation in per-class accuracy by analyzing the confusion matrix of ResNet18, which performed stably across all datasets (Fig. 4). Most of its misclassifications occurred between adjacent direction classes rather than between opposing-direction ones. This observation aligned with its high results for soft accuracy, suggesting that errors were generally minor and primarily occurred near ambiguous class boundaries.

(a)
Dataset 1 (mixed fields)

(b)
Dataset 2-a (Field A → Field B)
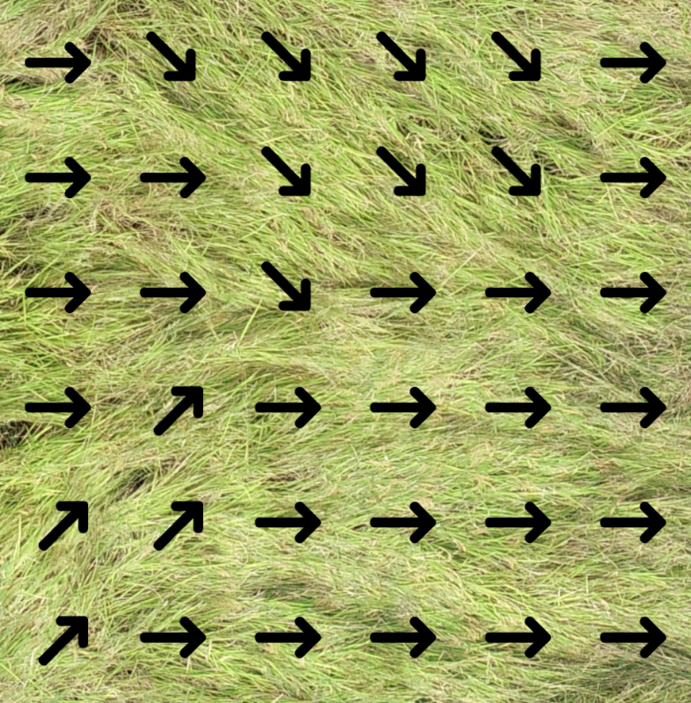
We also compared pairs of models with comparable backbone architectures but different depths: VGG16 versus VGG19, ResNet18 versus ResNet34 (basic-block ResNets), and ResNet50 versus ResNet101 (bottleneck ResNets). Across all datasets, VGG16 and VGG19 exhibited similar accuracy, without a clear advantage of the deeper variant. For both ResNet pairs, however, the deeper models tended to underperform relative to their shallower counterparts, with only a minor exception on Dataset 2-b (ResNet18 versus ResNet34). Furthermore, inference times increased with model complexity. Under the conditions of this study, ResNet18 appeared the most suitable for practical use, providing sufficient accuracy while requiring substantially less computation, which is important for large-scale field applications. An example of the lodging direction map predicted by the ResNet18 model trained on Dataset 1 is shown in Fig. 5.
However, several limitations remain despite these promising results. First, discretizing lodging directions into eight fixed classes may have oversimplified the continuous nature of field patterns. In this study, each tile was assigned a single representative label from the eight predefined direction classes. However, in real-world settings, a single tile may contain multiple lodging directions or exhibit orientations that fall between defined classes. In such cases, assigning only one discrete label may introduce simplification errors and fail to capture the full directional complexity. As an immediate remedy within the current classification framework, a top-two fusion strategy may be a practical means of improving accuracy in ambiguous regions near class boundaries. In this strategy, the directional vectors of the two most probable classes are combined, such as by using a weighted average. Researchers can fundamentally address this limitation in future work by exploring multilabel classification or continuous-angle regression methods, which may better reflect the continuous nature of lodging directions in fields.
Second, this study focused solely on direction classification, neglecting the vertical degree of lodging or the presence of upright rice plants. These aspects are critical for accurately assessing field conditions and informing harvesting priorities. This limitation can be addressed by extending the current framework to estimate both lodging direction and lodging severity within a unified model. Alternatively, a two-step pipeline can be used; existing methods for lodging severity estimation are used to identify lodged regions, and direction classification is performed only within those areas. This strategy would enhance the accuracy and efficiency of the overall system, particularly in fields containing mixtures of lodged and upright rice plants.
These future directions are expected to improve the robustness and practical applicability of the proposed framework within autonomous harvesting systems.
4. Conclusions
This study aimed to detect rice lodging directions in UAV imagery as a foundational step toward developing novel autonomous harvesting strategies. We propose a classification framework in which orthomosaics generated from UAV images are divided into tiles corresponding to ground areas sized approximately (60 × 60) cm each, and each tile was assigned a lodging direction using a pretrained CNN model.
The experimental results demonstrated that all models performed excellently in the mixed-field dataset (Dataset 1), with an overall accuracy of around 0.85 and a soft accuracy exceeding 0.97. On the separate-field datasets (Datasets 2-a and 2-b), overall accuracy decreased for many models; nonetheless, several architectures achieved overall accuracies of around 0.78–0.82 and soft accuracies of over 0.95, which are sufficient for practical use. Together, these results suggest that the proposed method can provide practically useful lodging direction estimates. Moreover, the generated lodging direction maps are useful for downstream applications, such as harvesting path planning.
This study can significantly advance autonomous harvesting in lodged fields—a persistent challenge for robotic combine harvesters. By reliably detecting lodging directions in UAV imagery, our approach provides critical information for aligning harvesting operations with actual field conditions.
In future work, we plan to extend this direction classification framework to include factors such as field geometry and lodging severity. These enhancements will support the construction of comprehensive lodging direction maps for entire fields. Building on this foundation, we further aim to develop harvesting path planning methods that explicitly consider lodging conditions, thereby helping create more efficient and robust autonomous rice harvesting systems.
Acknowledgments
This work was supported by JST SPRING, Grant Number JPMJSP2110.
Declaration of conflicting interests
The authors declare no conflicts of interest.
Notes
(URLs on references were accessed on 10 April 2026.)
References
- Guo, R. et al. 2023. Automatic detection of crop lodging from multitemporal satellite data based on the isolation forest algorithm. Computers and Electronics in Agriculture. 215: 108415. https://doi.org/10.1016/j.compag.2023.108415
- He, K. et al. 2016. Deep residual learning for image recognition. Proceedings of the 2016 IEEE Conference on Computer Vision and Pattern Recognition. 770–778. https://doi.org/10.1109/CVPR.2016.90
- Howard, A. et. al. 2019. Searching for MobileNetV3. Proceedings of the 2019 IEEE/CVF International Conference on Computer Vision. 1314–1324. https://doi.org/10.1109/ICCV.2019.00140
- Kumar, M. et al. 2024. Machine learning based plot level rice lodging assessment using multi-spectral UAV remote sensing. Computers and Electronics in Agriculture. 219: 108754. https://doi.org/10.1016/j.compag.2024.108754
- Liu, T. et al. 2018. Estimates of rice lodging using indices derived from UAV visible and thermal infrared images. Agricultural and Forest Meteorology. 252: 144–154. https://doi.org/10.1016/j.agrformet.2018.01.021
- Loshchilov, I. et al., 2019. Decoupled weight decay regularization. arXiv: 1711.05101. https://doi.org/10.48550/arXiv.1711.05101
- Masuda, R. et al. 2012. Detection of rice plant lodging using camera and laser range finder. Proceedings of the International Conference of Agricultural Engineering CIGR-AgEng2012. C-1888.
- Simonyan, K. et al. 2015. Very deep convolutional networks for large-scale image recognition. arXiv:1409.1556. https://doi.org/10.48550/arXiv.1409.1556
- Su, Z. et al. 2022. LodgeNet: Improved rice lodging recognition using semantic segmentation of UAV high-resolution remote sensing images. Computers and Electronics in Agriculture. 196: 106873. https://doi.org/10.1016/j.compag.2022.106873
- Tan, M. et al. 2019. EfficientNet: Rethinking model scaling for convolutional neural networks. Proceedings of the 36th International Conference on Machine Learning, PMLR 97. 6105–6114. https://doi.org/10.48550/arXiv.1905.11946
- Zhang, Q. et al. 2023. Wheat lodging direction detection for combine harvesters based on improved K-means and bag of visual words. Agronomy. 13 (9): 2227. https://doi.org/10.3390/agronomy13092227