Factors influencing salt penetration in salted eggs

2026 Volume 19 Issue 2 Pages 79-86
Details
2026 Volume 19 Issue 2 Pages 79-86
This study aimed to determine the optimal temperature and salt concentration for producing salted eggs with uniform salt content. Medium-sized eggs were soaked in brine solutions with three different salt concentrations and four temperature levels for three days. Subsequently, eggs with three different diameters mean geometric and three shell thicknesses were soaked in a 25 % salt solution at 60 °C for three days. The results showed that the salt content in eggs increased linearly with salt concentration. The temperature that produced the highest salt content was 64 °C. The rate of salt diffusion followed a hyperbolic relationship with shell thickness and an exponential relationship with egg diameter.
Salted hen and duck eggs are popular processed egg products in Indonesia (Muliawati et al., 2024). In Brebes, Central Java, approximately 54 % of salted egg producers are licensed as home industries, and most of them are capable of producing more than 3,000 eggs per day to meet broader market demands (Hasdar et al., 2022). The duck eggs and chicken eggs can be produced using salted egg processing machines. Maramis et al. (2022) reported that the wet salting method is used to make salted eggs from chicken eggs by soaking them in a saturated salt solution, as also supported by Ariviani et al. (2017).
According to Tharukliling et al. (2018), when there is excess egg production in the market and low demand, the remaining eggs can be preserved as salted eggs, becoming an effective alternative. The process of salting fresh eggs is carried out by soaking the eggs in a salt solution (Muliawati et al., 2024). Salt enters the eggs through a diffusion process (Novia et al., 2014). The diffusion process is influenced by internal and external factors. External factors include temperature and salt water concentration, both of which significantly affect the diffusion rate (Hashiba et al., 2008). Internal factors include the mean geometric diameter (Dg) and thickness of the eggshell.
The thickness of the eggshell varies across different eggs and hen age. Ketta et al. (2018) from enriched cages, classified shell thickness into three categories based on measurements of 1,279 eggs, namely 0.28–0.30, 0.33–0.36 and 0.39–0.41 mm classes of thin, medium, and thick, respectively. The difference in size depends on the type of chicken, age, and feed. Generally, as the chicken ages, the Dg of the egg tends to increase (Abanikannda et al., 2007). The diameter of the egg usually ranges from 33.89 to 48.22 mm (Ikegwu et al., 2016), a finding also supported by Rodriguez-Navarro et al. (2002) and Sun et al. (2012).
Sodium chloride diffuses through the pores and membranes of the shell gradually into the white and yolk during the salting process. Diffusion of salt into the egg white may be partially inhibited by the inner shell membrane (Benjakul et al., 2017). Similarly, Kaewmanee et al. (2011) it was reported that during the salting process, NaCl diffuses into the egg through the pores and membrane.
Significantly increasing the temperature of the salt solution used to soak fresh eggs will increase the salt diffusion coefficient (D) (Kusnadi et al., 2012). However, using too high a salt solution temperature should be avoided, as it can cause an increase in viscosity or coagulation of egg components. Denmat et al. (1999) observed that egg yolk viscosity increases sharply above 65 °C, with coagulation occurring at around 70 °C.
The diameter of the egg and the thickness of the shell are internal factors. Internal factors can affect the rate of salt diffusion. Eggshells tend to thin as the hen ages, which facilitates salt penetration into the egg. Furthermore, the salt content in salted eggs increases with the length of soaking time (Wibawanti et al., 2013).
Based on this background, this study aims to determine the optimal temperature and concentration of salt solution that produces the highest salt content with a soaking time of fresh eggs in the salt solution of 72 h. Furthermore, the eggshell thickness and the Dg were studied to determine the length of time the eggs were soaked in the salt solution, so that based on the soaking time, Dg and eggshell thickness the salt content in each egg was around 2.5 %.
The mean geometric diameter (Dg) was calculated by measuring the length (L) and width (W) of the egg, using Eq. (1) (Mohsenin, 1970). The length and width of the egg were measured using a caliper (Sigmat Vernier Caliper 6 Inch; accuracy 0.1 mm, Mitutoyo corp., Japan).
| (1) |
The eggshell is the hard, outer layer of the egg that protects the contents from physical, chemical, and microbiological damage (Ketta et al., 2018). A micrometer (scale 0–25 mm, accuracy 0.01 mm, Mitutoyo Corp.) can be used to measure the thickness of the eggshell.
2.3. Effect of dissolved salt concentration on egg salt contentA substance that diffuses through a medium per unit area per unit time is proportional to the concentration gradient; this is called Fick’s first law. Mathematically, Fick’s first law is expressed as Eq. (2) (Anantharaman et al., 2013). This equation indicates that the diffusion rate increases with a higher concentration gradient and is inversely proportional to the thickness of the eggshell.
| (2) |
Where J is the diffusion flux (mol m−2 s−1), D is the diffusion coefficient (m2 s−1), Cout is the salt concentration at the surface (mol m−3), Cin is the initial salt concentration inside the egg (mol m3), x is the eggshell thickness (m), and
In mathematics, a maximum referred to the highest value of a function, while a minimum denoted the lowest value either within a specific domain (local extremum) or across the entire domain of the function (global extremum). These extrema value could be determined by identifying the critical points, when the function of the first derivative had a value equal to zero or did not exist (Anton et al., 2012).
An increase in temperature generally enhanced the diffusion rate, causing a rapid movement of molecules. This occurred because higher temperatures increased the kinetic energy of molecules. However, temperature affected the viscosity of the medium. The viscosity of the diffusion medium experienced an increase, As the temperature increased beyond a certain point, impeding molecular movement and slowing down diffusion (Denmat et al., 1999).
In a practical system, increasing temperature had two competing effects. First, it initially increased molecular motion so that accelerated diffusion rate, but at temperature higher levels, to increased viscosity of the medium so that the diffusion rate reduced. This interaction caused a turning point (commonly referred to as an inflection point) where the rate of diffusion began to decline and stopped increasing. A mathematical model that captures this behavior was a cubic equation Eq. (3), which inherently possessed an inflection point and could describe non-linear relationships in physical systems. The cubic equation can be used in some applications in engineering (Zahedi et al., 2022).
| (3) |
Where NaCl is the percentage of salt content in eggs (%), T is the temperature, and a, b, c, d are the constant.
2.5. Effect of shell thickness on the rate of salt diffusion into the eggThe mass flux through a wall (such as pores or membranes) can be formulated using Eq. (2). If the salt concentration (Cout and Cin) and the diffusion coefficient (D) are assumed to be constant, and the only varying factor is the thickness of the wall or eggshell (x), then Eq. (2) can be simplified into Eq. (4).
| (4) |
The percentage of salt content in eggs (NaCl [%]) for a certain soaking time for fresh eggs, which is influenced by shell thickness (x), can be expressed in the form of a linear regression equation (Roustaei, 2024) where A and B is the constants and it (
| (5) |
Where NaCl is the salt content at time t (%), M and N is the constants, and x is the eggshell thickness (mm).
2.6. Effect of egg Dg on salt diffusion rateThe change in the concentration of a solution over time due to the diffusion process is called Fick’s second law. It is a partial differential equation that illustrates how the concentration of a substance varies with both time and position within a diffusion medium (Anantharaman et al., 2013). Fick’s Second Law can be expressed by Eq. (6).
| (6) |
Where Ct is the salt concentration in egg at t time (mol cm−3), Cm is the concentration environment (mol cm−3), hm is the diffusion coefficient (m s−1), A is the area (m2), V is the volume (m3), and t is the time (s).
Assuming the ambient concentration (Cm) to be constant, Eq. (6) can be integrated from the initial condition at t = 0, where Ct = C0, to any time t. This solution was further developed by Chen et al. (1999) and continued by Wang et al. (2013), and can be represented in Eq. (7).
| (7) |
It is assumed that the diffusion medium within the egg is dominated by water, allowing salt to distribute relatively evenly, based on this composition. For example, an egg from a 52 week old hen typically contains 61 % egg white, 30 % yolk and 9 % egg shell (Padhi et al., 2013). The water content of the yolk and egg was approximately 55 and 87 %, respectively (Bashir et al., 2015). In total, the water content in the egg was around 76 %.
The effect of the diameter of the egg on salt diffusion rate can be analyzed by comparing the surface area (A) to the volume (V) of the egg. For a near-spherical shape, the surface area to volume ratio is approximately 3/r, where r is the equivalent radius of the egg.
Assuming all other parameters remain constant, the average salt concentration inside the egg at a given time t can be expressed as shown in Eq. (8), and further simplified into Eq. (9). To obtain a linear relationship, Eq. (8) can be transformed logarithmically into Eq. (10).
| (8) |
| (9) |
| (10) |
The first experiment involved treatments of salt solution concentrations at three levels 15, 20 and 25 % with viscosities of 3.44, 3.98 and 4.32 mPa s, respectively, and immersion temperatures at four levels (40, 50, 60 and 70 °C). That levels of temperature and salt solution concentrations treatment were based on preliminary experiments and scientific considerations related to the diffusion process, protein characteristics of eggs and saturation point of a salt solution. A total of 120 eggs were used, sourced from laying hens aged 41 ± 1 weeks. This age was selected due to its influence on egg characteristics, particularly shell thickness and Dg (Tamiru et al., 2019).
Each experimental unit contained 10 eggs, and the average value of Dg was 4.43 ± 0.01 cm. These eggs were immersed in a salt solution according to a combination of temperature and concentration using a water bath (Digiterm 200; 30 L of capacity, J. P. SELECTA S. A., Spain) for 72 h. From each experimental unit, 3 eggs with a shell thickness of 0.35 ± 0.01 mm were selected to measure the salt content after immersion.
The second experiment involved two factors: eggshell thickness at three levels (0.29–0.31, 0.34–0.36 and 0.38–0.40 mm) and Dg at three levels (4.29 ± 0.01, 4.43 ± 0.01 and 4.63 ± 0.01 cm). Three different ages of chickens: 24 ± 1, 41 ± 1 and 82 ± 1 weeks, 90 eggs were taken. Each age of chicken was selected with 30 eggs. Eggs from chickens aged 82 ± 1 weeks were divided into 3 groups based on Dg size (4.29, 4.43 and 4.63 cm), each with 10 eggs. These eggs were soaked in a 25 % salt solution at a temperature of 60 °C for 72 h. Each Dg group had 10 eggs, then 3 eggs with a shell thickness of 0.30 ± 0.01 mm were selected for salt content analysis.
A similar procedure was applied to eggs from hens aged 41 ± 1 and 24 ± 1 weeks, selecting eggs with shell thicknesses of 0.34–0.36 and 0.38–0.40 mm, respectively.
Determination of the NaCl salt content of salted eggs is done by taking whole eggs that have just been soaked in a 25 % salt solution. Egg whites and yolks (soft boiled egg) are mixed and blended for 5 min. Then, 5 g are weighed with an analytical balance. The sample is put into a glass, and 70 mL of hot water is added. Then the sample is filtered with coarse filter paper and collected in a 100 mL glass. Aquadest is added so that the sample volume becomes 100 mL and is homogenized. A 10 mL of filtrate is taken and put into an Erlenmeyer flask, 3 mL of 5 % potassium chromate (K2CrO4) is added, and then homogenized. The sample is titrated with 0.1 N AgNO3 slowly, until a red brown color forms, marking the end of the titration. The NaCl content is calculated using the following Eq. (11) (Sezey et al., 2019).
| (11) |
Where V is the consumption of 0.1 N AgNO3 in titration (mL), N is the normality of AgNO3, F is the factor of 0.1 N AgNO3 and m is the mass of sample (g).
The Mohr’s method determines the chloride ion concentration of a solution by titration with silver nitrate (Hakim et.al., 2024). The Mohr method can determine the content of sodium chloride (NaCl) in a product (Sezey et al., 2019).
People usually produce salted eggs by soaking fresh eggs in a saturated salt solution. (Wibawanti et al., 2013; Ariviani et al., 2017). The difference in salt concentration outside the eggshell and the salt content inside the egg creates a diffusion pressure gradient, thus pushing the salt into the egg and subsequently increasing the salt content within the egg. The salt content in fresh eggs ranges from 0.35 to 0.47 % (Xu et al., 2017).
If we imagine the egg shell and its membrane as a thin barrier, then the diffusion of salt follows the mechanism described in Eq. (2) during the salting process (Dang et al., 2014). The greater the concentration difference, the stronger the osmotic driving force for salt to enter the egg. As can be seen in Fig. 1, the salt content in eggs increases during 72 h of soaking in salt water with varying salt concentrations.

Salt diffusion into the egg is primarily influenced by the salinity gradient between the outer solution and the internal egg matrix. Additionally, the concentration of the salt solution also affects the value of the salt diffusivity coefficient (Alizadeh et al., 2009). According to Eq. (2), the diffusion rate of salt into the egg increases linearly with the concentration gradient. In this study, salt concentrations in the external solution were set at 15, 20 and 25 %. The experimental results confirmed that higher salt concentrations in the brine resulted in proportionally higher salt content in the eggs. After 72 h of immersion, the salt content in the eggs ranged from 1.3 to 3.4 % (Fig. 1).
3.2. Optimizing the heating temperature of salted eggsSalted eggs are made by soaking fresh eggs in a salt solution for a specific amount of time. The temperature and concentration of the salt solution used as the soaking agent affect the salt content of the eggs.
The optimal temperature for maximum NaCl diffusion into the egg can be determined by optimizing Eqs. (12) and (13). Based on calculations using the quadratic formula (abc formula), it was found that the maximum salt content inside the egg occurs at approximately 64 °C. When the temperature is increased beyond this point, the salt content in the egg begins to decline.
| (12) |
| (13) |
According to Tsutsui (1988), heating eggs above 65 °C causes a sharp increase in the viscosity of the egg yolk, and coagulation begins to occur at around 75 °C. This phenomenon reduces the diffusion of salt into the egg interior.
The inflection point of the curve relating temperature to salt content can be identified by analyzing the second derivative of Eq. (12), which equals zero at the turning point is expressed in Eq. (14).
| (14) |
As shown in Fig. 2, increasing the temperature from 40 to 53.8 °C results in an increase in the salt content of the eggs, indicating a change in the diffusion rate (positive second derivative). However, beyond 53.8 °C, the change of diffusion rate begins to decline, likely due to the increase in viscosity of the internal egg fluids.
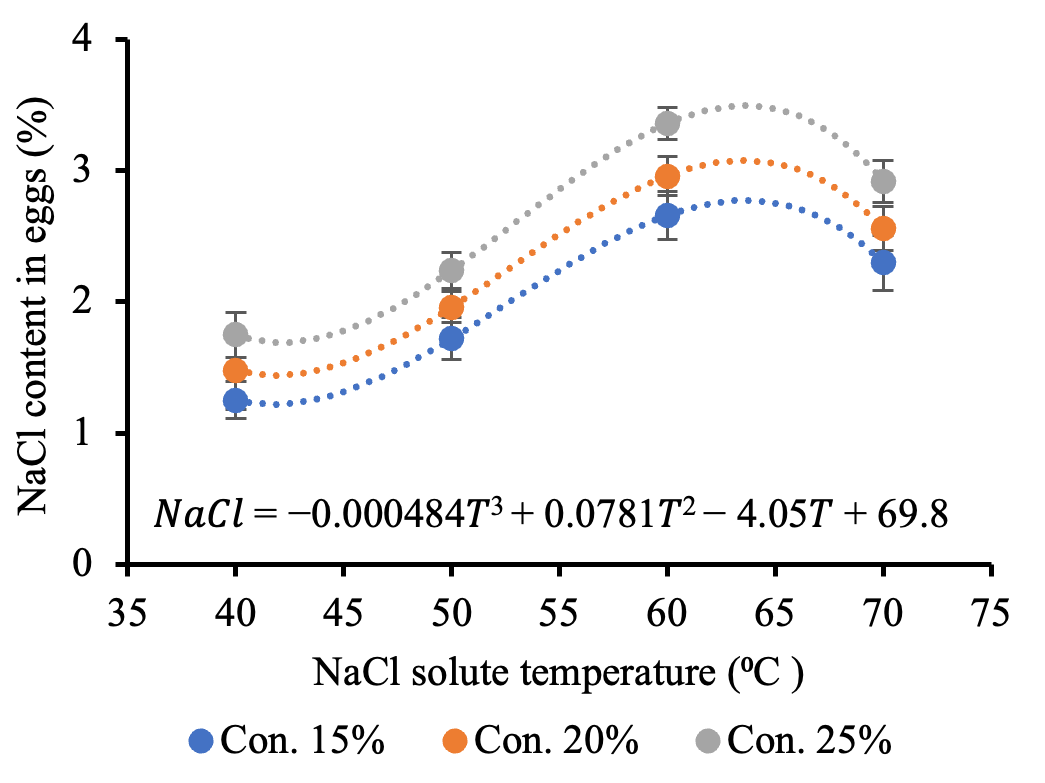
Mathematically, this can be seen from the second derivative of Eq. (12) or (14), the value is equal to zero. In this condition, the value of T = 53.8 °C, the temperature of 53.8 °C is identified as an inflection point. If the temperature is increased, then Eq. (14) has a negative value, meaning that the previous change in the diffusion rate increased, turning into a decrease in the diffusion rate. The change in the increase in salt content in the egg slows down until the change in the increase in salt content is zero. This is because the higher the temperature, the higher the viscosity of the liquid in the egg.
According to Denmat et al. (1999), the viscosity of the internal fluids begins to increase at around 55 °C and continues to rise to 76 °C. This increase in viscosity impedes the movement of salt ions into the egg, resulting in a slower diffusion rate.
3.3. Effect of eggshell thickness on salt diffusion in eggsThe physical characteristics of chicken eggs are influenced by the age of the laying hen, including shell color and thickness. Younger hens tend to produce eggs with darker brown shells, while older hens produce eggs with lighter brown shells. In addition, eggshell thickness generally decreases with increasing hen age. According to Yang et al. (2009) and Hamilton (1982), the eggshell thickness of young hens is approximately 0.351 mm, while that of older hens is about 0.297 mm. Furthermore, Sun et al. (2012) explain that the thickness of the eggshell with and without the shell membrane is 0.348–0.390 and 0.334–0.378 mm, respectively.
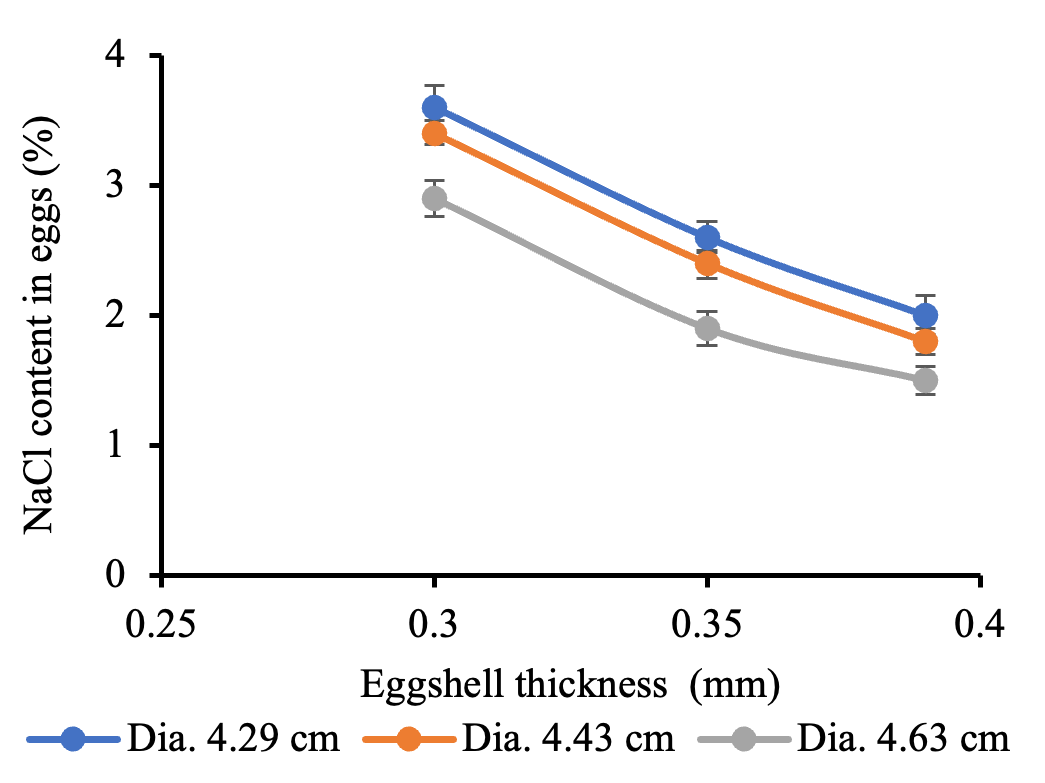
It can be seen in Fig. 3, the salt content in eggs is a function of the thickness of the eggshell. Linear regression analysis of the experimental data yielded mathematical models presented in Eqs. (15), (16) and (17). These equations described the amount of salt entering an egg as a function of eggshell thickness (x) after a 72 h immersion in a salt solution at 60 °C. Variations in salt content were interpreted as differences in the rate of salt mass transfer into the egg. Immersion time and temperature were kept constant across all experimental units.
| (15) |
On the Dg of eggshell ± 4.29 cm.
| (16) |
On the Dg of eggshell ± 4.43 cm.
| (17) |
On the Dg of eggshell ± 4.63 cm.
Sodium chloride (NaCl) solution enters the egg through shell pores, initially diffusing into the albumen and eventually reaching the yolk (Nurbaety et al., 2021). The NaCl salt enters the egg by diffusion in the form of Na+ and Cl− ions (Chen, et al., 1999). The size of the eggshell pores ranges from 1.6 to 74.7 µm, with a pore density of approximately 148 pores per cm2 (Walter, 1952). For comparison, the molecular diameter of water is 0.27 nm (Pu et al., 2020), while the diameters of Na+ and Cl− ions are close to that of the NaCl molecule, around 0.236 nm (Michaelian, 1998). Based on the size of water molecules, Na+ ions, Cl− ions and pores, the pore size was significantly larger than the water molecules and salt ions. This condition enabled salt ions to easily diffuse through the shell pores into the egg.
The thickness of the eggshell varied from 0.29 to 0.40 mm, while the maximum pore diameter was approximately 74.7 µm, leading to a pore to thickness ratio of 1:5383. As shell thickness increases, the time required for ions to traverse the shell also increases, thereby reducing the diffusion rate. Consequently, Na+ and Cl− ions must travel a relatively long diffusion path compared to the molecular size. Thicker shells led to lower salt content in the egg under the same immersion duration.
Experimental data showed that the relationship between shell thickness and salt content followed a hyperbolic curve. Based on Eqs. (15), (16) and (17), it was evident that increased shell thickness inversely affected the diffusion rate of salt into the egg. As shown in Fig. 3, the salt content within the egg decreases with increasing shell thickness. According to Table 1, increasing the shell thickness from 0.30 to 0.39 mm results in a 47 % reduction in salt content within the egg.
|
Eggshell thickness (mm) |
Egg of Dg (cm) | ||
|---|---|---|---|
| 4.29 | 4.43 | 4.63 | |
| observation | |||
| 0.30 | 3.6 | 3.4 | 2.9 |
| 0.35 | 2.6 | 2.4 | 1.8 |
| 0.39 | 2.0 | 1.8 | 1.6 |
| estimation | |||
| 0.30 | 3.59 | 3.39 | 2.82 |
| 0.35 | 2.60 | 2.40 | 1.99 |
| 0.39 | 1.99 | 1.79 | 1.47 |
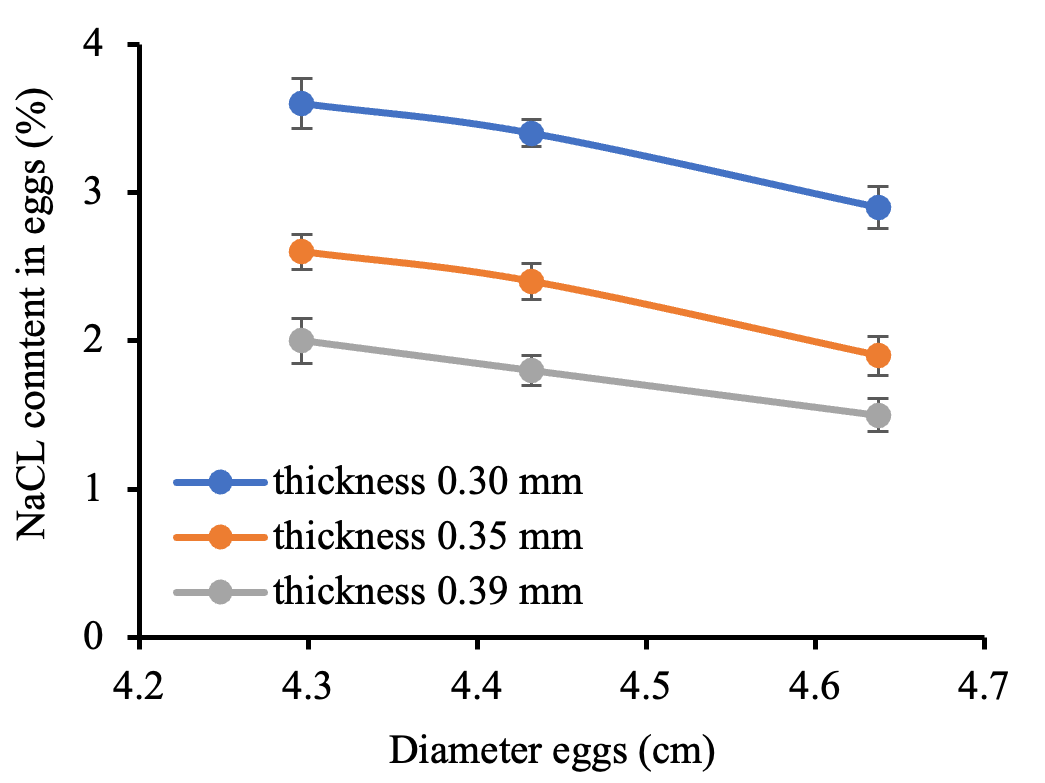
An increase in the Dg of the egg corresponds to a decrease in the salt content of the salted egg (Fig. 4). This inverse relationship suggests that Dg is an intrinsic factor influencing the rate of salt diffusion into the egg. According to Anantharaman et al. (2013), molecular diffusion refers to the random motion of individual molecules through a fluid medium, which on a macroscopic scale is described as a net flow along a straight line at a uniform velocity.
The volume of the egg reflected the internal capacity to accommodate incoming salt, while the surface area determined the potential rate of salt diffusion. The size of the egg affected the rate of salt diffusion. The radius of the egg described the size of the volume and surface area. The ratio between the volume and the surface area of the egg produced the radius (r/3). Radius played an important role in evaluating the efficiency of salt transfer into the egg.
In addition to the egg dimensions, the size and density of pores affected the diffusion rate. Sodium (Na+) and chloride (Cl−) ions diffused through pores, the egg white and yolk. The water content of egg white and yolk was approximately 87 and 55 %, respectively. The viscosity between the two media was different due to the varying concentration of the solution. According to Wang et al. (2024), the lipid content in egg yolk increased resistance to the diffusion rate of sodium (Na+) and chloride (Cl−) ions. the diffusion rate of Na+ and Cl− ions through egg white was higher than the yolk.
The ions move through the internal egg compartments over a certain distance. A larger Dg implied a greater diffusion path length within the egg, thereby increasing the time required for ions to reach the core. Consequently, the effective diffusion rate of Na+ and Cl− ions was reduced, leading to lower salt accumulation in larger eggs when subjected to the same soaking duration.
Using data from Table 2 and regression analysis based on Eq. (10), mathematical models were derived Eqs. (18), (19) and (20), expressing the relationship between the average salt concentration in the egg (NaCl) and either Dg or the geometric radius r.
| Egg of Dg (cm) | Eggshell thickness (mm) | ||
|---|---|---|---|
| 0.30 | 0.34 | 0.39 | |
| observation | |||
| 4.29 | 3.6 | 2.6 | 2.0 |
| 4.43 | 3.4 | 2.4 | 1.8 |
| 4.63 | 2.9 | 1.8 | 1.6 |
| estimation | |||
| 4.29 | 3.64 | 2.66 | 1.99 |
| 4.43 | 3.35 | 2.32 | 1.83 |
| 4.63 | 2.94 | 1.85 | 1.59 |
| (18) |
At eggshell ± 0.30 mm.
| (19) |
At eggshell ± 0.35 mm.
| (20) |
At eggshell ± 0.39 mm.
Considering that Dg = 2r, Eq. (8) showed that salt concentration decreased exponentially as Dg increased. Therefore, larger eggs exhibited lower salt contents. Table 2 summarizes the estimated salt concentrations in eggs of varying Dg, soaked for 72 h at 60 °C.
3.5. Application of external and internal factorsExternal factors play a significant role in determining the optimal temperature and salt concentration of the brining solution to achieve the maximum salt content in eggs. Immersing eggs in a 25 % salt solution at 64 °C yields the highest salt content in salted eggs, based on experimental results. This condition ensures the most efficient diffusion rate of salt into the eggs.
External factors determine the optimal conditions for producing salt content in salted eggs. Meanwhile, internal factors are useful for understanding how to achieve a uniform salt content in salted eggs. An experiment was conducted by soaking eggs in a 25 % salt solution at 60 °C for 72 h. The selection of a temperature of 60 °C is used for making salted eggs, and not using a temperature of 64 °C as the optimal temperature in making salted eggs to reduce protein damage. Uysal et al. (2017) stated that immersing eggs in hot water at 60 °C for 1–5 min did not significantly alter the protein profile in the electropherogram. However, heating at 64 °C resulted in a decrease or disappearance of some proteins in the yolk supernatant (γ-livetin) or egg white proteins. In addition, 60 °C corresponds to the pasteurization conditions typically used in the low-temperature long time (LTLT) method (Bermudez-Aguirre et al., 2023).
The results of the experiment for salt content in salted eggs are shown in Tables 1 and 2. The data show high variability in salt content, influenced by eggshell thickness and Dg. It tended to absorb more salt at thinner eggshells and smaller Dg values. Meanwhile, it produced lower salt content, when eggs with thicker shells and larger Dg values. A practical method for achieving uniform salt content with different shell thicknesses and Dg was to adjust the soaking time.
After 72 h of immersion at 60 °C, the estimated salt content shown in Table 1 was calculated based on eggshell thickness using Eqs. (15), (16) and (17). Meanwhile, the estimations in Table 2 were based on the Dg values using Eqs. (18), (19) and (20). Based on the consideration of diffusion resistances, these two sets of estimations produced different results. The mass flow of Eqs. (15), (16) and (17) are steady and Eqs. (18), (19) and (20) are unsteady.
The difference between salt content estimates in Tables 1 and 2 was due to the distinct sources of diffusion resistance. In Table 1, the main resistance was caused by the eggshell thickness, while in Table 2 was attributed to the increased diffusion path length associated with the Dg value. Assuming the two resistances acted in series, the salt diffusion rate was determined by the greater resistance. Therefore, the effective diffusion rate could be approximated using the higher resistance value, calculated using Eqs. (15) to (18).
To achieve a standardized salted egg salt content of 2.5 % (as per the Indonesian national standard [SNI]) across different eggshell thicknesses and Dg values, the immersion time must be adjusted. For instance, for an egg with a shell thickness of 0.30 mm and a Dg of 4.29 cm, the estimated salt content after 72 h of immersion is 3.59 % based on Eq. (15). Meanwhile, the estimated value based on the Dg is 3.64 % (Eq. (18)). Since the greater resistance arises from the shell thickness, the 3.59 % estimate is used for immersion time adjustment.
The formula for the length of soaking time (Eq. (21)) is based on the diffusion rate equation (Eq. (2)). In Eq. (2), the difference in diffusion rate, based on the 25 % salt content outside the egg shell, with the highest salt content inside the egg of 3.6 % and the lowest of 1.6 % for 72 h. Then the difference in diffusion rate is quite low at 8 %. It is assumed that the diffusion rate at a salt content of 1.6 and 3.6 % at the same shell thickness and Dg is constant. It was the required immersion time (Lt [h]) to achieve the target salt content of 2.5 % (Ts), estimated salt content (Es) can be calculated using Eq. (21).
| (21) |
For the example.
To achieve a salt content of 2.5 % in an egg with a shell thickness of 0.30 mm and Dg of 4.29 cm, the required immersion time is approximately 50.1 h. The immersion time for other egg size combinations can similarly be calculated using Eq. (21), while the corresponding salt content is estimated using Eq. (15) and/or (18).
Large-scale production of salted chicken eggs can be accelerated by immersing fresh eggs in a 25 % salt solution at an optimal temperature of 64 °C, which maximizes salt diffusion. Eggs should be classified based on shell thickness and Dg to ensure uniform salt content (2.5 %).
In this study, eggs were grouped into nine categories according to parameters, with soaking durations adjusted accordingly. Salt content after 72 h of immersion is estimated using Eqs. (15), (16) and (17) for shell thickness and (18), (19) and (20) for Dg. Interpolation or extrapolation with Eq. (21) allows adjustment of immersion time to achieve the 2.5 % target across different egg types. This method offers a practical and scalable framework for producing high-quality salted eggs with optimized processing time and consistent salt levels, integrating external (temperature, concentration) and internal (shell and size Dg) factors to enhance both efficiency and product uniformity.
Based on the results, it is recommended to study the effect of soaking fresh eggs in hot water at 60 °C for a long time on protein damage and the optimal temperature for salted egg production based on protein quality.
The authors are grateful to the Dean of the Faculty of Agriculture, University of Lampung, for funding this study through the Faculty Research Grant 2023. The authors are also grateful to the technicians and staff of the Laboratory of Food Process Engineering, Department of Agricultural Engineering, Faculty of Agriculture, University of Lampung, for the valuable assistance and support during the study.
The authors declare no conflicts of interest.
(URLs on references were accessed on 17 April 2026.)


