Abstract
Crystalline taro anomality, which arises up to 50 %, is characterized by high water content. In pouch products factory, these abnormal taros are removed manually with a lot of labor, thus a nondestructive method for its detection is highly needed. In this study, we used near-infrared spectroscopy (700–1,300 nm) to discriminate crystalline taro. A correlation analysis and multivariate analysis (PCA and SVM) were employed to select wavelength(s) and develop a discrimination model. As a result, normal and crystalline taros showed spectra with features at around 700 and 980 nm. The SVM model showed an accuracy rate of 72 %. This study is important since in factories at most 70 % of labor reduction could be expected in future.
1. Introduction
Taro is primarily consumed in Asia and Africa. Approximately 50 % (Ono et al., 1988) of taro is affected by crystallization, a disorder associated with high water content (Uritani et al., 1990). As the presence of crystalline anomalies causes taro to lose commercial value, nondestructive detection of this condition is highly desirable.
In this regard, near-infrared spectroscopy, along with chemometrics (Shao et al., 2012), has emerged as a promising option, with its use on taro reported in the literature (Ehounou et al., 2021).
Additionally, models that employ multiple wavelengths for evaluating the quality of other agricultural products have been reported. These models are potentially applicable in handheld devices that use multiple single-wavelength light-emitting diodes and multiband imaging. Several studies have also reported the use of multiple-wavelength classification of agricultural products. Using three wavelengths, Castillo-Girones et al. (2024) classified bruising on plums, while Jiang et al. (2016) used five wavelengths to evaluate blueberry quality and damage.
Shimomura et al. (2011) estimated the sugar content of apples by using three wavelengths. They reported the importance of the baseline wavelength (off-absorption wavelength) without absorption in obtaining the scattering information that vary the spectra.
In this study, we used near-infrared light (700–1300 nm) to identify crystalline anomalies in taro. We pursued single or multiple wavelengths with and without chemical absorption for raw absorbance for multi-band imaging. In addition, the wavelength was selected with the aid of correlation analysis and multivariate analysis, namely, principal component analysis (PCA) and support vector machine (SVM).
First, the spectral characteristics of normal taro and crystalline taro were investigated, and the absorption bands were assigned to vibrations of molecular moieties using the second derivatives. Next, the correlation coefficient (r) between arbitrary wavelength pairs was determined to identify the optimal two-wavelength combination. PCA loadings were analyzed to ensure the selected wavelengths. Finally, an SVM model was constructed and evaluated (a five-fold cross-validation).
2. Materials and methods
2.1. Experimental materials and samples
Taro samples were provided by a processing company in Ehime Prefecture, Japan, on November 20, 2024, as shown in Fig. 1. In the factory, taro samples were peeled, cut into small pieces and boiled at 100 °C for 40 min. After heating, they were pouched within a pack. The crystalline symptoms were visually classified by an experienced specialist at the processing factory. However, in color quantification by image analysis, lightness values were recorded as 73 ± 6 and 72 ± 8 for normal and abnormal taros, respectively (n.s. for t-test). The chroma (saturation) values were 8.4 ± 9.7 and 4.3 ± 4.1 for normal and abnormal taros, respectively (n.s. for t-test). This suggests that simple color values cannot discriminate between crystalline abnormal and normal taros.

Fig. 1
Appearance of taro sample
We used 25 normal taro samples and 25 crystalline (high-water-content) taro samples, which yielded 50 taros in total. The taros were stored at 20 °C until opening. The pouches were opened on November 28, December 5, and December 13, 2024, and we used 100 % cotton gauze (PL-0218154, Comolife Co., Ltd., Japan) to wipe off any excess water on the surface. Figure 2 shows the flowchart of creating a measurement piece. Taro was cut into slices and vertically hollowed using a cork borer to obtain cylindrical samples (diameter: 19.5 mm and thickness: 10 mm).

Fig. 2
Flowchart of measurement piece creation
We used the volume fraction because a light absorption coefficient is a superposition of components in the sample multiplied by its volume fraction (Shimomura, 2011). We calculated the volumetric water content (φw) of the tuber by dividing the water volume by the tuber volume (V) as follows.
The water mass (M) was obtained as the difference between the wet mass of the tuber and the total dry mass at 105 °C for 24 h (Zhang et al., 2017). The true water density (ρ) was set to 1.0 g cm−3. The tuber volume (V) was measured from an increase in the water volume of a measuring cylinder. The volumetric water content (φw) of the tuber was confirmed to be approximately 80 % of the value reported in the literature (Rashmi et al., 2018). The main reason for the difference in moisture content between our data and the previous review might be because our sample was soaked in the ascorbic acid solution to prevent oxidation in the factory.
2.3. Spectral measurement and differential processing
We used the integrating sphere unit of a visible/near-infrared spectrophotometer (SolidSpec-3700, Shimadzu Corp., Japan) to measure the spectra of the taro samples (Fig. 3). The samples were placed in a black ABS fixture (inner diameter: 20 mm; outer diameter: 24 mm, and length: 10 mm) to minimize the effect of stray light on the results. The measurement conditions were as follows: wavelength range of 700–1,300 nm; bandwidth of 5 nm; sampling pitch of 2 nm; scan speed of 1,460 nm min−1; measurement-environment temperature of 20 °C; and sample temperature of 20 °C. We confirmed the stability of the baseline spectra before and after measuring normal and abnormal taro samples. All the spectral acquisitions were conducted within 30 min after the pouch was opened.
To understand the spectra and assign the absorption bands to the molecular moieties, we calculated the second spectrum derivative. The Savitzky–Golay filter (cubic polynomial) was used (Savitzky et al., 1964). The window width of the filter was set to 30 nm (i.e., 15 corresponding data points).

Fig. 3
Schematic of diffuse reflectance measurement
3. Analysis
3.1. Two-wavelength correlation plot
To search for the wavelength(s) for multi-band imaging, we examined the correlation between the raw absorbances at different wavelengths using the Pearson correlation coefficient r.
3.2. PCA
To verify the selected wavelengths for the correlation analysis, we investigated whether the wavelength candidates for raw absorbance were consistent with a multivariate analyses by applying PCA, a method for assessing collinearity (Chiba et al., 1995). In the PCA, the cumulative explanation rate of the first component was 98 %; therefore, the second component was also considered when selecting the wavelengths.
3.3. SVM
We examined the feasibility of a discriminant model based on the raw absorbance at two wavelengths (700 nm and 980 nm) by visualizing the relationship between the associated absorbance values in a scatter plot. The results showed that normal tubers were located in the center, while abnormal tubers were distributed around them. An even-order polynomial kernel can be used for the raw spectra to represent the closed curve of the discrimination boundary using the SVM kernel function. Therefore, we used the simplest quadratic polynomial function (2nd order). Five-fold cross-validation (i.e., 75 % and 25 % for training and validation, respectively) was performed on all 50 datasets (normal tubers: 25 and abnormal tubers: 25). The analyses and the other statistical tests were performed using MATLAB R2025b (MathWorks Inc., USA) and Microsoft Excel (Microsoft Corp., USA).
4. Results and discussion
4.1. Spectral characteristics
Figure 4 (a) shows the near-infrared spectra of normal and abnormal tubers. Broad peaks were observed near 980 and 1,200 nm in both sample groups. Similarly, the pure water sponge spectra resembled those of taro (Fig. 4 (b)). The two peaks of taro were probably caused by water, which is the main component in the tubers.

(a)
Normal and abnormal taro tubers (n = 50)
Figure 5 (a) shows the second-derivative spectra for band assignment. The taro results indicate good agreement with that of water (Fig. 5 (b)). Strong absorption bands were observed at 960 and 1,150 nm. Notably, 960 nm corresponds precisely to the overtones of O–H stretching vibration (3 × 3,400 cm−1 ≈ 960 nm), mainly from water (Seki et al., 2020). By contrast, the 1,150 nm absorption was assigned to a combination of the overtone and bending of O–H vibrations (2 × 3,400 cm−1 + 1,645 cm−1 ≈ 1,150 nm). Therefore, the spectrum of the taro tubers is primarily attributable to water.

(a)
Near-infrared second-derivative spectra of taro tuber
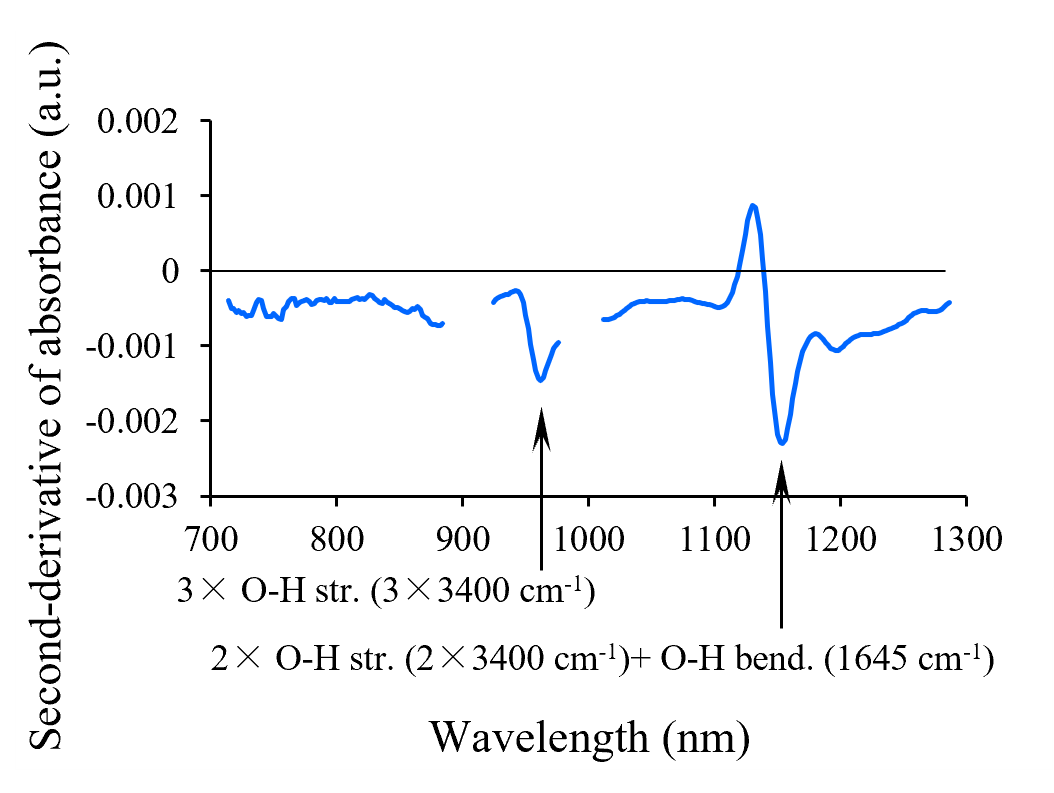
(b)
Near-infrared second-derivative spectra of water sponge

(c)
Frequency distribution of the second-derivative absorbance at 960 nm
Figure 6 shows the volumetric water content calculated based on mass and volume. The volumetric water content was approximately 90 % for both normal and abnormal tubers. This means that the spectra were mainly affected by the major component of taro, water (see also Fig. S1 for moisture on a mass basis).
Figure. 5 (c) and (d) show the second-derivative values at wavelengths of 960 and 1,150 nm. For both wavelengths, the abnormal taro tubers exhibited lower values (i.e., high water absorption, p = 0.12 for the Mann–Whitney U test), which is in accordance with the volumetric results (Fig. 6).
To examine the single or multiple wavelength(s) for discriminating against the crystalline abnormalities, we noticed that the abnormal spectra were clustered in the middle of the raw absorbance, while the spectral shape was the same as those of normal ones.
4.2. Two-wavelength correlation analysis for wavelength
Next, we sought to identify two wavelengths by analyzing r between all possible wavelength pairs (λ1, λ2). Figure 7 shows a contour plot of r across the near-infrared spectrum of taro. The lower correlation coefficient r indicates that the pair of wavelengths includes more information than the single wavelengths among them.
The r decreased (r ≈ 0.7) at the combinations of short (700 nm) and long (900–1,300 nm) wavelength regions. This indicates that a pair of wavelengths including the wavelength of 700 nm (λ1 = 700 nm) provides discriminant potentiality. The low correlation in this region (blue in Fig. 7) is because at 700 nm, the water absorption is weak, whereas in the longer wavelength range (900–1,300 nm), the water absorption is strong.
Figure 7 + markers (lowest combinations) shows that 900–1,000 nm and around 1,200 nm, the r decreased, indicating the different spectral information can be obtained at these regions for λ2.
4.3. PCA for wavelength confirmation
As aforementioned, we selected the wavelength pairs of for λ1 = 700 and for λ2 = 900–1,000 nm or for λ1 = 700 and for λ2 ≈ 1,200 nm as multiband candidates. We further analyzed the correlation between the wavelengths using PCA.

(a)
First principal component
PCA of the raw spectra showed that the first component alone accounted for a high proportion of the original variance (98 %). The loadings for the first component PC1, as shown in Fig. 8, were similar in shape to the raw spectrum (Fig. 4), thus supporting the strong proportional variation of the raw spectrum. In the multiplicative scatter correction (MSC) concept, NIR spectra can be approximated as the summation of the proportional factor (multiplicative factor) and the additive factor as below.
|
A
(
λ
)
=
a
A
c
o
r
r
(
λ
)
+
b
| (2)
|
In this form, A (λ) is the sample absorbance as a function of wavelength λ. Acorr (λ) is the corrected absorbance of sample. Coefficients a and b are the proportional and additive scattering factors of the sample, respectively. The proportional variance can also be confirmed in Fig. 4 (a). PC1 is the proportional factor of the raw spectra.
The second component, PC2, explained 1.2 % of the original spectral variance. The second component loadings were zero (no contribution) at around 900–1,000 nm, while the loading was large at 700 nm. The PCA results suggest the combination of λ1 = 700 nm and λ2 = 900–1,000 nm includes different information compared with the single wavelength of each.
4.4. SVM model for two-wavelength nonlinear model
From the aforementioned range of wavelength 900–1,000 nm, λ2 = 980 nm was selected since at this wavelength the raw absorption spectra exhibit maxima (Fig. 4).
We visualized a scatter plot of the absorbance at the two wavelengths of 700 nm and 980 nm (Fig. 9 (a)). The scatter plot showed normal tubers in the center, with abnormal tubers distributed around them. A 2nd-order polynomial kernel was used to construct a discriminant model.
In Fig. 9 (a), the brown circle shows that the discriminant boundary (average of five-fold cross-validation). In this model, 2nd-order kernel is adapted, the closed boundary curve is elliptical. A high accuracy rate of 92 % (true-negative accuracy rate) was obtained for the normal tubers, with 23 out of 25 correctly identified. An accuracy rate of 52 % (true-positive accuracy rate) was obtained for the abnormal tubers, with 13 out of 25 correctly identified. The overall accuracy rate was 72 % (total predicted accuracy rate), with 36 out of 50 correctly identified.
To quantify the model performance independently of the decision threshold and to evaluate the model performance comprehensively, a receiver operating characteristic (ROC) curve (i.e., false positive rate vs. true positive rate) was obtained (Fig. 9 (b)). The area under the curve (AUC) was 0.72. This indicates that the SVM achieved an accuracy of approximately 70 %, regardless of the threshold, for detecting the abnormal taros.

(a)
Scatter plot of absorbance at two wavelengths (λ1, λ2) to consider the shape of discriminant curve
5. Conclusions
In this study, we used near-infrared spectroscopy (700–1,300 nm) to discriminate crystalline taro anomalies (high water-content). We performed wavelength correlation analysis and multivariate analysis (PCA and SVM) to select multiple wavelength pairs. The spectrum showed strong absorption around 980 and 1,200 nm. This is likely attributable to O–H stretching and bending vibrations. We selected the wavelength combination of 700/980 nm based on the scatter plot and PCA analysis. Finally, we constructed an SVM model and evaluated it (five-fold cross-validation). An accuracy rate of 72 % was achieved. Furthermore, the ROC-AUC was 0.72 for varying decision thresholds. At present, in the factory, crystalline taros are removed manually, thus this study shows the expecting 70 % reduction of labor at most in future.
Acknowledgments
We thank CHUON Co., Ltd. for providing samples. This study was supported by the Division of Material Science Research Support the Advanced Research Support Center (ADRES), Ehime University.
Appendix A. supplementary data
The supplementary data, Figures in this article is published in J-STAGE Data.
Declaration of Conflicting Interests
The authors declare no conflicts of interest.
Notes
(URLs on references were accessed on 14 July 2026.)
References
- Castillo-Girones, S. et al. 2024. Detection of subsurface bruises in plums using spectral imaging and deep learning with wavelength selection. Postharvest Biology and Technology. 207: 112615. https://doi.org/10.1016/j.postharvbio.2023.112615
- Chiba, M. et al. 1995. Principal component analysis (PCA) applied to near infrared spectra for classifying wheat flours. Nippon Shokuhin Kagaku Kogaku Kaishi. 42 (10): 796–801. https://doi.org/10.3136/nskkk.42.796
- Ehounou, A. E. et al. 2021. Predicting quality, texture and chemical content of yam (Dioscorea alata L.) tubers using near infrared spectroscopy. Journal of Near Infrared Spectroscopy. 29 (3): 128–139. https://doi.org/10.1177/09670335211007575
- Jiang, Y. et al. 2016. Nondestructive detection and quantification of blueberry bruising using near-infrared (NIR) hyperspectral reflectance imaging. Scientific Reports. 6: 35679. https://doi.org/10.1038/srep35679
- Ono, T. et al. 1988. Studies on crystallized symptom of taro. I. Occurrence of crystallized symptom in different cultivars. Bulletin of the Chiba-Ken Agricultural Experiment Station. (29): 71–79. (In Japanese.)
- Rashmi, D. R. et al. 2018. Taro (Colocasia esculenta): an overview. Journal of Medicinal Plants Studies. 6 (4): 156–161.
- Savitzky, A. et al. 1964. Smoothing and differentiation of data by simplified least squares procedures. Analytical Chemistry. 36 (8): 1627–1639. https://doi.org/10.1021/ac60214a047
- Seki, T. et al. 2020. The bending mode of water: a powerful probe for hydrogen bond structure of aqueous systems. The Journal of Physical Chemistry Letters. 11 (19): 8459–8469. https://doi.org/10.1021/acs.jpclett.0c01259
- Shao, X. et al. 2012. Multivariate calibration of near-infrared spectra by using influential variables. Analytical Methods. 4 (2): 467–473. https://doi.org/10.1039/c2ay05609g
- Shimomura, Y. 2011. Nondestructive measurement technique of fruit sugar content with near-infrared lasers. The Review of Laser Engineering. 39 (4): 233–238. (In Japanese.) https://doi.org/10.2184/lsj.39.233
- Uritani, I. et al. 1990. Food-scientific investigations on so-called crystalline taro occurring in the child-corm of an early-maturing Colocasia antiquorum named cv. Ishikawa-wase. NIPPON SHOKUHIN KOGYO GAKKAISHI. 37 (4): 306–310. https://doi.org/10.3136/nskkk1962.37.4_306
- Zhang, Z. et al. 2017. Comparison of four pretreatments on the drying behavior and quality of taro (Colocasia esculenta L. Schott) slices during intermittent microwave vacuum-assisted drying. Drying Technology. 35 (11): 1347–1357. https://doi.org/10.1080/07373937.2017.1323761



