Abstract
Background: The application of metabolomics-based profiles in environmental epidemiological studies is a promising approach to refine the process of health risk assessment. We aimed to identify potential metabolomics-based profiles in urine and plasma for the detection of relatively low-level cadmium (Cd) exposure in large population-based studies.
Method: We analyzed 123 urinary metabolites and 94 plasma metabolites detected in fasting urine and plasma samples collected from 1,412 men and 2,022 women involved in the Tsuruoka Metabolomics Cohort Study. Regression analysis was performed for urinary N-acetyl-beta-D-glucosaminidase (NAG), plasma, and urinary metabolites as dependent variables, and urinary Cd (U-Cd, quartile) as an independent variable. The multivariable regression model included age, gender, systolic blood pressure, smoking, rice intake, BMI, glycated hemoglobin, low-density lipoprotein cholesterol, alcohol consumption, physical activity, educational history, dietary energy intake, urinary Na/K ratio, and uric acid. Pathway-network analysis was carried out to visualize the metabolite networks linked to Cd exposure.
Result: Urinary NAG was positively associated with U-Cd, but not at lower concentrations (Q2). Among urinary metabolites in the total population, 45 metabolites showed associations with U-Cd in the unadjusted and adjusted models after adjusting for the multiplicity of comparison with FDR. There were 12 urinary metabolites which showed consistent associations between Cd exposure from Q2 to Q4. Among plasma metabolites, six cations and one anion were positively associated with U-Cd, whereas alanine, creatinine, and isoleucine were negatively associated with U-Cd. Our results were robust by statistical adjustment of various confounders. Pathway-network analysis revealed metabolites and upstream regulator changes associated with mitochondria (ACACB, UCP2, and metabolites related to the TCA cycle).
Conclusion: These results suggested that U-Cd was associated with metabolites related to upstream mitochondrial dysfunction in a dose-dependent manner. Our data will help develop environmental Cd exposure profiles for human populations.
1. Introduction
The application of metabolomics-based profiling in environmental epidemiology is a promising approach to refine the process of health risk assessment of environmental chemicals. Mechanism-based metabolomics profiles reveal biologically plausible exposure-response relationships and link exposure and/or early response with critical health endpoints [1–3]. Metabolomics allows the study of multiple processes among the three domains of the exposome (general external, specific, and internal); thus, it helps to elucidate the impact of toxic chemical exposure on human health, clarify the related integrative biological mechanisms, and identify upstream markers for early detection [4–9].
Cadmium is a nephrotoxic chemical found in air, food, water, and particularly in tobacco smoke [10–14]. Urinary N-acetyl-beta-D-glucosaminidase (NAG) leakage is one of the most sensitive clinical marker of renal tubular damage, occurring at a lower level of Cd exposure than the exposure level of β2-microglobulin and α1-microglobulin [10, 12, 15–17]. NAG is, however, excreted into urine at a relatively late stage of Cd-induced damage [18–20]. Thus, the health risk assessments need refinement because of the potential risks at low levels of environmental Cd exposure.
Some previous studies have examined the association between Cd and urinary metabolites [21–24], but none of those reported their results with adjustment for potential confounding factors sufficiently such as dietary energy intake, alcohol consumption, smoking, blood pressure, and blood glucose levels, probably due to insufficient sample size at low Cd levels. Reliability of metabolite measurement for thousands of samples over the long periods is another issue for a large-scale study as technical variability such as large inter-batch variations can introduce measurement error and bias [25, 26].
We thus conducted a large population-based study with well-standardized metabolomics using capillary electrophoresis time-of-flight mass spectrometry (CE-TOFMS) aimed at identifying changes in metabolomic profiles at relatively low Cd exposure level.
2. Methods
Study population and sample collection
The study population consisted of residents in Tsuruoka City, Yamagata Prefecture, where is a typical Japanese rural area and no history of specific Cd pollution. Therefore, the source of residents’ Cd intake was estimated to be from food and smoking mainly. The Tsuruoka Metabolomics Cohort Study (TMCS) is a population-based cohort study initiated in April 2012 involving 11,002 participants of 35–74 years in age who attended annual municipal or workplace health checkup programs held at four city sites during the baseline period (April 2012–March 2015). TMCS was designed to discover metabolomic biomarkers for diseases and disorders related to environmental and genetic factors as described previously [27–30]. In the present study, first-year participants (4,237 participants) were included for Cd quantification in urine. Individuals that did not respond to smoking habit questions; had experienced a stroke, or been diagnosed with ischemic heart disease, cancer, or liver disease; had non-fasting urine and plasma samples; and/or had no urine and plasma samples were excluded from the study (S Fig. 1). Consequently, 1,412 men and 2,022 women were included in the statistical analysis. This study is a cross-sectional study and analyzed baseline participants.
All participants completed a comprehensive questionnaire on lifestyle, dietary habits, and medical history. We also collected biological samples, including serum, urine, plasma, and deoxyribonucleic acid (DNA), along with medical examination data recorded during the health checkup programs at recruitment. Information on drinking and smoking habits, dietary patterns, and level of physical activity was obtained through a structured, self-administered questionnaire, and these data were screened by trained staff using face-to-face interviews. Alcohol intake per week was calculated based on the frequency of alcohol consumption during a typical week and the total alcohol intake on each occasion, which was then divided by seven to obtain the average alcohol intake per day [31]. Smokers were classified as current, past, or non-smokers, and pack-years were studied [32]. Food Frequency Questionnaire (FFQ) and Physical Activity Questionnaire (PAQ) were used to estimate the dietary intake and physical activity of the population [33–35]. To avoid variation due to fasting state and circadian rhythm, urine and plasma samples were collected from each participant at 8:30–10:30 am after an overnight fast. Blood pressure was measured twice in the sitting position using an Omron HBP-T105S-N sphygmomanometer (Omron, Kyoto, Japan), and the mean of the two measurements was used for analysis. Serum levels of cholesterol were analyzed using enzymatic methods; glycated hemoglobin (HbA1c) was determined by immunoassay; and low-density lipoprotein cholesterol (LDL-C) levels were calculated using the Friedwald equation.
Metabolomic measurements
Non-targeted mass spectrometry-based metabolomic profiling was performed using urine and plasma samples with capillary electrophoresis time-of-flight mass spectrometry (CE-TOFMS) as described previously [36–39]. Raw data were analyzed with our proprietary software called MasterHands, which has already been used in several CE-TOF-MS-based profiling studies [40–42]. The data analysis workflow starting with the raw data, included noise-filtering, baseline correction, peak detection, and integration of the peak area from sliced electropherograms. Based on the preliminary investigation described above non-target profiling, we decided to routinely measure the absolute concentrations of 123 urinary metabolites (69 cations and 54 anions) and 94 plasma metabolites (54 cations and 40 anions) that are expected to be consistently measured in most human samples and match the standards in the cohort. These urine and plasma metabolite measurements have been validated for measurement reliability in large-scale epidemiology studies [29, 30].
Quantification of U-Cd and NAG
The U-Cd concentration was determined using atomic absorption spectrophotometry (graphite furnace atomic absorption spectrophotometer, Z-2710, Hitachi High-Tech Science Corporation, Japan). No pretreatment was performed, and samples of urine diluted in an aqueous solution containing a palladium matrix modifier were submitted to the AAS machine, and subsequently dried and ashed on the graphite furnace of the instrument. The Cd standard was purchased from Fujifilm Wako Pure Chemicals Co., Ltd. (100 mg/L, Fujifilm Wako Pure Chemical Co., Osaka, Japan). Palladium matrix modifier (for atomic absorption spectrometry, grade for atomic absorption spectrophotometer, Kanto Chemical Co., Tokyo, Japan) and nitric acid (ultrapure grade, Kanto Chemical Co., Tokyo, Japan) were purchased from Kanto Chemical Co. Ultrapure water purified by a pure water production system (Direct-Q UV, Merck Ltd., Tokyo, Japan) was used for pretreatment and analysis. Two measurements were conducted, and those with a relative standard deviation (RSD) of 15% or more were remeasured. The average of two measurements was used for analysis. For external quality control, we used the German external quality assessment scheme for analyses in biological materials (G-EQUAS) sponsored by the Institute and Out-Patient Clinic for Occupational, Social and Environmental Medicine of the University Erlangen-Nuremberg. We obtained a + rating at the environmental and occupational levels under the scheme. For internal precision control, Seronorm Trace Elements Urine (SERO AS, Billingstad, Norway) and Lyphochek Urine Metals Control (Bio-Rad Laboratories, CA, US) were used to check the accuracy of each analytical lot. The concentration of NAG in the urine was determined using a commercial clinical chemistry laboratory test (Colorimetric method; SRL, Tachikawa, Tokyo, Japan).
Statistical analysis
U-Cd concentration was adjusted for urinary creatinine and classified into quartiles, and the effect of Q2–Q4 in U-Cd was evaluated using Q1 as a reference. NAG was handled as a continuous variable, and its concentration was adjusted for urinary creatinine. First, to clarify Cd exposure-related changes in NAG in this population, we carried out single and multiple regression analysis with NAG (IU g−1 cre) as a dependent variable and the quartiles of U-Cd as an independent variable (unadjusted model; ANOVA by general linear model).
Then, to explore the exposure-related change in urinary and plasma metabolites, single and multiple regression analysis was performed for 123 urine metabolites (69 cations and 54 anions) and 94 plasma metabolites (54 cations and 40 anions) as dependent variables and U-Cd (quartile) as an independent variable. Covariates included in the multiple regression analysis were age (years), sex, systolic blood pressure (SBP; mmHg), smoking (packs yr−1), rice intake (bowls wk−1), body mass index (BMI; kg m−2), HbA1c (%), LDL-C (mg dl−1), alcohol consumption (ethanol intake, g d−1), metabolic equivalent for tasks (METs, quartiles), educational history (<10 years, 10–12 years, and >12 years), dietary energy intake (kcal d−1 quartiles), urinary Na/K ratio, and uric acid (mg dl−1) (adjusted model; ANCOVA by general linear model). Since missing values for metabolites were created by being less than the measurement limit, values of half of the lowest detected values were input for those not detected [28, 30]. The regression equation is described in the following form.
| \begin{equation*}
\text{Y} = \text{aX} + \text{b},\ \text{Y} = \text{NAG or Metabolites, X} = \text{U-Cd}
\end{equation*}
|
For sensitivity analysis, stratification with gender or age (≥65 years old or below) was done. We then excluded ex-smokers and current smokers to evaluate the effect of Cd exposure among non-smokers. We also excluded participants with estimated glomerular filtration rate (eGFR) <60 ml min−1/1.73 m2, those with HbA1c >6.5%, those who prescribed diabetes medications, and those with extremely high/low urinary creatinine concentration (>3.0 g L−1 or <0.3 g L−1). To confirm the results of main analysis, additional analysis with continuous U-Cd as an independent variable was performed. To adjust for multiple comparison, we calculated p values adjusted using the Benjamini–Hochberg procedure for decreasing the false discovery rate (FDR) and screened with the Jonckheere–Terpstra test at the 5% level.
Urinary metabolite levels were adjusted for creatinine levels. Urinary and plasma metabolites were log-transformed and normalized. A mixed model was selected to exclude the effects of batch measurements [43]. All statistical analyses were performed using R 3.5.2 (R Core Team 2018).
Pathway-network analysis
We used Ingenuity Pathway Analysis (IPA) to visualize the metabolite networks linked to Cd exposure [44]. We uploaded the list of coefficient and p values for metabolites for multivariate analysis in the total study population into IPA and set the cutoff at p < 0.05. IPA generated a shortlist of interaction networks around the metabolites of interest merged into a single combined network image (network analysis). The upstream regulators and proteins were predicted from observed urinary metabolites (upstream analysis).
Ethical approval
This study was approved by the Medical Ethics Committee of the School of Medicine, Keio University, Tokyo, Japan (approval no. 20110264). Written informed consent was obtained from all the study participants. All studies were performed according to relevant guidelines and regulations.
3. Results
Table 1 shows the characteristics of the study participants according to the quartiles of Cd exposure. Mean U-Cd concentration in total population was 2.65 ± 1.63 µg g−1) (Table 1). The characteristics for men and women were shown in S Table 1. Average U-Cd was 1.87 ± 1.04 µg g−1, and range of each quartiles were 0.10–1.13 µg g−1 (Q1), 1.13–1.68 µg g−1 (Q2), 1.68–2.33 µg g−1 (Q3) and 2.33–8.54 µg g−1 (Q4) for men, and those for women were 3.20 ± 1.74 µg g−1 (average), 0.13–2.04 µg g−1 (Q1), 2.04–2.90 µg g−1 (Q2); 2.90–4.08 µg g−1 (Q3) and 4.08–25.62 µg g−1 (Q4). Urinary Cd concentration in this population is in the same range as in other non-polluted areas in Japan [45, 46]. Cd exposure increased with age, NAG, rice-intake, and pack-year (whose variables are considered to be associated with Cd) in total population and in each sex. Other variables such as energy intake, HbA1c, LDL-C, and education history also differed between Cd exposure levels in total population and sex stratification (S Table 1). A positive association between Cd exposure and urinary NAG was observed in the multivariate regression analysis in total population. Adjusted difference (95%CI) of NAG compared to Q1 were 0.14 (−0.35, 0.63) µg/g creatinine for Q2, 0.81 (0.29, 1.32) for Q3 and 1.05 (0.52, 1.59) for Q4 (trend p < 0.001), indicating that urinary NAG concentrations increased from Q3. Those for men were −0.07 (−0.90, 0.76) for Q2, 0.27 (−0.60, 1.15) for Q3, and 2.03 (1.11, 2.96) for Q4 (trend p < 0.001), and those for women were 0.13 (−0.48, 0.73), 0.34 (−0.27, 0.95), and 0.95 (0.34, 1.57) (trend p = 0.001), respectively. In U-Cd below 2.31 µg/g Cre (= Q2) in total population and below 1.68 µg/g Cre (= Q2) in men and 2.90 µg/g Cre (= Q2) in women, there is not elevated in NAG.
Table 1 Characteristics in the total study population
| Variable |
Total |
|
|
|
P value |
| Urinary cadmium (U-Cd), Quartiles |
Q1 (n = 859) |
Q2 (n = 858) |
Q3 (n = 858) |
Q4 (n = 859) |
|
| U-Cd (µg/g cre)a |
1.07 [0.10, 1.49] |
1.92 [1.49, 2.31] |
2.79 [2.31, 3.44] |
4.47 [3.44, 25.62] |
<0.001 |
| NAG (IU/g cre)b |
4.30 (3.67) |
5.00 (3.73) |
5.65 (5.07) |
5.95 (4.99) |
<0.001 |
| eGFR (mL/min/1.73 m2)b |
74.5 (13.3) |
73.6 (12.7) |
73.2 (12.3) |
74.0 (12.0) |
<0.001 |
| Sex (male)c |
596 (69.3) |
450 (52.4) |
30.4 (30.4) |
105 (12.2) |
<0.001 |
| Age (years)b |
55.9 (10.5) |
61.7 (7.9) |
63.2 (6.9) |
64.1 (6.1) |
<0.001 |
| BMI (kg/m2)b |
23.7 (3.4) |
23.2 (3.2) |
23.2 (3.1) |
22.8 (3.4) |
<0.001 |
| Smoking (Yes)c |
190 (22.1) |
142 (16.6) |
101 (11.8) |
59 (6.9) |
<0.001 |
| Ex-smoking (Yes)c |
326 (38.0) |
269 (31.3) |
167 (19.5) |
85 (9.9) |
<0.001 |
| Pack year (only smoker)b |
24.4 (17.7) |
29.8 (19.1) |
30.1 (20.9) |
29.3 (22.0) |
<0.001 |
| Rice intake (bowl/week)b |
18.4 (6.4) |
18.6 (5.6) |
18.7 (5.6) |
19.0 (5.3) |
0.004 |
| Energy intake (kcal/day)b |
1857 (435.1) |
1827 (404.6) |
1757 (394.2) |
1672 (341.8) |
<0.001 |
| Ethanol intake (g/day)b |
21.6 (28.8) |
18.0 (26.8) |
11.9 (23.8) |
6.3 (16.7) |
<0.001 |
| Physical activity (METs·hour/week)b |
26.6 (14.9) |
27.3 (14.9) |
27.5 (15.5) |
26.7 (13.2) |
0.353 |
| SBP (mmHg)b |
129.4 (19.0) |
130.3 (19.0) |
130.5 (19.5) |
129.3 (20.0) |
0.313 |
| HbgA1c (%)b |
5.66 (0.65) |
5.71 (0.57) |
5.70 (0.54) |
5.70 (0.55) |
<0.001 |
| LDL-C (mg/dL)b |
142.7 (34.2) |
140.2 (34.4) |
143.5 (31.6) |
141.0 (31.2) |
0.113 |
| Urea acid (mg/dL)b |
5.55 (1.44) |
5.19 (1.32) |
4.89 (1.27) |
4.64 (1.13) |
<0.001 |
| Urinary Na/K ratiob |
2.81 (1.61) |
2.88 (1.55) |
2.79 (1.44) |
3.01 (1.50) |
0.002 |
| Education (years)c |
|
|
|
|
|
| Less than or equal to 9 years (Yes) |
102 (11.9) |
163 (19.0) |
194 (22.6) |
234 (27.2) |
<0.001 |
| 10 to 12 years (Yes) |
476 (55.4) |
478 (55.7) |
478 (55.7) |
467 (54.4) |
0.919 |
| More than 12 years (Yes) |
276 (32.1) |
215 (25.0) |
178 (20.7) |
164 (19.1) |
<0.001 |
eGFR estimated glomerular filtration rate, BMI Body mass index, SBP systolic blood pressure, HbA1c Hemoglobin A1c, LDL-C low-density lipoprotein cholesterol, METs Metabolic equivalent for tasks.
aReported as median (range)
bReported as mean (standard deviation)
cPercent and numbers are shown
Figure 1 shows the association between Cd exposure and urine metabolites in the multivariate regression model (adjusted model) in the total population. Among urinary metabolites in the total population, 45 metabolites (19 cations; trimethylamine N-oxide, alanine [Ala], choline, taurine, 1-methylnicotinamide, asymmetric dimethylarginine [ADMA], uridine, adenosine, ethanolamine, piperidine, 5-aminolevulinate, allantoin, 7-methylguanine, N1-acetylspermidine, N8-acetylspermidine, Glycyl-L-leucine [Gly-Leu], N-epsilon-acetyllysine, S-Adenosylmethionine [SAM+], and 1-methyladenosine and 26 anions; lactate, malonate, 4-oxopentanoate, succinate, isethionate, 5-oxoproline, glutarate, malate, threonate, ethanolamine phosphate, 2-oxoglutarate, pimelate, urate, glycerophosphate, trans-aconitate, cis-aconitate, N-acetylaspartate, azelate, isocitrate, adipate, 3-hydroxy-3-methylglutarate, 2,3-pyridinedicarboxylate, suberate, gluconate, saccharate, and N-acetylneuraminate) showed associations with U-Cd in the unadjusted and adjusted models after adjusting for the multiplicity of comparison with FDR. There were 12 urinary metabolites (alanine, uridine, ethanolamine, piperidine, lactate, 5-oxoproline, ethanolamine phosphate, 2-oxoglutarate, glycerophosphate, cis-aconitate, azelate, and isocitrate) which showed consistent associations between Cd exposure from Q2 to Q4. All urinary metabolites were positively associated with Cd exposure, except for Ala and piperidine, which were negatively associated with Cd exposure. After gender stratification, 8 metabolites had consistently positive associations; Uridine, 5-Aminolvulinate, 1-Methyladenosine, Isethionate, Isethionate, Urate, Isocitrate and Suberate (S Fig. 2). The result by univariate model is shown in S Fig. 3. Statistical summary of results of the multivariate regression model between U-Cd and all urine metabolites (123 metabolites) was exhibited in S Table 2. The result by using a variable of continuous U-Cd is shown in S Table 3.
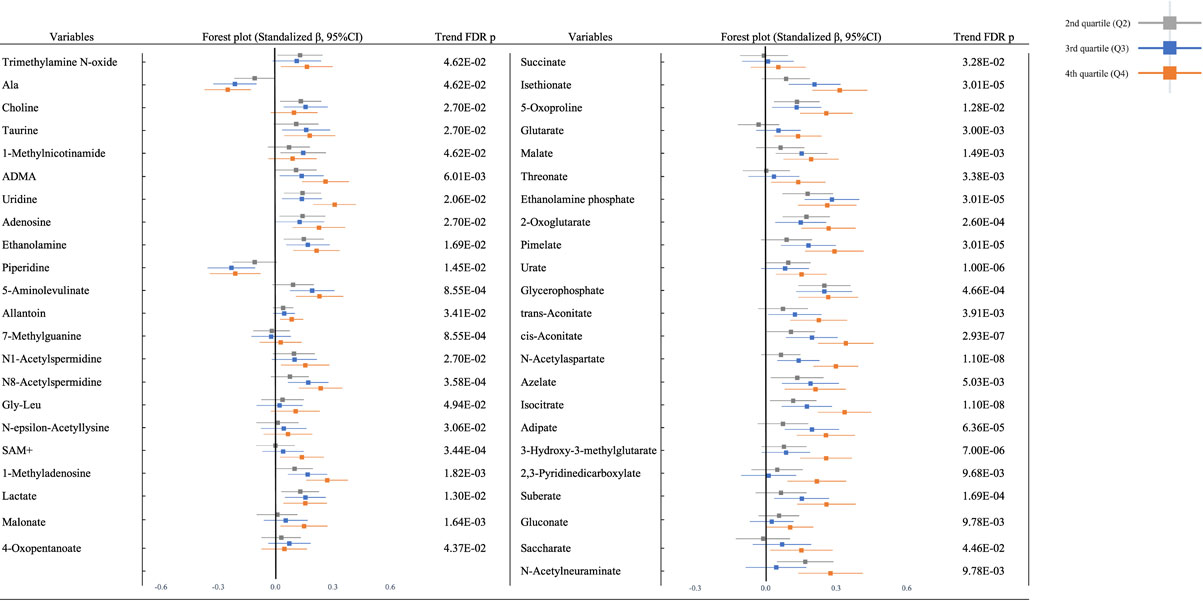
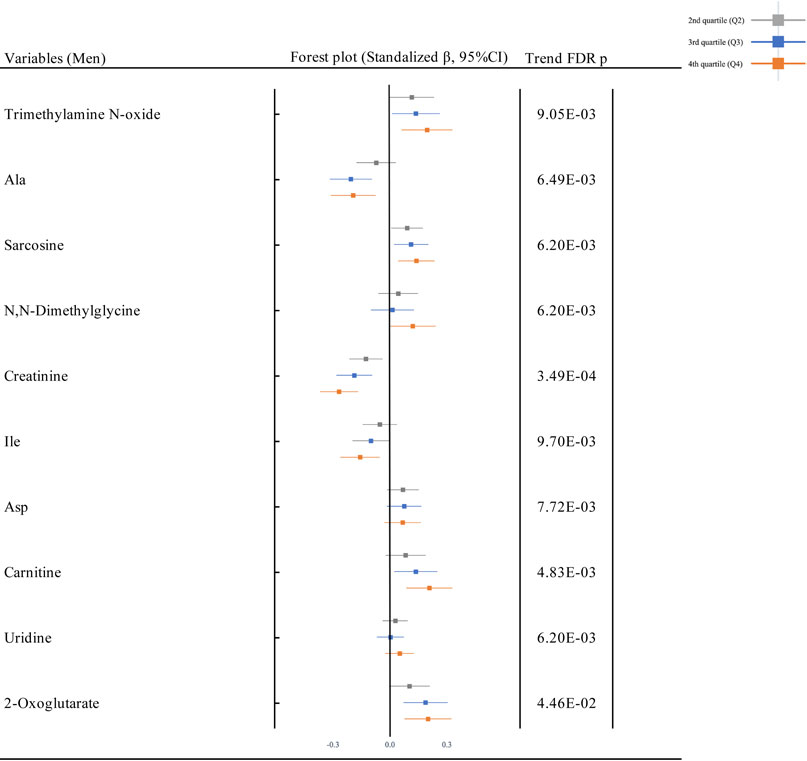
Figure 2 shows the forest plots for the association between Cd exposure and plasma metabolites in the multivariate regression model (adjusted model) in the total population. Among the plasma metabolites in the total population, 10 metabolites (9 cations; trimethylamine N-oxide, Ala, sarcosine, N,N-dimethylglycine, creatinine, isoleucine [Ile], aspartic acid [Asp], carnitine, and uridine, and 1 anion; 2-oxoglutarate) were associated with U-Cd in the unadjusted and adjusted models after adjusting for the multiplicity of comparison with FDR. All plasma metabolites were positively associated with U-Cd, except for Ala, creatinine, and Ile, which were negatively associated with U-Cd. Similar patterns were observed after gender stratification (S Fig. 4). The univariate model is shown in S Fig. 5. Statistical summary of results of the multivariate regression model between U-Cd and all plasma metabolites (94 metabolites) was exhibited in S Table 4. The result by using a variable of continuous U-Cd is shown in S Table 5.
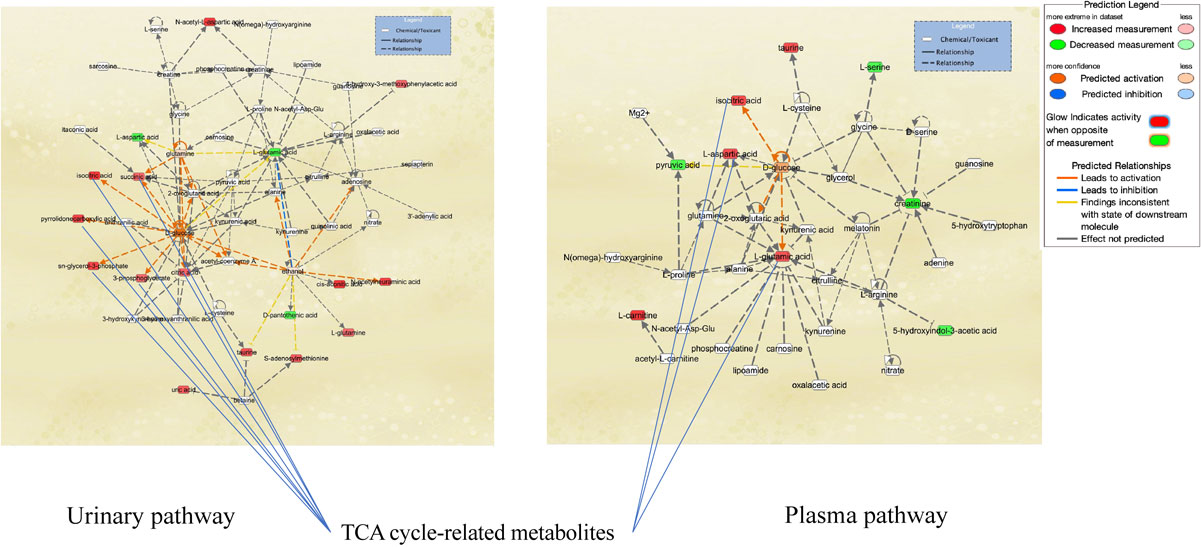

Pathway-network analysis illustrated the biological relationships among metabolites due to Cd exposure (Figs. 2A and 2B). Network analysis revealed tricarboxylic acid (TCA) cycle-related metabolites and the association of Cd exposure with glucose metabolism in the urine and plasma (Fig. 2A). Analysis of upstream regulators and proteins showed changes in the pathways for ACACB, ACE, BCR-ABL1, G6PD, Lao1, RPTOR, and UCP2 in urinary metabolites (Fig. 2B). Pathway-network analysis displayed metabolites and regulator changes associated with mitochondrial disorders (ACACB, UCP2, and metabolites related to the TCA cycle).
The results of the sensitivity analysis showed a similar trend as that of the main analysis with ex-smokers and current smokers excluded (S Fig. 6–10); age-stratified participants, ≥65 years old or not; and high NAG and U-Cd excluded in the total population, men and women (data not shown). The increasing pattern in urinary metabolites (except for Ala and Piperidine) and the pattern in plasma metabolites did not change, maintaining their robustness. Other sensitivity analyses (excluding participants with urinary creatinine >3.0 g L−1 or <0.3 g L−1; excluding participants with estimated glomerular filtration rate (eGFR) <60 ml min−1/1.73 m2; excluding participants with HbA1c >6.5 or prescribed diabetes medications; excluding alcohol consumers were also not different from the main results (S Fig. 11–30)). The association of Cd exposure with urinary metabolites and plasma metabolites did not change even when ex-smokers and current smokers were excluded from the analysis, suggesting that Cd and metabolites may be related to pathways other than smoking (S Fig. 6–10).
4. Discussion
In this study where urinary NAG concentrations increased in the half of the study population (Q3 and Q4 of urinary Cd) within normal eGFR level, 45 urinary metabolites were significantly changed even after adjustment for potential confounders, and 12 urinary metabolites (alanine, uridine, ethanolamine, piperidine, lactate, 5-oxoproline, ethanolamine phosphate, 2-oxoglutarate, glycerophosphate, cis-aconitate, azelate, and isocitrate) showed consistent associations between Cd exposure from Q2 to Q4. According to the Human Metabolome Database [47], 7 out of 12 (alanine, uridine, lactate, 2-oxoglutarate, glycerophosphate, cis-aconitate, and isocitrate) are suggested to be mitochondrial metabolites. Pathway-network analysis of urinary metabolites (Fig. 2B) indicated potential changes in ACACB and UCP2, two mitochondrial proteins expressed in human renal proximal tubular epithelial cells. In vitro studies showed that ACACB controls the rate-limiting step in fatty acid uptake and oxidation by mitochondria, whereas its suppression rescues human proximal tubular cells from Cd-induced lipotoxicity via autophagy [48], and UCP2, an anion transporter, modulates the production of mitochondrial reactive oxygen species (ROS) and plays an essential role in protecting against proximal tubular cell apoptosis and mitochondrial respiratory function [49]. Thus, exposure-related changes in urinary metabolites we observed might reflect early signs of mitochondrial dysfunction due to Cd-induced tubular damage.
So far, two studies indicated the change in urinary metabolites with relation to Cd exposure [21, 24]. Ellis et al. studied with 180 members of the general UK population with low U-Cd concentrations (0.22 µg/g creatinine and 0.34 µg/g creatinine in men and women, respectively), and found that urinary citric acid measured by NMR was associated with U-Cd even after controlling for age, gender, and smoking status. Change in citric acid at lower U-Cd exposure levels is consistent with our results and suggest the potential occurrence of mitochondrial damage. Xu et al. examined in 33 relatively high Cd-exposed women (U-Cd µg/g cre >15, 5–15, <5) living in China, and observed significant the relationship between urinary Cd and urinary metabolites determined by GC-MS including 8 small molecular carbohydrates, 2 amino acids, 2 fatty acids, and 9 metabolic intermediates, including polyol, glycoside sugar acid, and aldehyde acid. The metabolic pathways identified were a variety of carbohydrate metabolism pathways such as the sorbitol pathway, ribose metabolism, galactose metabolism, the transformation of pentose to glucuronide, amino acid metabolism, and the tricarboxylic acid (TCA) cycle, which were consistent with the present study in identifying effects on amino acid metabolism, TCA cycle, etc.
The European Chemicals Agency proposed the application of metabolomics into risk assessment methods (European Chemicals Agency, 2016.). The MEtabolomics standaRds Initiative in Toxicology (MERIT) project reported [50] that the standardization for procedures, measurements and analysis of metabolomics such as defining the chemical exposures and the use of positive biological controls, sample size, the design number of sampling times, randomisation and batching of samples, and ways of QC samples is needed. From the epidemiological viewpoint [51], (1) a larger sample size is necessary to sufficiently adjust for confounders, and (2) QC measurement for metabolites in a large cohort was reported to be essential to reduce random errors and increase accuracy. In the present study, we performed statistical analysis with adjustment for potential important confounders (dietary energy intake, alcohol consumption, smoking, blood pressure, and blood glucose levels) or by various sensitivity analysis with sufficient sample size. Furthermore, it is noteworthy that measurement of urine and plasma metabolites were done with valid QC protocol throughout the assay [29, 30]. Furthermore, CE-MS can identify and quantify a wide range of metabolites [36–39]. CE-MS has been successfully used in numerous clinical applications in recent years compared to other platforms. It is because CE-MS lies in its higher quantification accuracy than other methods like NMR, LC-MS, and HPLC and in the availability of large comparable datasets that were all obtained using the same routine procedure for sample preparation, analysis, and subsequent data evaluation [52–56].
Cadmium exposure in the Japanese population occurs mainly through smoking and rice consumption [57]. Smoking rates have been declining in recent years in Japan [58], but continued efforts to reduce smoking rates are needed. In the case of Japan, rice is the main problem. This is often a problem due to the soil, and since the government is working on soil replacement initiatives [59], it is important to continue these efforts.
Another strength of this study is that plasma metabolites were quantified in the same population at the same time point. Ten plasma metabolites were associated with urinary Cd, and 90% of those are mitochondrial metabolites. A systematic review of clinical applications of metabolomics points out that using multiple biological fluids to analyze metabolic profiles provides greater insight into etiology [60]. In the present study, Cd exposure was negatively associated with plasma concentrations of Ala, creatinine, and Ile, which was reported that a leakage marker of glomeruli damage and hyperfiltration [61, 62]. In this study, we showed that leakage occurs to the extent that elevation of NAG does not occur, and there is the possibility that glomerular hyperfiltration and decrease of nephrons occur because of the decrease in plasma metabolites, creatinine and amino acids, and the broad elevation of urinary metabolites. Cd exposure has been suggested only for tubular disorders, but recent in vivo and in vitro studies have also focused on its effects on glomeruli at early, low concentrations exposure [63, 64]. Thus, combined analysis of urinary and plasma metabolites could lead to better description of toxicological profiles of Cd in humans with deeper mechanistic understanding.
Our study had some limitation, naturally. Since this is a cross-sectional study, reverse causality might be inevitable. Because of long biological half-life of Cd in urine, i.e. 10–30 years, urinary Cd is affected by past exposure, and there was a possibility that the changes in metabolites might reflect recent lifestyle factors such as smoking and food consumption independent of Cd. We thus performed various sensitivity and multivariate-adjusted analysis to confirm the results. We also did not include unmeasured confounding factors including other environmental and occupational chemicals. In this population, there are no obvious renal dysfunction has occurred, however, since urinary NAG is elevated, renal tubular dysfunction has begun, and renal dysfunction is expected to occur in the future. Follow-up investigation is needed for osteoporosis, cardiac disease and etc. in higher exposure population. Another follow-up study is also needed and on-going to evaluate how metabolomics can contribute to refine environmental health risk assessment methods.
Conclusion
Our large-scale epidemiological study with well-standardized metabolomics in urine and plasma can detect Cd toxicity using metabolites. The results were robust using statistical adjustment of potential confounders or sensitivity analysis. Metabolomic profiling might detect the effects of Cd exposure on renal dysfunction at an earlier stage than NAG because metabolites in mitochondria sensitively reflect changes in the upstream regulators of tubular disorders.
Declaration
Ethics approval and consent to participate
This study was approved by the Medical Ethics Committee of the School of Medicine, Keio University, Tokyo, Japan (approval no. 20110264). Written informed consent was obtained from all the study participants. All studies were performed according to relevant guidelines and regulations.
Consent for publication
All authors are consent for publication of this article.
Availability of data and material
The most relevant data are within the paper. Raw data cannot be made publicly available, as study participants did not consent to have their information freely accessible. Based on these terms of consent, the Ethics Committee for Tsuruoka Metabolomics Cohort Study inhibits any public data sharing because data contain potentially identifying or sensitive disease information. This committee includes representatives of Tsuruoka citizens, the administration of Tsuruoka City, a lawyer, and expert advisers. Data accession requests may be sent to the administration of the Ethics Committee for the Tsuruoka Metabolomics Cohort Study. The data will be shared after a review of the purpose and with permission from the ethics committee. Data requests can be made to Sei Harada, seiharada@keio.jp. The source code and analysis generated during the current study are not publicly available, but are available from the corresponding author upon reasonable request.
Competing interests
All authors have no competing interests about this article.
Funding
This study was supported in part by research funds from the Yamagata Prefectural Government (http://www.pref.yamagata.jp/) and the city of Tsuruoka (https://www.city.tsuruoka.lg.jp/), a Grant-in-Aid for Scientific Research (B) (grant numbers JP24390168 and 15H04778), a Grant-in-Aid for Challenging Exploratory Research (grant number 25670303), and a Grant-in-Aid for Scientific Research on Innovative Areas (grant number 16H06277) from the Japan Society for the Promotion of Science (http://www.jsps.go.jp/). The funders had no role in the study design, data collection and analysis, decision to publish, or preparation of the manuscript.
Authors’ contributions
Y.I contributed conceptualization, formal analysis, investigation, methodology, project administration, software, validation, visualization, writing—original draft and writing—review & editing. S.H contributed data curation, formal analysis, funding acquisition, investigation, methodology, project administration, software and writing—review & editing. Y.E contributed measurements, data curation and validation. A.K. contributed data curation and investigation. S.K. contributed data curation and investigation. K.K. contributed data curation and investigation. M.I. contributed data curation and investigation. A.H. contributed data curation, investigation and writing—review & editing. M.M. contributed data curation and investigation. T.S. contributed data curation and investigation. T.O. contributed investigation and writing—review & editing. D.S. contributed investigation and writing—review & editing. A.S. contributed investigation and data curation. K.A. contributed investigation and data curation. A.H. contributed data curation, investigation, methodology, data curation and writing—review & editing. M.S. contributed data curation, methodology, resources and software. T.S. contributed funding acquisition, methodology, resources, supervision. M.T. contributed funding acquisition, methodology, resources, supervision. TT. contributed conceptualization, data curation, funding acquisition, investigation, methodology, project administration, supervision, writing—review & editing. All authors reviewed the manuscript.
Acknowledgements
We thank the residents of Tsuruoka City for their interest in our study and the members of the Tsuruoka Metabolomic Cohort Study team for their commitment to the project. We also thank Emi Maruyama and Kaoru Kayauma for their clerical work.
Pre-print
There is a pre-print open work of this paper [65].
References
- 1. Chadeau-Hyam M, Athersuch TJ, Keun HC, De Iorio M, Ebbels TM, Jenab M, Sacerdote C, Bruce SJ, Holmes E, Vineis P, Meeting-in-the-middle using metabolic profiling - a strategy for the identification of intermediate biomarkers in cohort studies. Biomarkers. 2011;16:83–8. https://doi.org/10.3109/1354750X.2010.533285.
- 2. Vineis P, van Veldhoven K, Chadeau-Hyam M, Athersuch TJ. Advancing the application of omics-based biomarkers in environmental epidemiology. Environ Mol Mutagen. 2013;54:461–7. https://doi.org/10.1002/em.21764.
- 3. Wild CP, Scalbert A, Herceg Z. Measuring the exposome: a powerful basis for evaluating environmental exposures and cancer risk. Environ Mol Mutagen. 2013;54:480–99. https://doi.org/10.1002/em.21777.
- 4. Wild CP. The exposome: from concept to utility. Int J Epidemiol. 2012;41:24–32. https://doi.org/10.1093/ije/dyr236.
- 5. Vineis P, Chadeau-Hyam M, Gmuender H, Gulliver J, Herceg Z, Kleinjans J, Kogevinas M, Kyrtopoulos S, Nieuwenhuijsen M, Phillips DH, Probst-Hensch N, Scalbert A, Vermeulen R, Wild CP; EXPOsOMICS Consortium. The exposome in practice: design of the EXPOsOMICS project. Int J Hyg Environ Health. 2017;220:142–51. https://doi.org/10.1016/j.ijheh.2016.08.001.
- 6. Walker DI, Valvi D, Rothman N, Lan Q, Miller GW, Jones DP. The metabolome: A key measure for exposome research in epidemiology. Curr Epidemiol Rep. 2019;6:93–103.
- 7. Vermeulen R, Schymanski EL, Barabási AL, Miller GW. The exposome and health: where chemistry meets biology. Science. 2020;367:392–6. https://doi.org/10.1126/science.aay3164.
- 8. Kobayashi S, Sata F, Kishi R. Gene-environment interactions related to maternal exposure to environmental and lifestyle-related chemicals during pregnancy and the resulting adverse fetal growth: a review. Environ Health Prev Med. 2022;27:24. https://doi.org/10.1265/ehpm.21-00033.
- 9. Cai Z, Hu W, Wu R, Zheng S, Wu K. Bioinformatic analyses of hydroxylated polybrominated diphenyl ethers toxicities on impairment of adrenocortical secretory function. Environ Health Prev Med. 2022;27:38. https://doi.org/10.1265/ehpm.22-00023.
- 10. Jin T, Nordberg G, Wu X, Ye T, Kong Q, Wang Z, Zhuang F, Cai S. Urinary N-acetyl-beta-D-glucosaminidase isoenzymes as biomarker of renal dysfunction caused by cadmium in a general population. Environ Res. 1999;81:167–73. https://doi.org/10.1006/enrs.1999.3959.
- 11. Olsson IM, Bensryd I, Lundh T, Ottosson H, Skerfving S, Oskarsson A. Cadmium in blood and urine--impact of sex, age, dietary intake, iron status, and former smoking--association of renal effects. Environ Health Perspect. 2002;110:1185–90. https://doi.org/10.1289/ehp.021101185.
- 12. Nordberg GF, Nogawa K, Nordberg M, Friberg LT. Cadmium. In: Nordberg GF, Fowler BA, Nordberg M, Friberg LT, editors. Handbook on the Toxicology of Metals, third ed. Academic Press; 2015. p. 667–716.
- 13. WHO. Exposure to Cadmium: A Major Public Health Concern, 2019 revision. 2019. https://apps.who.int/iris/bitstream/handle/10665/329480/WHO-CED-PHE-EPE-19.4.3-eng.pdf?ua=1.
- 14. WHO. Ten Chemicals of Major Public Health Concern. 2020. https://www.who.int/news-room/photo-story/photo-story-detail/10-chemicals-of-public-health-concern.
- 15. Moriguchi J, Inoue Y, Kamiyama S, Horiguchi M, Murata K, Sakuragi S, Fukui Y, Ohashi F, Ikeda M. N-acetyl-beta-D-glucosaminidase (NAG) as the most sensitive marker of tubular dysfunction for monitoring residents in non-polluted areas. Toxicol Lett. 2009;190:1–8. https://doi.org/10.1016/j.toxlet.2009.05.009.
- 16. Woo HD, Chiu WA, Jo S, Kim J. Benchmark Dose for Urinary cadmium based on a Marker of Renal Dysfunction: A Meta-Analysis. PLoS One. 2015;10:e0126680. https://doi.org/10.1371/journal.pone.0126680.
- 17. Wang X, Wang Y, Feng L, Tong Y, Chen Z, Ying S, Chen T, Li T, Xia H, Jiang Z, Shang Q, Lou X, Lou J. Application of the benchmark Dose (BMD) method to identify thresholds of cadmium-induced renal effects in non-polluted areas in China. PLoS One. 2016;11:e0161240. https://doi.org/10.1371/journal.pone.0161240.
- 18. Vaidya VS, Ferguson MA, Bonventre JV. Biomarkers of acute kidney injury. Annu Rev Pharmacol Toxicol. 2008;48:463–93. https://doi.org/10.1146/annurev.pharmtox.48.113006.094615.
- 19. Prozialeck WC, Edwards JR. Mechanisms of cadmium-induced proximal tubule injury: new insights with implications for biomonitoring and therapeutic interventions. J Pharmacol Exp Ther. 2012;343:2–12.
- 20. Prozialeck WC, VanDreel A, Ackerman CD, Stock I, Papaeliou A, Yasmine C, Wilson K, Lamar PC, Sears VL, Gasiorowski JZ, DiNovo KM, Vaidya VS, Edwards JR. Evaluation of cystatin C as an early biomarker of cadmium nephrotoxicity in the rat. Biometals. 2016;29:131–46.
- 21. Ellis JK, Athersuch TJ, Thomas LD, Teichert F, Pérez-Trujillo M, Svendsen C, Spurgeon DJ, Singh R, Järup L, Bundy JG, Keun HC. Metabolic profiling detects early effects of environmental and lifestyle exposure to cadmium in a human population. BMC Med. 2012;10:61. https://doi.org/10.1186/1741-7015-10-61.
- 22. Gao Y, Lu Y, Huang S, Gao L, Liang X, Wu Y, Wang J, Huang Q, Tang L, Wang G, Yang F, Hu S, Chen Z, Wang P, Jiang Q, Huang R, Xu Y, Yang X, Ong CN. Identifying early urinary metabolic changes with long-term environmental exposure to cadmium by mass-spectrometry-based metabolomics. Environ Sci Technol. 2014;48:6409–18. https://doi.org/10.1021/es500750w.
- 23. Suvagandha D, Nishijo M, Swaddiwudhipong W, Honda R, Ohse M, Kuhara T, Nakagawa H, Ruangyuttikarn W. A biomarker found in cadmium exposed residents of Thailand by metabolome analysis. Int J Environ Res Public Health. 2014;11:3661–77. https://doi.org/10.3390/ijerph110403661.
- 24. Xu Y, Wang J, Liang X, Gao Y, Chen W, Huang Q, Liang C, Tang L, Ouyang G, Yang X. Urine metabolomics of women from small villages exposed to high environmental cadmium levels. Environ Toxicol Chem. 2016;35:1268–75. https://doi.org/10.1002/etc.3274.
- 25. Sampson JN, Boca SM, Shu XO, Stolzenberg-Solomon RZ, Matthews CE, Hsing AW, Tan YT, Ji BT, Chow WH, Cai Q, Liu DK, Yang G, Xiang YB, Zheng W, Sinha R, Cross AJ, Moore SC. Metabolomics in epidemiology: sources of variability in metabolite measurements and implications. Cancer Epidemiol Biomarkers Prev. 2013;22:631–40. https://doi.org/10.1158/1055-9965.EPI-12-1109.
- 26. González-Domínguez R, Jáuregui O, Queipo-Ortuño MI, Andrés-Lacueva C. Characterization of the human exposome by a comprehensive and quantitative large-scale Multianalyte metabolomics platform. Anal Chem. 2020;92:13767–75. https://doi.org/10.1021/acs.analchem.0c02008.
- 27. Iida M, Harada S, Kurihara A, Fukai K, Kuwabara K, Sugiyama D, Takeuchi A, Okamura T, Akiyama M, Nishiwaki Y, Suzuki A, Hirayama A, Sugimoto M, Soga T, Tomita M, Banno K, Aoki D, Takebayashi T. Profiling of plasma metabolites in postmenopausal women with metabolic syndrome. Menopause. 2016;23:749–58. https://doi.org/10.1097/GME.0000000000000630.
- 28. Harada S, Takebayashi T, Kurihara A, Akiyama M, Suzuki A, Hatakeyama Y, Sugiyama D, Kuwabara K, Takeuchi A, Okamura T, Nishiwaki Y, Tanaka T, Hirayama A, Sugimoto M, Soga T, Tomita M. Metabolomic profiling reveals novel biomarkers of alcohol intake and alcohol-induced liver injury in community-dwelling men. Environ Health Prev Med. 2016;21:18–26. https://doi.org/10.1007/s12199-015-0494-y.
- 29. Harada S, Hirayama A, Chan Q, Kurihara A, Fukai K, Iida M, Kato S, Sugiyama D, Kuwabara K, Takeuchi A, Akiyama M, Okamura T, Ebbels TMD, Elliott P, Tomita M, Sato A, Suzuki C, Sugimoto M, Soga T, Takebayashi T. Reliability of plasma polar metabolite concentrations in a large-scale cohort study using capillary electrophoresis-mass spectrometry. PLoS One. 2018;13:e0191230. https://doi.org/10.1371/journal.pone.0191230.
- 30. Ishibashi Y, Harada S, Takeuchi A, Iida M, Kurihara A, Kato S, Kuwabara K, Hirata A, Shibuki T, Okamura T, Sugiyama D, Sato A, Amano K, Hirayama A, Sugimoto M, Soga T, Tomita M, Takebayashi T. Reliability of urinary charged metabolite concentrations in a large-scale cohort study using capillary electrophoresis-mass spectrometry. Sci Rep. 2021;11:7407. https://doi.org/10.1038/s41598-021-86600-9.
- 31. Okamura T, Tanaka T, Yoshita K, Chiba N, Takebayashi T, Kikuchi Y, Tamaki J, Tamura U, Minai J, Kadowaki T, Miura K, Nakagawa H, Tanihara S, Okayama A, Ueshima H; HIPOP-OHP research group. Specific alcoholic beverage and blood pressure in a middle-aged Japanese population: the High-risk and Population Strategy for Occupational Health Promotion (HIPOP-OHP) Study. J Hum Hypertens. 2004;18:9–16. https://doi.org/10.1038/sj.jhh.1001627.
- 32. Janjigian YY, McDonnell K, Kris MG, Shen R, Sima CS, Bach PB, Rizvi NA, Riely GJ. Pack-years of cigarette smoking as a prognostic factor in patients with stage IIIB/IV nonsmall cell lung cancer. Cancer. 2010;116:670–5. https://doi.org/10.1002/cncr.24813.
- 33. Sasaki S, Kobayashi M, Tsugane S; JPHC. Validity of a self-administered food frequency questionnaire used in the 5-year follow-up survey of the JPHC Study Cohort I: comparison with dietary records for food groups. J Epidemiol. 2003;13(1 Suppl):S57–63. https://doi.org/10.2188/jea.13.1sup_57.
- 34. Inoue M, Yamamoto S, Kurahashi N, Iwasaki M, Sasazuki S, Tsugane S; Japan Public Health Center-based Prospective Study Group. Daily total physical activity level and total cancer risk in men and women: results from a large-scale population-based cohort study in Japan. Am J Epidemiol. 2008;168:391–403. https://doi.org/10.1093/aje/kwn146.
- 35. Kikuchi H, Inoue S, Odagiri Y, Ihira H, Inoue M, Sawada N, Noda M, Tsugane S. Intensity-specific validity and reliability of the Japan Public Health Center-based prospective study-physical activity questionnaire. Prev Med Rep. 2020;20:101169. https://doi.org/10.1016/j.pmedr.2020.101169.
- 36. Soga T, Igarashi K, Ito C, Mizobuchi K, Zimmermann HP, Tomita M. Metabolomic profiling of anionic metabolites by capillary electrophoresis mass spectrometry. Anal Chem. 2009;81:6165–74. https://doi.org/10.1021/ac900675k.
- 37. Sugimoto M, Wong DT, Hirayama A, Soga T, Tomita M. Capillary electrophoresis mass spectrometry-based saliva metabolomics identified oral, breast and pancreatic cancer-specific profiles. Metabolomics. 2010;6:78–95. https://doi.org/10.1007/s11306-009-0178-y.
- 38. Hirayama A, Nakashima E, Sugimoto M, Akiyama S, Sato W, Maruyama S, Matsuo S, Tomita M, Yuzawa Y, Soga T. Metabolic profiling reveals new serum biomarkers for differentiating diabetic nephropathy. Anal Bioanal Chem. 2012;404:3101–9. https://doi.org/10.1007/s00216-012-6412-x.
- 39. Hirayama A, Sugimoto M, Suzuki A, Hatakeyama Y, Enomoto A, Harada S, Soga T, Tomita M, Takebayashi T. Effects of processing and storage conditions on charged metabolomic profiles in blood. Electrophoresis. 2015;36:2148–55. https://doi.org/10.1002/elps.201400600.
- 40. Hirayama A, Kami K, Sugimoto M, Sugawara M, Toki N, Onozuka H, Kinoshita T, Saito N, Ochiai A, Tomita M, Esumi H, Soga T. Quantitative metabolome profiling of colon and stomach cancer microenvironment by capillary electrophoresis time-of-flight mass spectrometry. Cancer Res. 2009;69:4918–25. https://doi.org/10.1158/0008-5472.CAN-08-4806.
- 41. Minami Y, Kasukawa T, Kakazu Y, Iigo M, Sugimoto M, Ikeda S, Yasui A, van der Horst GT, Soga T, Ueda HR. Measurement of internal body time by blood metabolomics. Proc Natl Acad Sci USA. 2009;106:9890–5. https://doi.org/10.1073/pnas.0900617106.
- 42. Saito N, Robert M, Kochi H, Matsuo G, Kakazu Y, Soga T, Tomita M. Metabolite profiling reveals YihU as a novel hydroxybutyrate dehydrogenase for alternative succinic semialdehyde metabolism in Escherichia coli. J Biol Chem. 2009;284:16442–51. https://doi.org/10.1074/jbc.M109.002089.
- 43. Straube J, Gorse AD, PROOF Centre of Excellence Team, Huang BE, Lê Cao KA. A linear mixed model spline framework for analysing Time Course ‘omics’ data. PLoS One. 2015;10:e0134540. https://doi.org/10.1371/journal.pone.0134540.
- 44. Krämer A, Green J, Pollard J Jr, Tugendreich S. Causal analysis approaches in Ingenuity Pathway Analysis. Bioinformatics. 2014;30:523–30. https://doi.org/10.1093/bioinformatics/btt703.
- 45. Suwazono Y, Nogawa K, Morikawa Y, Nishijo M, Kobayashi E, Kido T, Nakagawa H, Nogawa K. All-cause mortality increased by environmental cadmium exposure in the Japanese general population in cadmium non-polluted areas. J Appl Toxicol. 2015;35:817–23. https://doi.org/10.1002/jat.3077.
- 46. Ezaki T, Tsukahara T, Moriguchi J, Furuki K, Fukui Y, Ukai H, Okamoto S, Sakurai H, Honda S, Ikeda M. No clear-cut evidence for cadmium-induced renal tubular dysfunction among over 10,000 women in the Japanese general population: a nationwide large-scale survey. Int Arch Occup Environ Health. 2003;76:186–96. https://doi.org/10.1007/s00420-002-0389-2.
- 47. Wishart DS, Feunang YD, Marcu A, Guo AC, Liang K, Vázquez-Fresno R, et al. HMDB 4.0: the human metabolome database for 2018. Nucleic Acids Res. 2018;46:D608–17. https://doi.org/10.1093/nar/gkx1089.
- 48. Zhong X, He J, Zhang X, Li C, Tian X, Xia W, Gan H, Xia Y. UCP2 alleviates tubular epithelial cell apoptosis in lipopolysaccharide-induced acute kidney injury by decreasing ROS production. Biomed Pharmacother. 2019;115:108914. https://doi.org/10.1016/j.biopha.2019.108914.
- 49. Wang SH, Shih YL, Kuo TC, Ko WC, Shih CM. Cadmium toxicity toward autophagy through ROS-activated GSK-3beta in mesangial cells. Toxicol Sci. 2009;108:124–31. https://doi.org/10.1093/toxsci/kfn266.
- 50. Viant MR, Ebbels TMD, Beger RD, Ekman DR, Epps DJT, Kamp H, Leonards PEG, Loizou GD, MacRae JI, van Ravenzwaay B, Rocca-Serra P, Salek RM, Walk T, Weber RJM. Use cases, best practice and reporting standards for metabolomics in regulatory toxicology. Nat Commun. 2019;10:3041. https://doi.org/10.1038/s41467-019-10900-y.
- 51. Playdon MC, Joshi AD, Tabung FK, Cheng S, Henglin M, Kim A, et al. Metabolomics analytics workflow for epidemiological Research: Perspectives from the Consortium of Metabolomics Studies (COMETS). Metabolites. 2019;9:145. https://doi.org/10.3390/metabo9070145.
- 52. Soga T, Ishikawa T, Igarashi S, Sugawara K, Kakazu Y, Tomita M. Analysis of nucleotides by pressure-assisted capillary electrophoresis-mass spectrometry using silanol mask technique. J Chromatogr A. 2007;1159:125–33. https://doi.org/10.1016/j.chroma.2007.05.054.
- 53. Mischak H, Schanstra JP. CE-MS in biomarker discovery, validation, and clinical application. Proteomics Clin Appl. 2011;5(1–2):9–23. https://doi.org/10.1002/prca.201000058.
- 54. Robledo VR, Smyth WF. Review of the CE-MS platform as a powerful alternative to conventional couplings in bio-omics and target-based applications. Electrophoresis. 2014;35:2292–308. https://doi.org/10.1002/elps.201300561.
- 55. Buko A. Capillary electrophoresis mass spectrometry based metabolomics. J Appl Bioanal. 2017;3:5–20. https://doi.org/10.17145/jab.17.002.
- 56. Ramautar R, Somsen GW, de Jong GJ. CE-MS for metabolomics: Developments and applications in the period 2016–2018. Electrophoresis. 2019;40(1):165–79. https://doi.org/10.1002/elps.201800323.
- 57. Horiguchi H. Nihon Eiseigaku Zasshi. 2012;67(4):447–54. https://doi.org/10.1265/jjh.67.447.
- 58. Tabuchi T, Nakamura M, Nakayama T, Miyashiro I, Mori J, Tsukuma H. Tobacco Price Increase and Smoking Cessation in Japan, a Developed Country With Affordable Tobacco: A National Population-Based Observational Study. J Epidemiol. 2016;26(1):14–21. https://doi.org/10.2188/jea.JE20140183.
- 59. Ministry of Agriculture, Forestry and Fisheries. Implementation Guidelines for Reducing Cadmium in Rice. 2018. https://www.maff.go.jp/j/syouan/nouan/kome/k_cd/2_taisaku/attach/pdf/01_tec-11.pdf.
- 60. Yang Q, Zhang AH, Miao JH, Sun H, Han Y, Yan GL, Wu FF, Wang XJ. Metabolomics biotechnology, applications, and future trends: a systematic review. RSC Advances. 2019;9(64):37245–57. https://doi.org/10.1039/c9ra06697g.
- 61. Lee H, Jang HB, Yoo MG, Park SI, Lee HJ. Amino Acid Metabolites Associated with Chronic Kidney Disease: An Eight-Year Follow-Up Korean Epidemiology Study. Biomedicines. 2020;8(7):222. https://doi.org/10.3390/biomedicines8070222.
- 62. Rossitto G, Maiolino G, Lerco S, Ceolotto G, Blackburn G, Mary S, Antonelli G, Berton C, Bisogni V, Cesari M, Seccia TM, Lenzini L, Pinato A, Montezano A, Touyz RM, Petrie MC, Daly R, Welsh P, Plebani M, Rossi GP, Delles C. High sodium intake, glomerular hyperfiltration, and protein catabolism in patients with essential hypertension. Cardiovasc Res. 2021;117(5):1372–81. https://doi.org/10.1093/cvr/cvaa205.
- 63. Li M, Liu X, Zhang Z. Hyperglycemia exacerbates cadmium-induced glomerular nephrosis. Toxicol Ind Health. 2021;37:555–63. https://doi.org/10.1177/07482337211037880.
- 64. Chen X, Li L, Liu F, Hoh J, Kapron CM, Liu J. Cadmium induces glomerular endothelial cell-specific expression of complement factor H via the –1635 AP-1 Binding Site. J Immunol. 2019;202:1210–8. https://doi.org/10.4049/jimmunol.1800081.
- 65. Ishibashi Y, Harada S, Eitaki Y, Kurihara A, Kato S, Kuwabara K, Iida M, Hirata A, Sata M, Matsumoto M, Shibuki T, Okamura T, Sugiyama D, Sato A, Amano K, Hirayama A, Sugimoto M, Soga T, Tomita M, Takebayashi T. A Population-Based Urinary and Plasma Metabolomics Study of Environmental Exposure to Cadmium. Available at SSRN: http://dx.doi.org/10.2139/ssrn.4216327.
