2. Experimental
2.1 Fabrication of electrodes and electrochemical cells
Li[Li1/3Ti5/3]O4 (LTO; Ishihara Sangyo Co., Ltd.) and Li[Li0.1Al0.1Mn1.8]O4 (LAMO; Tosoh Corp.) were used as active materials. The electrodes consisted of 88 wt% active material, 6 wt% acetylene black, and 6 wt% polyvinylidene fluoride (PVDF). A slurry prepared by adding a mixture of the active materials, acetylene black, and PVDF into an N-methyl-2-pyrrolidone solution was cast onto an Al foil as a current collector, which was then dried under vacuum at 150 °C overnight. After drying, a disk (16 mm diameter, 2 cm2) was punched out and used as the electrode. The electrode weight and thickness were 30–35 mg and 118–135 µm, respectively, for the LTO electrodes and 27–39 mg and 100–121 µm, respectively, for the LAMO electrodes. Two sheets of Celgard 2320 were used as separators. A 0.2 mL solution of 1 M LiPF6 dissolved in ethylene carbonate/dimethyl carbonate (3/7 by volume) was used as the electrolyte. The cell structure and fabrication procedure have been described previously.19
2.2 Overdischarge tests for the LTO/LAMO cells
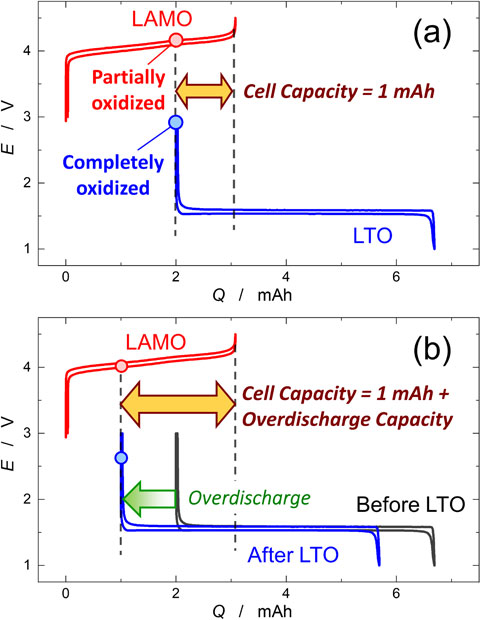
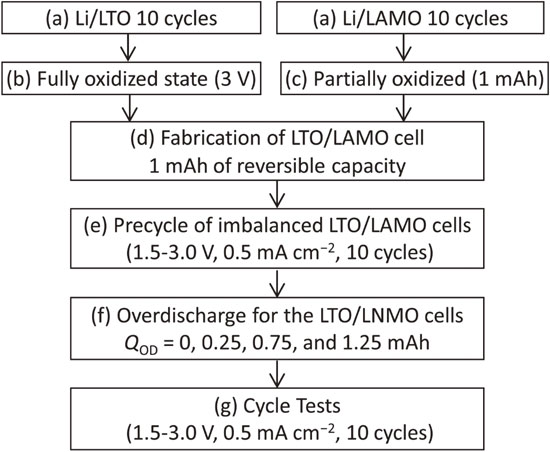
Figure 1 shows the scheme of the procedure for the overdischarge tests for the LTO/LAMO cell. Both the LTO and LAMO electrodes were preliminarily examined in a Li half-cell to confirm their voltage profiles and reversible capacity (Fig. 1a). Before fabricating the LTO/LAMO cells, the LTO electrode was oxidized fully at 3 V (Fig. 1b), while the LAMO electrode was charged to 4.5 V and then discharged (reduced) by 1 mAh (Fig. 1c). The fabricated LTO/LAMO cells were pre-cycled at 0.5 mA cm−2 and 25 °C for 10 cycles (Fig. 1e). A schematic illustration of the overdischarge tests for the LTO/LAMO cell is shown in Fig. 2. As the cell capacity was limited by the LAMO positive and LTO negative electrodes during charging and discharging, respectively, the cell had a capacity of only 1 mAh (Fig. 2a). This created a state in which the cell capacity faded owing to the imbalanced SOC between the positive and negative electrodes.14 In the overdischarge tests, the cell was discharged once to 1.5 V at a constant current density of 0.5 mA cm−2, and then overdischarged with various capacities (namely overdischarge capacity, QOD = 0.25, 0.75, 1.25 mAh) (Fig. 1f). During overdischarge, as the LAMO positive electrode had residual discharge capacity, lithium insertion (reduction) occurred. In contrast, lithium insertion could not occur at the LTO negative electrode because it was fully oxidized; thus oxidative decomposition of the electrolyte occurred at the LTO electrode. Therefore, by overdischarging the LTO/LAMO cell, the SOC of the LAMO electrode changed, whereas that of the LTO electrode remained unchanged, as shown in Fig. 2b. Consequently, the overdischarge capacity (QOD) was added to the cell capacity after overdischarge. After the overdischarge, a cycle test was performed for 150 cycles under the same conditions as the pre-cycle (Fig. 1g). Electrochemical tests were performed using a charge-discharge tester (Battery Laboratory System, Keisokuki Center Co. Ltd. Japan) was used.
The side-reaction currents of the LTO negative and LAMO positive electrodes were calculated as follows. First, the charge-end and discharge-end capacities (CQCha and CQDis) were estimated from continuous charge-discharge curves, where the discharge and charge curves were drawn starting from the end of the previous charge and discharge curves, respectively. When the cell capacity for charge and discharge was limited by the capacities of the LAMO positive and LTO negative electrodes, respectively, CQCha and CQDis were determined by the following equations:19,22
| \begin{equation}
CQ_{\text{Cha}} (t) = Q_{\text{Cell}} + \int I_{\text{SR,LAMO}}\text{d}t,
\end{equation}
| (1) |
and
| \begin{equation}
CQ_{\text{Dis}} (t) = \int I_{\text{SR,LTO}} \text{d}t
\end{equation}
| (2) |
where
QCell is the initial cell capacity, and
t is the cycle time. By modifying the above equations, the following equations were derived to determine the side-reaction currents of LTO and LMAO,
ISR,LTO and
ISR,LAMO, respectively.
| \begin{equation}
I_{\text{SR,LAMO}} = \text{d}CQ_{\text{Cha}} (t)/\text{d}t,
\end{equation}
| (3) |
and
| \begin{equation}
I_{\text{SR,LTO}} = \text{d}CQ_{\text{Dis}} (t)/\text{d}t
\end{equation}
| (4) |
Therefore, when
CQCha and
CQDis were plotted against cycling time, namely cumulative capacity plots,
19,22 ISR,LAMO and
ISR,LTO corresponded to the slopes of the lines of
CQCha and
CQDis, respectively.
3. Results and Discussion
3.1 Procedure for capacity recovery by overdischarge tests
Figure 3 shows the continuous charge-discharge curves of the LTO/LAMO cells during the overdischarge tests. During overdischarge, the cell voltage dropped sharply to approximately −1.0 V, and then gradually decreased to −1.8 V. If lithium insertion occurred in the LAMO positive electrode during overdischarge, the electrode potential of the LAMO was maintained at approximately 4.1 V vs. Li. Therefore, when the cell voltage dropped to −1.5 V, the electrode potential of the LTO negative electrode rose to 5.7 V. Therefore, the voltage plateau at −1.5 V during overdischarge indicates that oxidative decomposition of the electrolyte occurred on the LTO negative electrode.23–27 Immediately after the overdischarge, the cell voltage increased sharply and became constant at 2.5 V. This indicates that lithium insertion occurred in both the LTO and LAMO electrodes,28–30 because the electrode potential was 1.5 V vs. Li for the LTO31–34 and 4.1 V vs. Li for the LAMO.35,36 The cell capacity clearly increased immediately after overdischarge, and the increase was proportional to the overdischarge capacity QOD. However, the cell capacity decreased in the subsequent cycles. It is noticed that the amount of electrolyte decomposed due to overdischarge is less than 0.05 mmol, which is smaller than the amount of electrolyte in the cell (0.2 mmol). Therefore, there is no significant change in the concentration of electrolyte solution in the cell.
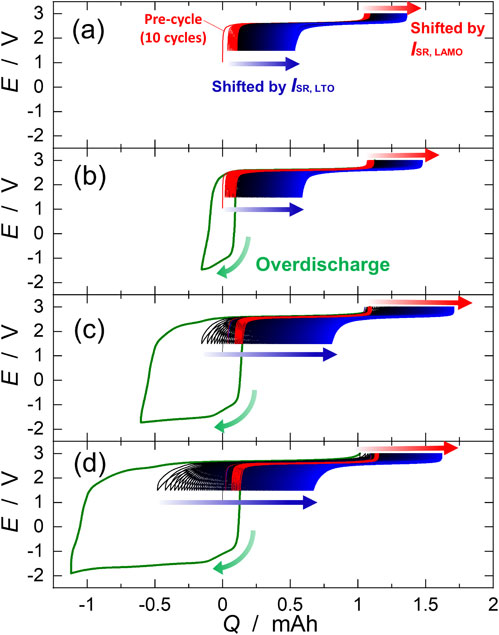
Figure 4 shows the cell capacity during the over-discharge tests. The initial cell capacity was 1.01 to 1.07 mAh for all cells; after 10 cycles it was essentially unchanged, 0.96 to 1.03 mAh. The charge capacities of the cells immediately after overdischarge were 1.27, 1.70, and 2.28 mAh for QOD = 0.25, 0.75, and 1.25 mAh, respectively, indicating that the cell capacity increased by QOD. The subsequent discharge capacity was 1.11, 1.24, and 1.50 mAh for QOD = 0.25, 0.75, and 1.25 mAh, respectively. These values were significantly lower than the charge capacity but were clearly higher than the capacity before overdischarge. The increased cell capacity after overdischarge means that the capacity loss caused by the SOC imbalance of the positive and negative electrodes could be recovered by overdischarging the cell. During overdischarge, oxidative decomposition of the electrolyte occurred at the LTO negative electrode, whereas the discharge reaction occurred at the LAMO positive electrode. Consequently, overdischarge changed the SOC of the LAMO electrode, despite the uncharged SOC of the LTO electrode.

Unfortunately, the cell capacity gradually decreased in the subsequent cycles. The capacity fading was faster for a larger QOD. The cell capacity at the 150th cycle after overdischarge was 0.89, 0.90, and 0.95 mAh for QOD = 0.25, 0.75, and 1.25 mAh, respectively. These values were similar to the capacity of the cell without overdischarge (0.83 mAh). The capacity recovered by overdischarge diminished in subsequent cycles owing to more severe capacity fading in the cells with a larger QOD. This suggests that the side-reaction current in the positive and negative electrodes was greatly altered after overdischarge; thereby, the SOC balance between the LAMO positive and LTO negative electrodes returned to its original state.
3.2 Calculation of side-reaction current in overdischarged LTO/LAMO cells
To clarify the cause of the reduced recovered capacity after overdischarge of the LTO/LAMO cells, the side-reaction currents of the LAMO positive and LTO negative electrodes (ISR,LTO and ISR,LAMO) were calculated. The side-reaction currents were calculated from cumulative capacity plots, where the charge-end and discharge-end capacities (CQCha and CQDis) were plotted against cycling time. According to Eqs. 3 and 4, the cumulative capacity plots shown in Fig. 5, the slopes of CQDis and CQCha correspond to ISR,LTO, ISR,LAMO, respectively.
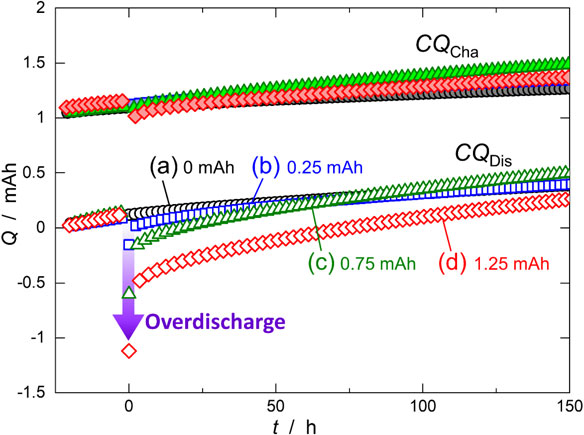
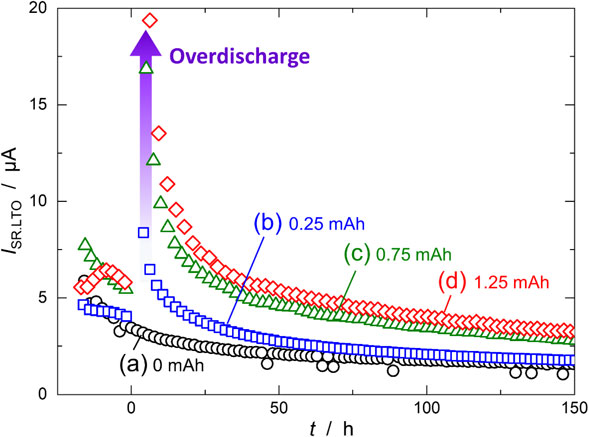
Figure 6 shows ISR,LTO calculated from the slope of the CQDis in the cumulative capacity plots in Fig. 5. ISR,LTO was 5 µA before overdischarge (t < 0 h), but just after overdischarge (t ∼ 0 h), it increased significantly depending on QOD; 8.4, 16.9, and 19.4 µA for QOD = 0.25, 0.75, and 1.25 mAh, respectively. This indicates that oxidative decomposition products generated at the LTO electrode during overdischarge were reduced at the LTO electrode. During the cycles after overdischarge (t > 0 h), ISR,LTO largely decreased with increasing QOD, and after 50 h, it asymptotically reached a constant value. After the final cycle (t = 150 h), ISR,LTO was 1.9, 3.0, and 3.5 µA for QOD = 0.25, 0.75, and 1.25 mAh, respectively. These values were slightly larger than the value without overdischarge (1.6 µA).
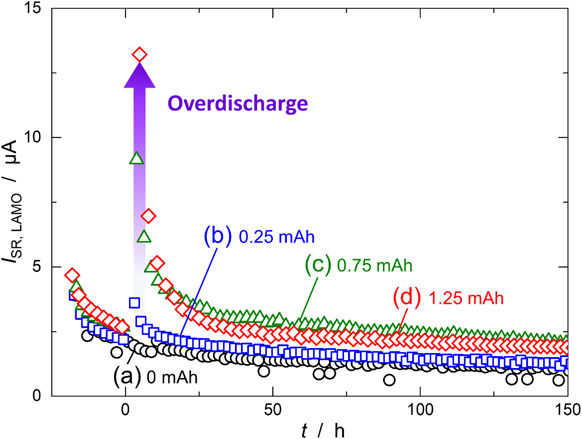
ISR,LAMO was also calculated from the slope of CQCha (Fig. 7). Before overdischarge (t < 0 h), ISR,LAMO was ∼2.5 µA, which was smaller than ISR,LTO. This means that electrolyte decomposition at the LAMO electrode was slower than at the LTO electrode, in agreement with previous reports.19 Immediately after overdischarge (t ∼ 0 h), ISR,LAMO increased with increasing QOD: 3.6, 9.1 and 13.2 µA for QOD = 0.25, 0.75 and 1.25 mAh, respectively. The increase in ISR,LAMO might have been caused by the reductive decomposition products generated at the LTO negative electrode during the overdischarge being oxidized at the LAMO positive electrode. After overdischarge (t > 0 h), ISR,LAMO showed the same trend as ISR,LTO; it rapidly decreased and then asymptotically approached a constant value. After the final cycle (t = 150), ISR,LAMO was 1.3, 2.2, and 1.9 µA for QOD = 0.25, 0.75, and 1.25 mA, respectively. These values were slightly higher than for the cell without overdischarge (1.1 µA).
Based on the cell mass balance,14 the capacity fading of the cell is proportional to the difference in the side-reaction currents, Qfade = |ISR,LTO − ISR,LAMO| × t. Before overdischarge, the difference was very low (<2 µA), resulting in very slow capacity fading. However, the difference dramatically increased due to overdischarge because ISR,LTO increased significantly more than ISR,LAMO. After the overdischarge, the difference in the side-reaction currents reached ∼5 µA, which was more than twice that before the overdischarge. Consequently, the recovered capacity was reduced owing to the change in side-reaction currents.
To explain the loss of recovered capacity, the following reaction mechanism is proposed by considering the side reactions at the LTO electrode. Before overdischarge (Fig. 8a), a side reaction due to reductive decomposition of the electrolyte occurred at the LTO negative electrode. The side reaction was slow because of the relatively high LTO electrode potential (1.55 V vs. Li), indicating that the side-reaction current ISR,LTO was small. This explanation agrees well with the results shown in Fig. 6, where ISR,LTO was small for t < 0 h. When the LTO/LAMO cell was overdischarged, oxidative decomposition of the electrolyte occurred at the LTO electrode, which generated a high concentration of oxidants, COx, in the electrolyte (Fig. 8b). During overdischarge, QOD affected the SOC of only the LAMO positive electrode, thereby increasing the cell capacity. Because COx was high immediately after overdischarge, a side reaction at the LTO electrode occurred due to the reduction of its oxidant (Fig. 8c). Therefore, ISR,LTO was increased significantly by overdischarge, which is consistent with the significantly increased ISR,LTO at t ∼ 0 h. In the cycle after overdischarge, the oxidant was no longer generated; thus, COx decreased because of the reduction of the oxidant at the LTO electrode. Because the rate of the reduction of the oxidants is proportional to COx,21 ISR,LTO decreased with the cycling time. This assumption can explain why ISR,LTO gradually decreased with cycling time.

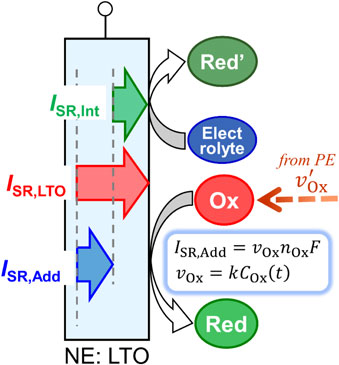
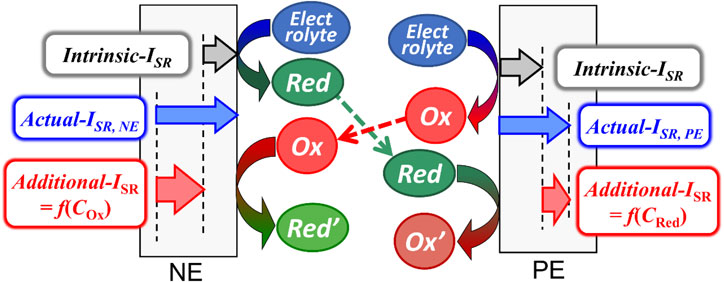
Figure 9 shows a schematic of the side reactions at the LTO negative electrode. At the LTO electrode, the electrolyte continuously decomposes to generate a reductant (Red′), which corresponds to an “intrinsic” side-reaction current (ISR,Int). Because there is sufficient electrolyte in the cell, ISR,Int can be considered constant. In addition, the oxidant (Ox) generated at the LAMO positive electrode is transported to the LTO negative electrode and reacts to produce the reductant (Red), which corresponds to an “additional” side-reaction current (ISR,Add) at the LTO negative electrode. Therefore, the actual side-reaction current of the LTO negative electrode is the sum of the two side-reaction currents ISR,Int and ISR,Add.
Based on the schematic diagram, we derived a kinetic equation for the side-reaction current at the LTO electrode to fit the observed-ISR,LTO curves shown in Fig. 6. The time variation of COx [mol cm−3] near the LTO electrode (dCOx(t)/dt) was determined by the supply rate vOx′ [mol s−1] of the oxidant generated at the LAMO positive electrode and the consumption rate vOx [mol s−1] of the oxidant at the LTO negative electrode.
| \begin{equation}
\frac{dC_{\text{Ox}}(t)}{dt} = \frac{1}{V} (v_{\text{Ox}}{}^{\prime} - v_{\text{Ox}})
\end{equation}
| (5) |
where
V [cm
3] is the amount of the electrolyte in the cell. According to our previous study,
21 ISR,Add is correlated with the concentration of the oxidant,
COx, and follows first-order kinetics. Thus,
vOx can be expressed using Eq. 6.
| \begin{equation}
v_{\text{Ox}}\ [\text{mol/sec}] = k\ [\text{cm$^{3}$/sec}]\times C_{\text{Ox}} (t)\ [\text{mol/cm$^{3}$}]
\end{equation}
| (6) |
where
k is the rate constant for reduction of the oxidant. Substituting Eq. 6 into Eq. 5 gives Eq. 7:
| \begin{equation}
\frac{dC_{\text{Ox}} (t)}{dt} = \frac{1}{V}(v'_{\text{Ox}} - kC_{\text{Ox}} (t))
\end{equation}
| (7) |
Solving this differential equation for
COx(
t) yields Eq. 8, assuming that
vOx′ is a constant independent of
t, and that this assumption is valid for
t > 50 h from Fig.
7 because of the almost constant
ISR,LAMO in that time region.
| \begin{equation}
v_{\text{Ox}} = v'_{\text{Ox}} + \{ k \cdot C_{\text{Ox}} (50) - v'_{\text{Ox}}\}\exp \left(-\frac{k}{V}t \right)
\end{equation}
| (8) |
(50) is the concentration of the oxidant at
t = 50 h. As shown in Eq. 9,
vOx is correlated to the additional side-reaction current
ISR,Add.
| \begin{equation}
v_{\text{Ox}}\ [\text{mol/sec}] = \frac{I_{\text{SR,Add}}\ [\text{A}]}{n_{\text{Ox}} \times F\ [\text{C/mol}]}
\end{equation}
| (9) |
Here,
nOx is the number of electrons participating in the reduction reaction and
F is the Faraday constant. Substituting Eq. 9 into Eq. 8 yields Eq. 10, expressing the time variation of
ISR,Add.
| \begin{align}
&I_{\text{SR,Add}} (t) \\
&\quad= n_{\text{Ox}} \cdot F \cdot v'_{\text{Ox}} + n_{\text{Ox}} \cdot F \cdot \{ k \cdot C_{\text{Ox}} (50) - v'_{\text{Ox}} \}\exp \left( -\frac{k}{V}t \right)
\end{align}
| (10) |
From
ISR,LTO =
ISR,Int +
ISR,Add,
| \begin{equation}
I_{\text{SR,LTO}} (t) = I_{\text{SR,Int}} + \alpha + \{ \beta C_{\text{Ox}} (50) - \alpha \} \exp (\gamma t)
\end{equation}
| (11) |
| \begin{equation}
\alpha = n_{\text{Ox}}Fv'_{\text{Ox}},\quad \beta = n_{\text{Ox}} Fk,\quad \gamma = -\frac{k}{V}
\end{equation}
| (12) |
In Eq. 11, the side-reaction current of the LTO negative electrode can be expressed by the concentration of the oxidant at
t = 50 h and the four parameters
α,
β,
γ and
ISR,Int.
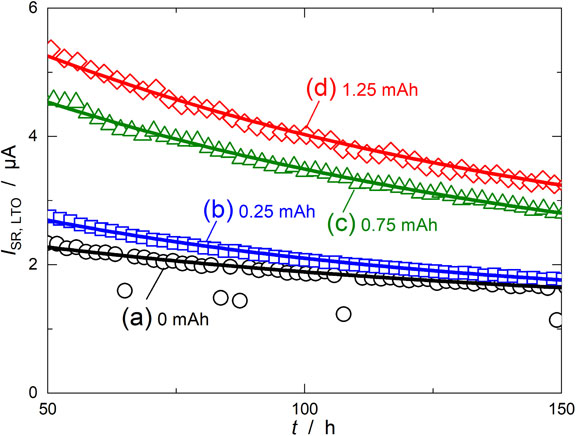
To verify the validity of the model, the calculated-ISR,LTO derived from formula 11 was used to fit the observed-ISR,LTO shown in Fig. 6. Since our earlier work showed that ISR,Int at the LTO electrode was negligible (∼0.2 µA),22 we ignored ISR,Int for fitting. Figure 10 shows the fitting results of ISR,LTO for each QOD with β × COx(50), γ, and ISR,Int as variable parameters. For any QOD, the calculated-ISR,LTO reproduced the observed values well in the region after 50 h. The average values of errors in observed- and calculated-ISR,LTO were at most 30 nA; 15 nA for QOD = 0 mAh, 15 nA for QOD = 0.25 mAh, 20 nA for QOD = 0.75 mAh, and 32 nA for QOD = 1.25 mAh. The errors were less than 1 %, confirming that the calculated values agreed well with the observed values. Therefore, after ∼50 h the side reaction at the LTO negative electrode progressed according to the model shown in Fig. 9.
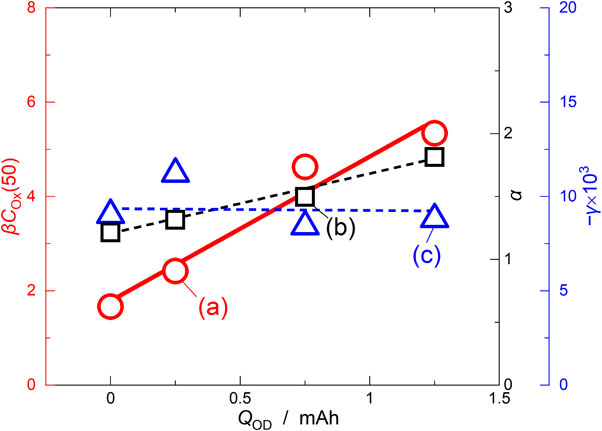
The value of each parameter obtained by fitting was plotted against QOD (Fig. 11). The value of α increased with increasing QOD: 1.21, 1.31, 1.50, and 1.81 µA for QOD = 0, 0.25, 0.75, and 1.25 mAh, respectively. Because ISR,Int should be proportional to the supply rate of the oxidant (νOx′) carried by crosstalk from the LAMO positive electrode, the increase in ISR,Int proportional to QOD was due to the increase in ISR,LAMO, as shown in Fig. 7. The value of γ was almost unchanged with the magnitude of QOD: −9.0 × 10⁻³, −11.2 × 10⁻³, −8.4 × 10⁻³, and −8.8 × 10⁻³ s−1 for QOD = 0, 0.25, 0.75, and 1.25 mAh, respectively. This means that the rate constant for decomposition of the oxidant at the LTO negative electrode (k) was constant, regardless of QOD. The value of β × COx(50) increased proportionally to QOD: 1.66, 2.42, 4.63, 5.34 mA for QOD = 0, 0.25, 0.75, and 1.25 mAh, respectively. Because the decomposition of the oxidant at the LTO negative electrode did not change, β should remain unchanged regardless of QOD because of the constant values of nOx and k. Thus, the increase in β × COx(50) is due to the change in COx(50), which is consistent with the assumption that the oxidant concentration near the LTO negative electrode increased during the overdischarge. The change in the parameters as a function of QOD was verified by the side-reaction model shown in Fig. 9 after overdischarge.
Based on the above results, we have summarized the side reactions occurring inside the LTO/LAMO cell (Fig. 12). Because of electrolyte decomposition, an “intrinsic”-ISR always flows at both electrodes, and the reductant (Red)/oxidant (Ox) is constantly generated by reductive/oxidative decomposition at the negative/positive electrode, respectively. A part of these products is transported to the other electrode and Red/Ox is oxidized/reduced at the positive/negative electrode by the crosstalk reaction, causing an “additional”-ISR. Therefore, the “additional”-ISR depends on the concentration of the oxidant (COx) and reductant (CRed) near the electrodes.
To suppress the capacity fading of LIBs caused by the SOC imbalance between the two electrodes, it is important to match the “actual”-ISR of both electrodes, which is the sum of “intrinsic”- and “additional”-ISR. If the crosstalk reaction can be diminished, the “additional”-ISR becomes zero. In this case, the actual-ISR at both electrodes should be equal to the “intrinsic” ISR and independent of COx and CRed. In other words, if there is no crosstalk reaction, the magnitude of ISR does not change, even if COx and CRed in the cell change. Therefore, if the crosstalk reaction can be prevented, the battery capacity can be permanently recovered without losing the recovered capacity during subsequent cycles. One approach to prevent the crosstalk reaction is to use a solid electrolyte, which stops the migration of the oxidant and reductant to the other electrode.37–40
If the crosstalk reaction cannot be eliminated, battery life could be extended by controlling COx and CRed to match the ISR of the positive and negative electrodes. A significant change in COx/CRed caused by overdischarge will increase the difference in ISR and cause drastic capacity fading. Subsequently, as the side reaction proceeds, excess oxidant will be consumed, COx/CRed will approach a steady value, and capacity fading will slow. This is because the capacity-fading rate slows as the battery is cycled, and COx/CRed becomes steady as the side reactions progress. One hypothesis to explain why additives extend battery life is that they alter COx/CRed, resulting in a more balanced ISR.40–44 As mentioned above, in extending battery life, COx and CRed must be considered because ISR is a function of COx and CRed.