Articles
Performance of Copper Corrosion Inhibitors on Pipecoridithiocarbamic Acid in 3 wt% NaCl Solution
2023 Volume 91 Issue 4 Pages 047006

Details
2023 Volume 91 Issue 4 Pages 047006
Pipecolyldithiocarbamic Acid (PIPDTC) is actually considered as a potential corrosion inhibitor. The inhibition behavior of PIPDTC is appropriately confirmed by electrochemical measurements accompanied with spectra characterization techniques and DFT calculations. The consequences point out that chemically adsorbed PIPDTC molecule is an outstanding corrosion inhibitor with corrosion efficiency of 99.87 % at 298 K and a great thermal stability ascribed to the Cu-S binding, implying that PIPDTC could be a tangible alternative as the prospective corrosion inhibitor for applications in marine industry.
Corrosion effects enormous economic losses to human society every year, which is considered to be one of the major causes for the damage and discard of numerous infrastructure and industrial equipment. And the hostile maritime environment, which involves complicated elements from many disciplines, including biology, physiochemistry and meteorology, has caught the interest of researchers as it improves the corrosion of metal equipment.1–6 An effective corrosion inhibitor has become available because of the contribution of the marine industry to the development of maritime corrosion inhibition materials. Due to its simple operation, quick action, low cost, and the fact that it does not affect the mechanical performance of the metal equipment, the application of a corrosion inhibitor is one of the optional techniques to slow down corrosion as well as anti-corrosion coatings, electrochemical protection, and metal surface treatment.7–10 Additionally, over the years, experts have conducted extensive studies on environmentally friendly, high-performance, and cost-effective organic corrosion inhibitors. The heteroatom (O, S, and N) active adsorption center and conjugated double bond of organ corrosion inhibitors, which can be stabilized on the metal surface by chemical or physical interactions, can play a vital role in corrosion inhibition of metals. The interaction of corrosion inhibitors and metal surface can affect the hydrophobicity of the metal surface to boost the energy barrier of the corrosion process in addition to efficiently isolating the corrosive media.11–15
It is generally known that copper has excellent ductility, workability, electrical conductivity and heat conductivity. And it is extensively utilized in the fields of military industry and power distribution system, which plays a critical role in civilization. Qafsaoui et al.16 reported that 1-pyrrolidine dithiocarbamate possesses the significant anti-corrosion performance for copper in a 0.5 mol L−1 (0.5 M) NaCl solution and the maximum anti-corrosion efficiency of the inhibitor concentration of 10−2 M is greater than 99 %. Ma et al.17 studied that dithiocarbamate modified glucose (DTCG) attenuated the corrosion rate of copper and had the inhibition efficiency of 97.12 % in a 3 wt% NaCl solution. Zhang et al.18 reported the anticorrosion mechanism of ammonium pyrrolidine dithiocarbamate (APDTC) on copper with an experimental and theoretical method and explored the relationship between the structure and the inhibition behavior in a 3 wt% NaCl solution. Liao et al.19 investigated sodium diethyldithiocarbamate (DDTC) as an environmentally friendly inhibitor of copper corrosion, and revealed that DDTC tended to typically chemically adsorb on the copper surface with it conforming to the Langmuir isotherm model. Li et al.20 explored N, N-dibenzyldithiocarbamate (DBDTC) and pointed out that the inhibitor attained 99.70 % anticorrosion efficiency for copper in 0.5 M H2SO4 solution.
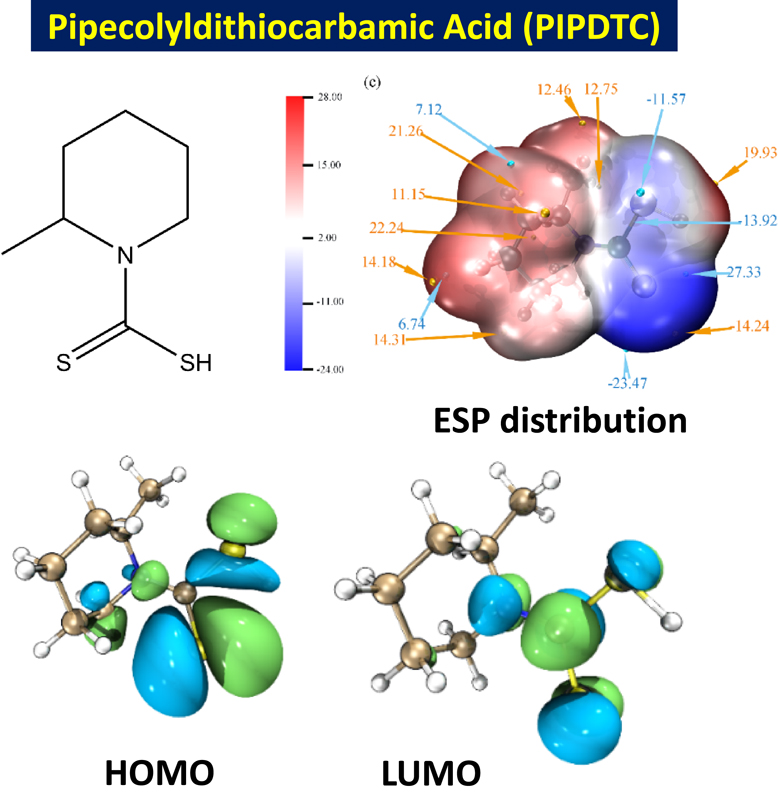
PIPDTC is generally used to synthesize intermediates or be raw materials. Selinsky et al. reported that PIPDTC was treated as raw materials to study the synthesis and magnetic exploration of Gd doped EuS nanocrystals with Curie temperature.21 As far as we know, new and effective corrosion inhibitors are pretty accepted, this is the first that the probability of PIPDTC for anticorrosion on copper is investigated and tapping into the inhibition performance via several techniques is displayed. In this work, the chemical structure of PIPDTC is shown in Fig. 1.

The molecular structure of PIPDTC.
The anti-corrosion performance on copper in a 3 wt% NaCl solution is properly assessed by electrochemical measurements in this investigation. We endeavor to find an appropriate adsorption model on account of thermodynamic properties of PIPDTC and discriminate the change of structure and composition analyzed by different spectra characterization techniques (SEM, EDS, XRD, and Raman). Meanwhile, quantum chemistry calculation has been utilized to expound the dependence of the molecular structure and anticorrosion efficiency. Various theoretical computations have been investigated the corrosion performance of metal by special organic molecules for a period in the past in atmospheric and liquid environments. More significantly, it is really essential for people to study and synthesize corrosion inhibitors.17–20
The comparison of the anticorrosion behavior of different inhibitors on copper in the literatures is displayed in Table 1, which indicates that the prominent inhibition of corrosion in the medium on copper can be obtained by PIPDTC. The entire and specific characterization techniques are shown in this study, which offers a novel viewpoint into the commercial development and application of more excellent and environmentally friendly corrosion inhibitors.
| Inhibitor | Concentration/mM | Medium | Metal | Inhibited efficiency/% | Reference |
|---|---|---|---|---|---|
| PDTC | 10 | 0.5 M NaCl | Copper | 99.88 | 16 |
| DTCG | 0.28 | 3 wt% NaCl | Copper | 97.12 | 17 |
| APDTC | 1.0 | 3 wt% NaCl | Copper | 98.70 | 18 |
| DDTC | 1.0 | 3 wt% NaCl | Copper | 99.28 | 19 |
| DBDTC | 8.0 | 0.5 M H2SO4 | Copper | 99.70 | 20 |
| PIPDTC | 0.60 | 3 wt% NaCl | Copper | 99.87 | This work |
Pure copper sheets (99.9 % purity) were herein employed in this article and the 3 wt% NaCl was used as the experimental corrosive medium. Pipecolyldithiocarbamic acid (PIPDTC, 98 % pure) was used to explore as corrosion inhibitor for the protective of copper with it purchased from Shanghai Yi En Chemical Technology Co., Ltd. Various concentrations (0.40, 0.45, 0.50, 0.55, and 0.60 mM = mmol L−1) of PIPDTC were added into the blank solution. Before the experiment, the pure copper sheets were made of block electrodes of 1 × 1 × 0.3 cm3, the effective exposed area of 1 × 1 cm2 was selected as the working surface. The working surface of electrodes were smoothed by using 400, 1000, 1500, and 2000 grit silicon carbide sandpaper from coarse to fine, until the epoxy resin is completely cured, then, the working electrodes were repeatedly cleaned several times by ethanol and deionized water, and dried. The immersion times of 4 h or 24 h were herein taken into account for the assessment of the corrosion inhibition of PIPDTC.
2.2 Electrochemical measurementsAll electrochemical tests were performed with the CHI604 electrochemical workstation in a traditional three-electrode system: copper sheets were processed into working electrodes, and a saturated calomel electrode (SCE) and a platinum electrode were employed as a reference electrode and auxiliary electrode purchased from Shanghai Leici Company, and all the electrode potentials measured in this task were referenced to SCE. The open circuit potential (OCP) could not reach an approximate steady state until the working electrode was immersed in 3 wt% NaCl solution at 298 K for 1800 s, followed by Potentiodynamic polarization curve (PDP) measurement and Electrochemical impedance spectroscopy (EIS) measurement. The EIS was herein performed at the OCP over a frequency measurement range between 0.01 Hz and 100 kHz with an amplitude of 10 mV. The electrochemical impedance spectrum was reasonably fitted and analyzed by the ZSimpWin software with the equivalent circuit model. The potentiodynamic polarization curve measurement was performed with a scanning speed of 2 mV s−1 and a potential sweep range from −250 mV to +250 mV (vs. OCP). The test result was fitted with CHI604 software to obtain relevant information. All experiments were performed at 298 K and were replicated three parallel specimens to ensure reproducibility to report representative results.
2.3 Surface morphologies and characterizationFor discussing the corrosion inhibition performance of PIPDTC and the surface morphology, scanning electron microscopy (SEM, JSM-7800F, JEOL, Japan) coupled with an energy dispersive X-ray spectrometer (EDS) and confocal microscopy (ZEISS CSM700, Carl Zeiss AG, Germany) were carried out. X-ray diffraction analyzer (BRUKER D8 ADVANCE, USA) and Raman spectra (DXR3xi, Thermo Fisher Scientific, USA), were used to investigate the elemental component of the adsorbed layer on the copper surface.
2.4 Theoretical studiesQuantum chemical methods were considered as a predictable theoretical measurement used to explore the reaction mechanism of corrosion inhibitors with metals and predict the active sites of corrosion inhibitor molecules. In this work, exchange-correlation functional B3LYP22 was used with the 6-311G* basis set,23,24 combined with the Grimme DFT-D3 empirical dispersion correction,25 and geometric optimization calculation for PIPDTC are performed by Gaussian 09 software.26 Subsequently, the relevant quantum chemical parameters were extracted from Multiwfn 3.8.27 And the above calculations were carried out using the Solvation Model Density (SMD) solvation model. Additionally, the adsorption calculation of PIPDTC on the Cu (1 1 1) surface were herein performed by the DMol3 software package, which the PBE28 functional was considered and the solvent effect was also considered with the COSMO model. Ultimately, the subsequent image processing was performed by the VMD 1.9.3 software.29
Molecular dynamics simulation is used to explore the adsorption process of PIPDTC on the copper surface with the Forcite module in Materials Studio 8.0. Simulating the adsorption behavior between Cu (1 1 1) crystal plane and PIPDTC molecules in a three-dimensional box with a size of 3.2 nm × 3.2 nm × 2.6 nm is constructed. A canonical ensemble (NVT), a COMPASS force field with periodic boundaries, a total simulation time of 15.0 ps, a calculation step of 1.0 fs, and a simulated temperature of 298 K are used in the simulation conditions. Ultimately, the interaction energy (Einteract) between the PIPDTC molecule and the copper surface as well as the adsorption model of the corrosion inhibitor are obtained. The calculation is obtained by the Eq. 1:30–33
| \begin{equation} E_{\text{interact}} = E_{\text{total}} - E_{\text{sub}} - E_{\text{inh}} \end{equation} | (1) |
| \begin{equation} E_{\text{binding}} = -E_{\text{interact}} \end{equation} | (2) |
The OCP plots of copper electrodes in the absence and presence of various concentrations of PIPDTC in a 3 wt% NaCl solution for 1800 s at 298 K is displayed in Fig. 2a. It can be observed that the tendency of the OCPs has become pretty stable from an early apparent fluctuation, suggesting that the experimental system has reached a virtually steady state. As displayed in the figure, the OCPs in the presence of PIPDTC significantly shifted to a more positive direction than those in the blank solution, which may be ascribed to the adsorption of DTCV on the active sites of the copper electrodes. Furthermore, in order to evaluating the anticorrosion effect of PIPDTC for copper in this work, the EIS and PDP methods are herein performed.
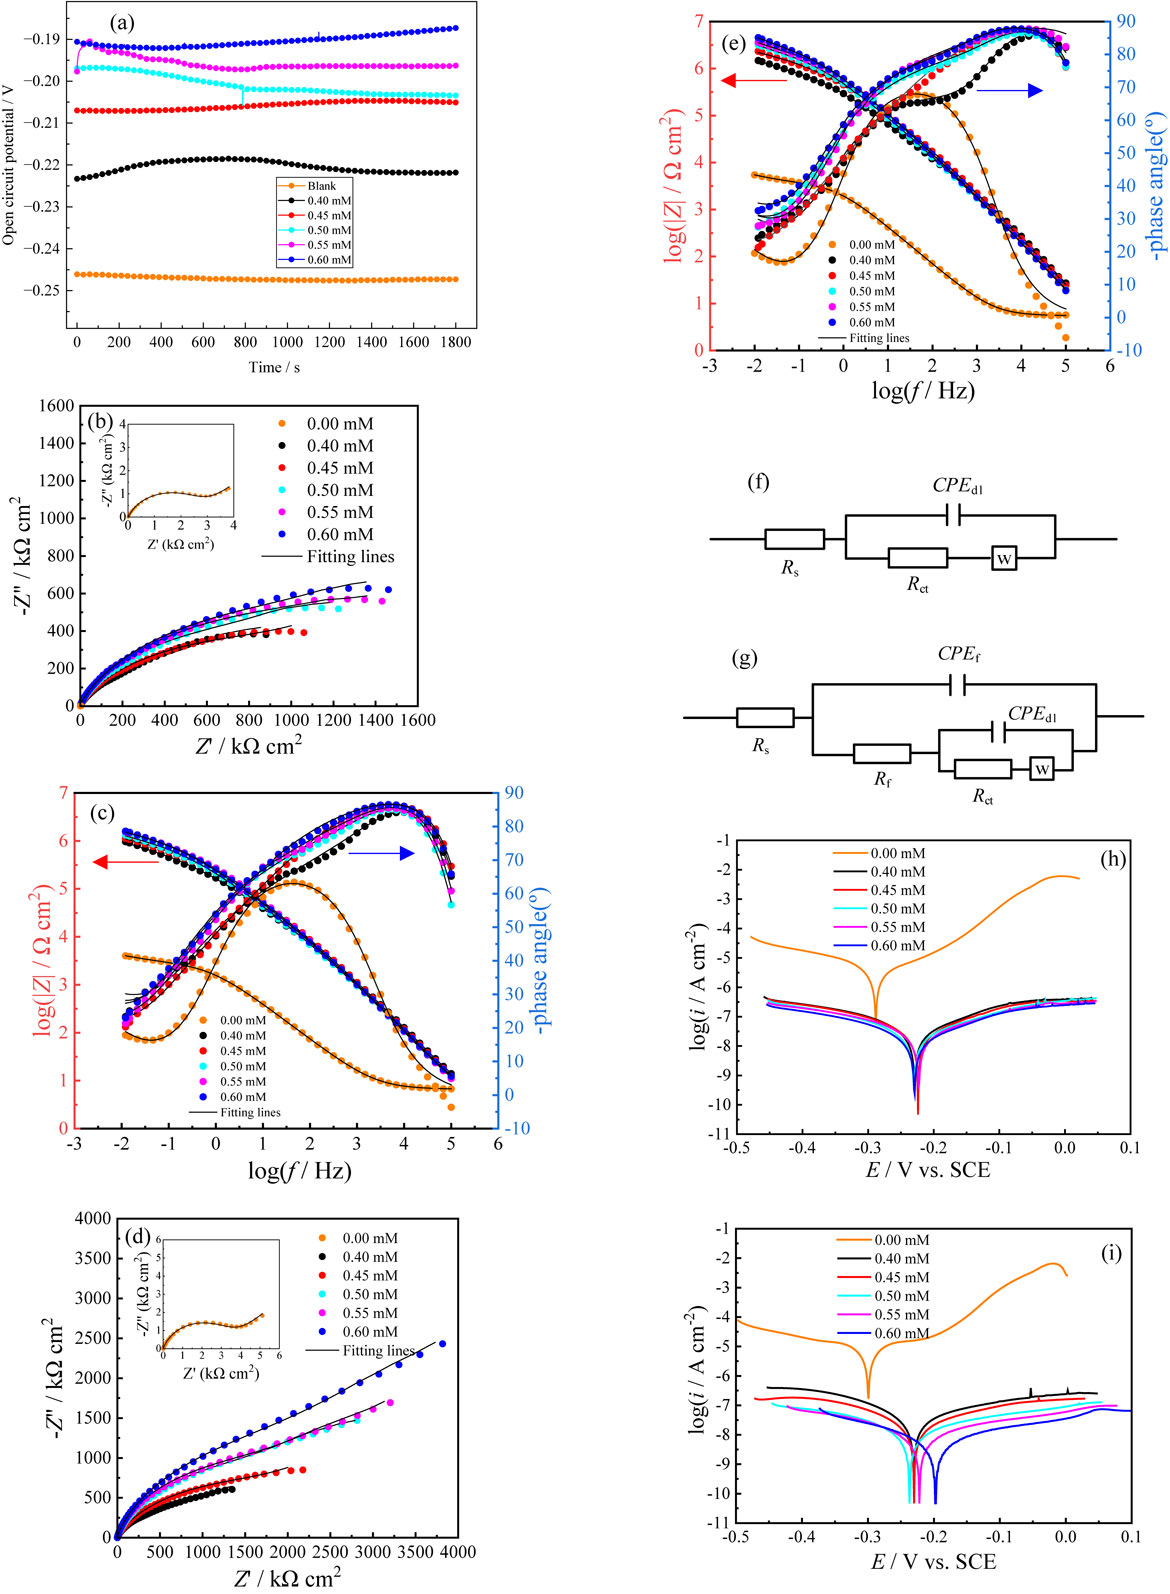
The electrochemical test figures: the OCP plots of copper with different concentrations of PIPDTC in a 3 wt% NaCl solution for 1800 s at 298 K (a); Nyquist and Bode plots of copper with different concentrations of PIPDTC in a 3 wt% NaCl solution for 4 h (b, c), 24 h (d, e); the equivalent circuits used to fit the EIS (f, g); polarization curve plots of copper with different concentrations of PIPDTC in a 3 wt% NaCl solution for 4 h (h) and 24 h (i).
Figures 2b–2e show the Nyquist and Bode plots of copper with different concentrations of PIPDTC in 3 wt% NaCl solution for 4 h and 24 h, which the symbols represent the original data, and the solid line is a fitted curve obtained by ZsimpWin software based on the equivalent circuit displayed in Figs. 2f and 2g. Seen from the figure, the obtained Nyquist plot of the copper electrodes in NaCl solution is not a perfect semicircle, and the error value is probably attributed to the dispersion effect and unevenness of mass transmission resistance on the copper surface. When PIPDTC is added to the NaCl solution, the increment in semicircular diameter of the Nyquist plot is obviously observed, indicating that the impedance value measured by the electrode increases, and the corrosion inhibitor molecules can adsorb effectively on the copper surface. Furthermore, as the corrosion inhibitor concentration increases, so does the capacitive ring diameter, elucidating that the great corrosion inhibition performance of PIPDTC is feasibly due to the large number of molecules adsorbed on the copper electrodes. Considering a comparison of the Nyquist diagram in Figs. 2b and 2c, it is found that the semicircle diameter measured by the copper electrodes with the immersion time of 24 h is greater than that of 4 h under the same concentration of corrosion inhibitor, indicating that the protective effect of PIPDTC corrosion inhibitor will be improved by appropriately increasing the immersion time of copper in the corrosive medium.
The equivalent circuit models are proposed to fit and analyze the electrochemical impedance spectrum measurement. The model in Fig. 2f is herein applied to fit the EIS data of the copper electrode in the blank solution, and the model in Fig. 2g is employed to fit the EIS data of the copper electrode treated with different concentrations of PIPDTC inhibitor. Meanwhile, the pertinent fitting parameters are displayed in Table 2, including the solution resistance (Rs), resistance of outer film on the copper surface (Rf), charge transfer resistance (Rct), the Warburg impedance (W) as well as constant phase angle element (CPE) that stands for the double layer capacitance of the copper electrode and solution (Qdl) and represents the capacitance of outer film. In fact, a CPE substitutes the pure capacitor to enhance the exactness of the EIS analysis. The impedance of a CPE is calculated by Eq. 3:35,36
| \begin{equation} Z_{\text{CPE}} (\omega) = [Y_{0}(j\omega)^{n}]^{-1} \end{equation} | (3) |
| Time | C | Rs | Rf | Rct | Qf | Qdl | W | Rp | ηEIS | ||
|---|---|---|---|---|---|---|---|---|---|---|---|
| h | mM | Ω cm2 | kΩ cm2 | kΩ cm2 | Yf, µΩ−1 sn·cm−2 |
nf | Ydl, µΩ−1 sn·cm−2 |
ndl | mΩ−1 s0.5 cm−2 |
kΩ cm2 | % |
| 4 | 0.00 | 6.606 | — | 2.861 | — | — | 106.2 | 0.7556 | 2.195 | 2.861 | — |
| 0.40 | 5.871 | 1.886 | 765.8 | 0.1255 | 0.9980 | 1.583 | 0.6011 | 0.0060 | 767.69 | 99.63 | |
| 0.45 | 4.607 | 2.302 | 970.8 | 0.1377 | 0.9970 | 1.302 | 0.539 | 0.0058 | 973.10 | 99.71 | |
| 0.50 | 6.609 | 2.743 | 1143 | 0.1534 | 0.9997 | 1.139 | 0.6187 | 0.0052 | 1145.74 | 99.75 | |
| 0.55 | 5.96 | 3.681 | 1492 | 0.1519 | 0.9951 | 0.989 | 0.605 | 0.0048 | 1495.68 | 99.81 | |
| 0.60 | 4.466 | 4.233 | 1684 | 0.1581 | 0.9950 | 0.977 | 0.5597 | 0.0046 | 1688.23 | 99.83 | |
| 24 | 0.00 | 5.482 | — | 3.567 | — | — | 82.60 | 0.8022 | 1.584 | 3.567 | — |
| 0.40 | 5.107 | 4.390 | 1063 | 0.0683 | 0.9945 | 0.6925 | 0.6606 | 0.0030 | 1067 | 99.67 | |
| 0.45 | 5.209 | 4.550 | 1376 | 0.0628 | 0.9895 | 0.6344 | 0.6620 | 0.0021 | 1381 | 99.74 | |
| 0.50 | 4.643 | 5.155 | 2164 | 0.0819 | 0.9987 | 0.4196 | 0.6633 | 0.0018 | 2169 | 99.84 | |
| 0.55 | 4.828 | 13.65 | 2341 | 0.0935 | 0.9875 | 0.3062 | 0.6290 | 0.0015 | 2355 | 99.85 | |
| 0.60 | 4.027 | 15.61 | 2826 | 0.0833 | 0.9973 | 0.3119 | 0.6559 | 0.0010 | 2842 | 99.87 | |
Normally, the polarization resistor Rp, which is the sum of Rct and Rf (Rp = Rct + Rf), is commonly used to evaluate the corrosion inhibition efficiency of PIPDTC corrosion inhibitor. And the corrosion inhibition efficiency ηEIS obtained by the polarization resistance is listed in Table 2. The parameter ηEIS is expressed by Eq. 4:
| \begin{equation} \eta_{\text{EIS}}\% = \frac{R_{\text{p}}-R_{\text{p}}^{0}}{R_{\text{p}}} \times 100 \end{equation} | (4) |
It can be found from the Table 2 that when PIPDTC corrosion inhibitor is added, both the film resistance Rf and the charge transfer resistance Rct rise with the increase in concentration of the inhibitor, that is, PIPDTC can indeed play an essential role in the corrosion impediment on copper. As the film resistance and charge transfer resistance increase, so the polarization resistance Rp in the system does. In addition, it can be concluded from the obtained Warburg impedance data that, the Warburg impedance data is reduced by two orders of magnitude with the addition of the corrosion inhibitor and gradually decreases with the increment in the concentration, which indicates that the Warburg impedance in the experiment is progressively disappearing, and the diffusion process of copper-chlorine complex and oxygen on the copper surface is in a sharply reducing stage. Otherwise, the values of ηEIS increase with the increment in the concentrations of the inhibitor and the maximum ηEIS is up to 99.83 % when the immersion time is 4 h. As for the immersion time of 24 h, the maximum ηEIS increases to 99.87 %. Such high corrosion inhibition efficiency represents that PIPDTC possesses the excellent anti-corrosion performance for copper in NaCl corrosive medium. In general, with the increment of the inhibitor concentration, the coverage of the inhibitor on the metal surface will rise, and the corrosion inhibition efficiency will increase, therefore the anti-corrosion performance of the inhibitor will also increase, which is consistent with the results of SEM and EDS.
3.3 Polarization curve measurementThe polarization curve plots of copper with various concentrations of PIPDTC in 3 wt% NaCl solution for an immersion of 4 h and 24 h are demonstrated in Figs. 2h and 2i, respectively. Then, the fitting electrochemical parameters are listed in Table 3, including corrosion potential (Ecorr), anodic Tafel slope (βa), cathodic Tafel slope (βc), corrosion current density (Icorr) and corrosion efficiency ηp. Meanwhile, the corrosion inhibition efficiency ηp obtained by the corrosion current density is listed in Table 3. And the parameter ηp is calculated by Eq. 5:
| \begin{equation} \eta_{\text{p}}\,\% = \frac{(I_{\text{corr}}^{0} - I_{\text{corr}})}{I_{\text{corr}}^{0}} \times 100 \end{equation} | (5) |
| Time | C | Ecorr | βa | −βc | icorr | ηP |
|---|---|---|---|---|---|---|
| h | mM | mV vs. SCE |
mV dec−1 | mV dec−1 | µA cm−2 | % |
| 4 | 0.00 | −0.288 | 92.01 | 218.0 | 5.552 | — |
| 0.40 | −0.230 | 124.9 | 182.2 | 0.039 | 99.31 | |
| 0.45 | −0.225 | 119.2 | 173.0 | 0.031 | 99.44 | |
| 0.50 | −0.231 | 151.9 | 172.9 | 0.027 | 99.51 | |
| 0.55 | −0.224 | 151.3 | 189.7 | 0.026 | 99.54 | |
| 0.60 | −0.230 | 126.6 | 178.0 | 0.024 | 99.57 | |
| 24 | 0.00 | −0.261 | 49.70 | 962.5 | 4.498 | — |
| 0.40 | −0.232 | 219.0 | 150.1 | 0.049 | 98.91 | |
| 0.45 | −0.231 | 189.6 | 164.3 | 0.030 | 99.33 | |
| 0.50 | −0.237 | 223.2 | 183.2 | 0.018 | 99.60 | |
| 0.55 | −0.222 | 229.1 | 178.4 | 0.013 | 99.71 | |
| 0.60 | −0.198 | 225.5 | 168.2 | 0.008 | 99.82 |
The anodic reactions on copper in NaCl medium are displayed by Eqs. 6–8:7
| \begin{equation} \text{Cu} + \text{Cl}^{-} \to \text{CuCl}_{\text{ads}}^{-} \end{equation} | (6) |
| \begin{equation} \text{CuCl}^{-} + \text{Cl}^{-} \to \text{CuCl}_{2,\text{ads}}^{-} + \text{e}^{-} \end{equation} | (7) |
| \begin{equation} \text{CuCl}_{2,\text{ads}}^{-} \to \text{Cu}_{\text{sol}}^{2+} + 2\text{Cl}^{-} + \text{e}^{-} \end{equation} | (8) |
| \begin{equation} \text{O}_{2} + 2\text{H$_{2}$O} + 4\text{e}^{-} \to 4\text{OH}^{-} \end{equation} | (9) |
As can be seen in Figs. 2h and 2i, polarization curves of copper electrodes under the same immersion time reveal that the cathodic and anodic Tafel curves move in the direction of low current density, when PIPDTC with different concentrations is added to the NaCl solution, and the more the inhibitor is, the greater the trend of movement is, indicating that the copper electrode treated with different concentration of PIPDTC in the experimental medium hinders the diffusion of chloride ions, the cathodic diffusion of dissolved oxygen to the cathode on the surface of the electrode and the anodic diffusion of the formed copper-chlorine complex to the anode in the medium. During a soaked time of 4 h, the cathodic polarization curve showed an approximately parallel and coincident state, when PIPDTC concentration increased from 0.4 mM to 0.6 mM, while the anodic polarization curve decreased regularly, and the corrosion potentials move in a positive direction, implying that the corrosion inhibitor adsorbed on the copper surface for a soaked time of 4 h mainly blocks the corrosion process of copper in the NaCl solution by inhibiting anodic dissolution.41,42 Regardless of the immersion time of 4 h or 24 h, the corrosion potential varies less than 85 mV, so PIPDTC can be credibly classified as a mix-type corrosion inhibitor. Meanwhile, it is found that in the anodic polarization curves after a soaked time of 4 h and 24 h, regardless of the concentration, a low current density platform that does not change with the voltage would appear in the high voltage region, indicating that the formed layer on the copper surface during an immersion process provides great and promising protection for copper. The obtained surface protection is considered to be favorable which arises from the voltage continues to increase without significant current fluctuations.43
From Table 3, it can be seen that the corrosion current density of copper for 24 h in the blank solution is less than that for 4 h, which may be owing to the extension of the immersion time, and a Cu2O dense protective layer is herein formed on the copper surface, which prevents the accelerating corrosion of copper to a certain extent, resulting in a reduction in corrosion current density. Moreover, the corrosion current density is reduced by 1 to 2 orders of magnitude, after the corrosion inhibitor is added to the solution, and the increase in the concentration of the corrosion inhibitor shows a negative feedback trend, indicating that the corrosion inhibitor can better play an excellent corrosion inhibition effect on copper.
3.4 Adsorption isothermCredibly, for achieving the purpose of effectively slowing down the corrosive performance of metal, organic corrosion inhibitor could normally adsorb on plenty of sites with great surface energy of metal and gradually form a thin film, which largely insulates the metal surface and the corrosive medium. The adsorption behavior of corrosion inhibitor on the copper surface can be mainly investigated by various adsorption isotherm model such as Langmuir, Freundlich, Temkin isotherms.44 The comparisons are displayed in Table 4. Cinh represents the concentration of PIPDTC inhibitor, Kads is the standard equilibrium constant, P is the regression coefficient and θ represents the surface coverage, which is obtained from the EIS measurement and PDP measurement, respectively. According to Fig. 3 and Table 4, the Langmuir isotherm model is herein discovered to be the most suitable model for the EIS and PDP measurements. In light of the intercept (1/Kads) of the fitted straight line, the Gibbs free energy can be mainly calculated by Eq. 10:45
| \begin{equation} \Delta G_{\text{ads}}^{\theta} = -\textit{RT}\ln (55.5K_{\text{ads}}) \end{equation} | (10) |
| Isotherm | Linear form of Isotherm | Plot | R2-EIS | R2-PDP | ||
|---|---|---|---|---|---|---|
| 4 h | 24 h | 4 h | 24 h | |||
| Langmuir | $\dfrac{C_{\text{inh}}}{\theta } = \dfrac{1}{K_{\text{ads}}} + C_{\text{inh}}$ | $\dfrac{C_{\text{inh}}}{\theta }$ vs. Cinh | 0.9997 | 0.9998 | 0.9999 | 0.9994 |
| Temkin | ln Cinh = αθ − ln Kads | ln Cinh vs. θ | 0.7230 | 0.6850 | 0.6517 | 0.6524 |
| Freundlich | log(θ) = log(Kads) + n log(Cinh) | log θ vs. log Cinh | 0.7073 | 0.6870 | 0.6890 | 0.6373 |
| Flory-Huggins | $\log \dfrac{\theta }{C_{\text{inh}}} = \log (xK_{\text{ads}}) + x \log (1 - \theta )$ | $\log \dfrac{\theta }{C_{\text{inh}}}$ vs. log(1 − θ) | 0.7954 | 0.7832 | 0.7929 | 0.6980 |
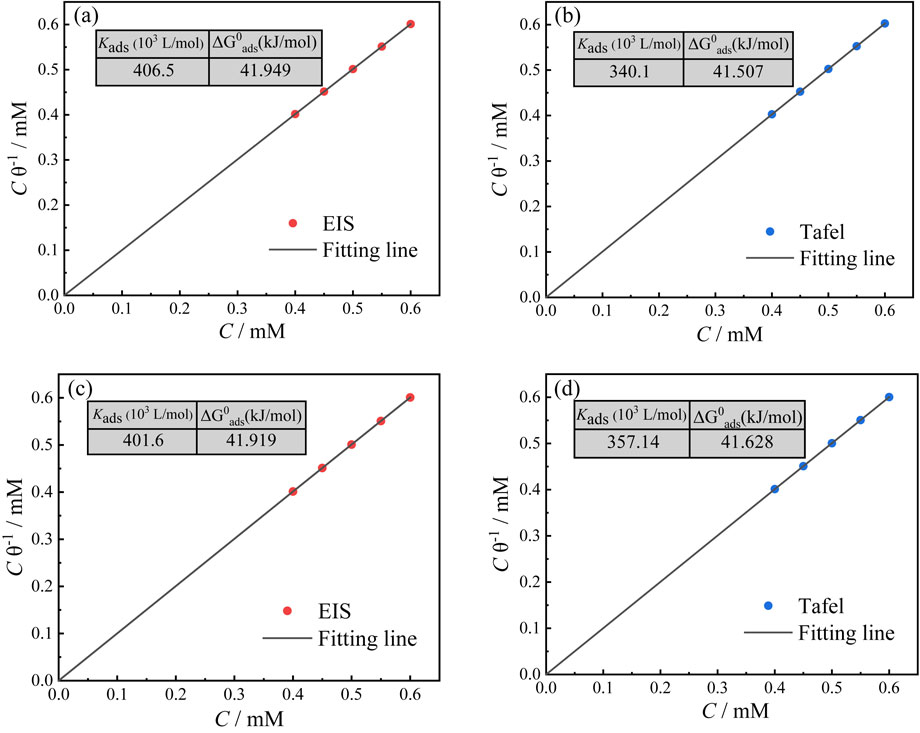
Langmuir isotherm plots of PIPDTC on copper in a 3 wt% NaCl solution for 4 h (a, b) and 24 h (c, d).
Figures 4a–4d and Figs. 4e–4h show SEM and EDS plots of pure copper soaked in a 3 wt% NaCl medium with different PIPDTC contents at 298 K for 4 h, 24 h, respectively. From Figs. 4a–4d, it can be found that after soaked in the blank solution for 4 h, the scratches on the copper surface are clearly visible and the gully is deep, indicating that aggressive ions Cl− in the blank solution has caused corrosion to the copper electrode surface. Scratches on the surface of the copper electrode soaked in the solution containing PIPDTC are slightly visible, and it can be seen that the copper electrode is covered with a layer of delicate film. Meanwhile, through EDS detection, it is found that in addition to the C, O, and Cu elements present in the blank solution, the presence of N and S elements on the surface of the copper electrodes containing the surface film is also scanned, implying there are N and S elements in the film components, which proves the PIPDTC molecules are adsorbed on the copper surface, practically and successfully.

SEM and EDS plots of PIPDTC with different concentrations on copper in a 3 wt% NaCl solution for 4 h (a, b: 0.0 mM; c, d: 0.6 mM), 24 h (e, f: 0.0 mM; g, h: 0.6 mM); SEM and EDS plots of PIPDTC on copper in a 3 wt% NaCl solution for 24 h (i: 0.0 mM; j: 0.6 mM).
From the SEM plots shown in Figs. 4e–4h of pure copper soaked in the blank solution for 24 h, it can be found that there are still the scratches on the surface of the electrodes, but compared with the state of 4 h, there is a film on the copper electrode, and there are also some spherical particles, which are considered to be Cu2O spherical particles via EDS detection. Typically, cuprous oxide is thought to have a protective effect on copper electrodes. For copper electrodes soaked for 24 h in NaCl medium containing PIPDTC molecules, similar to the characterization of 4 h, the scratches show more vaguely, indicating more corrosion inhibitor molecules are adsorbed on the surface of the copper electrode, which play a better protective role in the process, and this conclusion is also confirmed by the subsequent EDS results.
In contrast to the SEM characterization pictures of copper surface containing PIPDTC solution, it is found that there is more sporadic anchor-like particulate on the surface of the soaking time of 24 h than that of 4 h as shown in Figs. 4c and 4g, and the content of S and N elements in these granular substances is much adequate than that of the corrosion inhibitor film adsorbed on copper by EDS technique, as displayed in Figs. 4h and 4j. These substances may be particulate matter condensed by the agglomeration of PIPDTC molecules, and under the action of time factors, the condensation phenomenon in the surface of 24 h is more serious, thus, the surface presents herein more particulate matter.
3.5.2 Confocal microscopyFigures 5a–5d and Figs. 5e–5h display the confocal microscopy plots of pure copper soaked for 4 h and 24 h in 3 wt% NaCl medium with different PIPDTC concentrations, respectively. From the optical micro-corrosion morphology of the copper surface in the blank solution, it could be seen that the scratches caused by the blurring on the surface are apparently displayed, and the surface as a whole is blue-green, indicating that generation of corrosion products exists credibly on the copper surface during the soaked process of NaCl solution, thereby both blurring the surface morphology and changing color of the copper surface are observed. The plot of the surface of copper electrodes soaked in the solution containing PIPDTC shows that scratches can be clearly seen, implying that copper has less corrosion in the solution containing PIPDTC, which proves the corrosion inhibition effect of PIPDTC molecules on copper. The red color on the copper surface may be attributed to the PIPDTC molecules adsorbed on the copper surface. As the immersed time increases, the red color on the copper surface also becomes darker, which may be due to the amount of PIPDTC molecules adsorbed on the surface. In addition to the red appearance, the copper surface soaked for 24 hours also has scattered green parts, and then, the observation with greater magnification can be found that the shape is mostly flaky or maple leaf-like, which may be caused by the accumulation of PIPDTC corrosion inhibitor molecules on the surface, which also corresponds to the results presented in the SEM diagram above.

Confocal microscopy plots of PIPDTC with different concentrations on copper in a 3 wt% NaCl solution for 4 h (PIPDTC: a, b, e, and f: 0.0 mM; c, d, g, and h: 0.6 mM).
Figures 6a and 6b presents an XRD spectra of pure copper working electrode soaked in NaCl solution for different immersed time. Seen from the pure copper electrode spectrogram soaked in the blank solution, surface of soaked time of 4 h only presents the diffraction peak of Cu, and there is no appearance of the rest of the products, which may be a shorter corrosion time, the content of surface corrosion products is lower. As for the electrode surface soaked for 24 h, in addition to the emergence of Cu diffraction peak, there is also a peak of Cu2O in comparison with standard XRD atlases, indicating that a long-term soaked environment can make the copper surface further corrosion reaction, the production of copper compounds. After the addition of PIPDTC corrosion inhibitor, regardless of the soaked time of 4 h or 24 h, only the diffraction peak of Cu appears, implying that the PIPDTC molecular can effectively prevent further corrosion of copper.
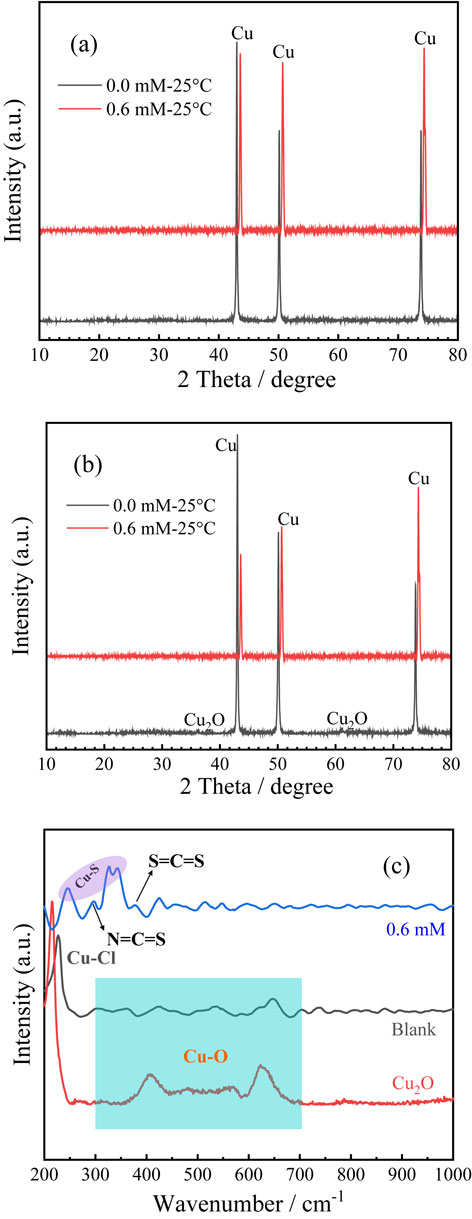
Spectra characterization analysis of the corrosion inhibitor: XRD plots of 0 mM and 0.6 mM PIPDTC with different immersion time on copper in a 3 wt% NaCl solution at 298 K (a: 4 h; b: 24 h). Raman plot of PIPDTC with various concentrations on copper for 24 h in a 3 wt% NaCl solution at 298 K (c).
To further identify corrosion products on copper, Raman spectroscopy was herein applied to collect information about the material components on mental surface. Figure 6c shows Raman spectroscopic characterizations, after pure copper electrodes have soaked in 3 wt% NaCl solution containing different concentrations of PIPDTC for 24 h at 298 K. According to the spectral data, the Raman signal on the copper surface corroded in the NaCl medium has a significant characteristic peak in the 200–300 cm−1 band region, because of Cl− ions in the solution, and this peak is actually considered to be the peak caused by Cu-Cl vibration after literature comparison. In the 300–700 cm−1 band area, there are multiple shoulder peaks, which the approximate position is between 400 cm−1 and 500–650 cm−1. In comparison with the Raman spectral characteristic peaks of pure matter Cu2O, it is confirmed that the characteristic shoulders present in the 300–700 cm−1 band area are caused by Cu-O vibration, that is, the presence of Cu2O in the corrosion products on the copper surface. From the Raman spectra, it can be concluded that during the immersion of the copper electrode in NaCl medium, a large amount of aggressive Cl− ions reach on the surface of copper electrode, with the precipitation of CuCl− and the increment of membrane thickness, meanwhile, the transmission of Cl− and CuCl2− through the internal channel of the membrane is probably hindered, which greatly inhibits the further formation of chloride species. Conversely, the formation of oxides can accelerate to some extent, in accordance with the increase in the concentration of CuCl− onto the interface between copper and NaCl solution. Therefore, the CuCl film is gradually transformed into Cu2O.
From the Raman spectrum measured by the electrode soaked in NaCl solution containing 0.6 mM PIPDTC corrosion inhibitor for 24 h, it can be concluded that the characteristic peaks of Cu-O vibration and Cu-Cl vibration for the electrode soaked in the blank solution cannot be observed between the 200 cm−1–700 cm−1 band, indicating that both copper chloride compound and copper oxide compound have been much low due to the presence of adsorbed corrosion inhibitor, so that the Raman spectrum cannot detect the corresponding characteristic peak. In the 200 cm−1–1000 cm−1 band region, different from the Raman spectral characteristic peaks in the blank solution, the characteristic peaks at 295 cm−1, 376 cm−1 were mainly assigned to N=C=S and S=C=S, and the presence of two peaks indicated the presence of PIPDTC molecules on the copper surface, proving that the PIPDTC molecules indeed play an important role in corrosion inhibition effect on copper. Furthermore, the double shoulder peaks present near 246 cm−1 and 330 cm−1 due to the symmetrical stretching pattern of Cu-S. The characteristic peak strength also represents the Cu-S bonding degree to a certain extent, indicating that the corrosion inhibitor molecules can be well adsorbed on the surface to hinder corrosion behavior, as mentioned above.
3.6 Theoretical studiesQuantum chemistry calculation is of vital significance for the investigation of the relation between the structure of corrosion inhibitors and anti-corrosion efficiency. Thus, density function theory is used to further explore the physical and chemical properties of corrosion inhibitor PIPDTC on a microscopic level. The diagrams of HOMO and LUMO of PIPDTC are shown in Figs. 7a and 7b. Additionally, the relevant parameters obtained are also demonstrated in Table 5.
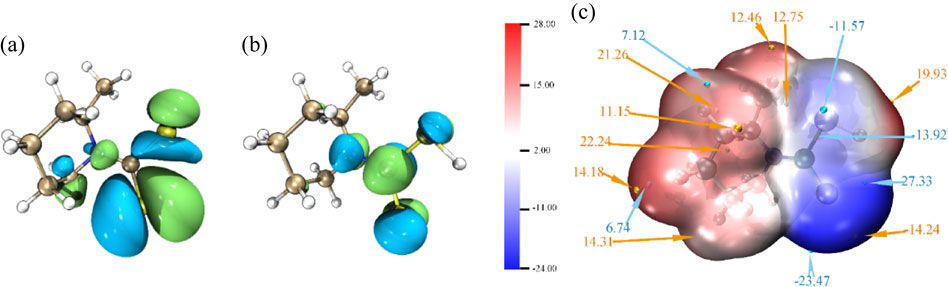
The molecular surface coloring map of PIPDTC: (a) HOMO; (b) LUMO; (c) the ESP distribution of PIPDTC molecules (kcal/mol).
| HOMO | −5.784 eV |
| LUMO | −1.019 eV |
| ΔE | 4.765 eV |
As shown in Figs. 7a and 7b, the HOMO and LUMO orbitals of corrosion inhibitor PIPDTC are mainly concentrated on the sulfur atoms, indicating that the sulfur atoms are probably the active sites of adsorption. A key element affecting the adsorption of PIPDTC on the copper surface may be the homeotropic adsorption of pipecolyldithiocarbamic acid. In line with the molecular frontier orbital theory, HOMO and LUMO are essential factors that influence the chemical reactivity of molecules in a great measure. Meanwhile, HOMO commonly stands for the capability of donating electrons and a higher value of EHOMO of the corrosion inhibitor represents a more ability to donate electrons to the metal surface, while LUMO means the capacity of accepting electrons and a lower ELUMO value stands for a stronger ability for the PIPDTC molecules to be an electron acceptor.48 Consequently, the energy gap (ΔE) of EHOMO and ELUMO may also reflect the chemical stability of corrosion inhibitor molecules.49 It can be obviously concluded that dense electron-rich regions around sulfur atoms and the heterocyclic ring are observed in the HOMO and LUMO orbital of PIPDTC. Otherwise, it can be judged that sulfur atoms can provide electrons to copper to form the coordination bond, which PIPDTC molecules can be firmly adsorbed onto the copper surface. Subsequently, the electrostatic potential (ESP) distribution on the electron density ρ = 0.001 e Bohr−3 (1 Bohr = 5.29 × 10⁻¹¹ m, Bader defined) of PIPDTC is to explore reactive sites as displayed in Fig. 7c. In fact, the red (positive) and blue (negative) regions correspond to the electrophilic and nucleophilic active reaction sites of PIPDTC molecules, respectively. The minimum values of the ESP in PIPDTC molecules are mainly located on sulfur atoms, indicating that the -CS2 regions are considered to be the greatest electrophilic sites in the inhibitor molecules, while the partial maximum values of that are contributed over the sulfur atoms as well, implying that the -CS2 may be the most excellent nucleophilic sites in the molecules. And the conclusion of ESP coincides with the results discussed in the frontier orbital theory.
3.7 Molecular dynamics simulationsBriefly, molecular dynamics simulation is applied into the fields of further investigation of the adsorption mechanism of PIPDTC molecule on the copper surface. The steady adsorption configuration of PIPDTC corrosion inhibitor molecules on surface of Cu (1 1 1) at 298 K is shown in Fig. 8. According to the side view (Fig. 8a) and the top view (Fig. 8b), it is found that the PIPDTC molecule and the copper surface are parallel in general. As a matter of fact, in the light of above analysis of quantum chemistry results, it has been predicted that this parallel adsorption mode of PIPDTC is discovered on the copper surface. The contact area between the PIPDTC molecule and the copper can be maximized because of the parallel adsorption mode of the -CS2 group of PIPDTC, which means that the contact area between the copper and the aggressive particles is effectively reduced, thereby hindering the copper surface from being attacked by the NaCl medium.
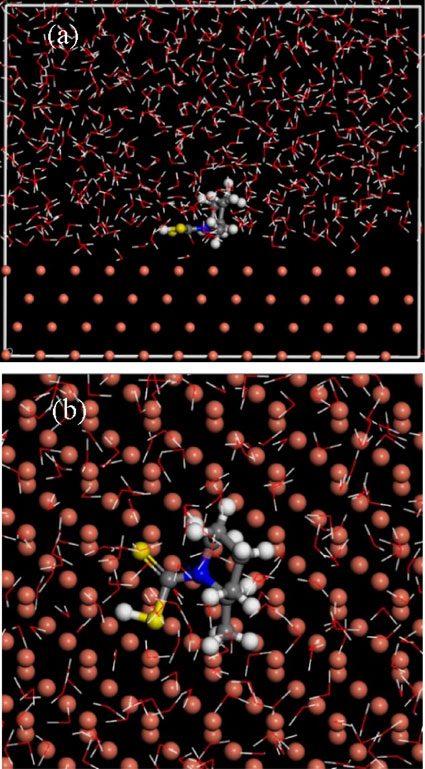
The adsorption simulation plot of PIPDTC molecule on Cu (1 1 1) surface: (a) side view; (b) top view.
Additionally, the calculated corresponding kinetic parameters are displayed in Table 6. Generally speaking, the greater the value of the binding energy (Ebinding) is, the stronger the binding effect of the metal surface with the corrosion inhibitor molecules is, and the more easily the corrosion inhibitor adsorbs onto the metal surface, in other words, it has an excellent anti-corrosion performance. From the calculation consequences, the binding energy between PIPDTC molecule and copper is 406.428 kJ mol−1, which is relatively large and implies that a certain degree of inhibition for PIPDTC on copper corrosion is observed in the 3 wt% NaCl medium.
| Etotal | −15867.917 kJ mol−1 |
| Einhibitor | 16.039 kJ mol−1 |
| Ebulk+surface | −15445.415 kJ mol−1 |
| Einteraction | −406.428 kJ mol−1 |
| Ebinding | 406.428 kJ mol−1 |
The corrosion performance for copper in a 3 wt% NaCl solution can be considerably effectively hindered since a large value of ηEIS and ηp of PIPDTC has been obtained in the manuscript, and the inhibitor follows the Langmuir isotherm adsorption model, corroborating that PIPDTC adsorbed on the copper surface tends to be the chemisorption. On the basis of theoretical calculations, the S atoms are mainly the active sites of PIPDTC adsorbed on the copper surface. At the meanwhile, the bonding information are properly detected by the XRD and Raman analysis. The SEM and EDS observations graphically indicate that PIPDTC can effectively impede the corrosive behavior for copper in the NaCl medium.
The work was considerably financially supported by Shanghai Committee of Science and Technology (17DZ2282800, 19DZ2271100), China.
Rongbo Wei: Formal analysis (Lead), Visualization (Equal), Writing – original draft (Lead), Writing – review & editing (Equal)
Wei Liu: Methodology (Equal)
Zesong Gao: Methodology (Equal)
Dong Yang: Conceptualization (Lead)
Qiangqiang Liao: Supervision (Lead), Writing – review & editing (Equal)
The authors announce that they are not provided with known rival pecuniary interests or personal relationships that could have appeared to influence the work reported in this paper.
Shanghai Committee of Science and Technology: 17DZ2282800, 19DZ2271100