ABSTRACT
This study evaluated the effects of reducing the exposure concentration and the human health damage of alternative plasticizers to di(2-ethylhexyl) phthalate (DEHP) by a novel relative and quantitative risk assessment framework. The framework combines semivolatile organic compounds (SVOC) consumer exposure tools and damage functions. The used exposure tools were the consumer exposure models (CEM) of the US Environmental Protection Agency (US EPA) and DustEx of the Dutch National Institute for Public Health and the Environment (RIVM). These were used in the chemical substance management systems of the Toxic Substances Control Act (TSCA) and the Registration, Evaluation, Authorization and Restriction of Chemicals (REACH). Concerning plasticizers, we determined the rational values for the main parameters and estimation accuracy which have not been informed sufficiently to users. We also identified the key parameters for operating the exposure tools. The indoor concentrations of DEHP were predicted using a simple box model, and the estimation accuracies of CEM and DustEx were evaluated by comparing predicted DEHP concentrations with actual measured values. For the DEHP concentration in house dust, both CEM and DustEx had an estimation accuracy of Factor 3−1–3. In particular, in the region of LogKoa <12, DustEx tended to provide higher estimations of the dust phase concentration compared with CEM. The material/air partition coefficient Kma was the most sensitive and crucial parameter for both exposure tools. Compared with DEHP, the predictions of both exposure tools showed that the alternative plasticizers had lower exposure concentrations of 86.8%–4.5% in air and 75.5%–4.4% in dust. In addition, the damage functions for nonphthalates were newly determined, and the human health damage amount was calculated by multiplying the determined damage function by the estimated exposure concentration. The total amount of human health damage of alternative plasticizers was 59−1–655−1 compared with DEHP, indicating that the nonphthalate di(2-ethylhexyl) terephthalate (DEHT) had the highest risk reduction effect.

INTRODUCTION
Risk-based management systems for chemical substances have been established, as represented by the Registration, Evaluation, Authorization and Restriction of Chemicals (REACH) regulation (EC No. 1907/2007) of the EU and the Toxic Substances Control Act (TSCA) of the US Environmental Protection Agency (US EPA). There are three types of chemical exposure risks: to the environment, the people at work (workers), and people in their private surroundings (consumers) (Heinemeyer et al., 2019). “Consumer” denotes the general population when not at work but at home. The general population, who may be of any age and in any state of health, could be exposed to chemical substances by using consumer products or by being present when others are using products (ECHA, 2016). The rapid assessment and prioritization of the numerous chemicals in consumer product and article categories is a major focus of chemical risk management policies (Eichler et al., 2019).
Chemical exposures are typically studied by the actual measurement of the exposure concentration. However, actual measurements are time-consuming and expensive (Shi and Zhao, 2014). These two major factors challenge the execution of experimental studies. Hence, the need for efficient and effective risk-based assessment approaches drives the increased need for validated exposure models (Eichler et al., 2019). Additionally, it is important to determine the exposure dose for each route of inhalation, ingestion, and dermal absorption when considering the risk reduction countermeasures (Shi and Zhao, 2014). Mathematical models for estimating indoor exposure concentration are expected to provide this solution (Liang et al., 2019).
Furthermore, quantitative and relative risk assessment methods are needed to protect human health effectively. However, concerning the human health risk assessment of chemical exposures, comparing risks between chemical substances by the generally used margin of exposure (MOE) method is impossible (Gamo, 2012). This is because the MOE compares the toxicological threshold with the exposure for each substance, and the magnitude only indicates the level of concern and does not quantify risk (EFSA, 2012; Lachenmeier et al., 2012). The disability-adjusted life year (DALY) has been used as a common index for equivalent risk conversion in the life cycle impact assessment (LCIA) (Istubo and Inaba, 2010), and the damage function of LCIA using DALY is one of the solutions.
Concerning indoor chemical exposures, owing to the exposure to certain semivolatile organic compounds (SVOCs) that exist in consumer products, such as plasticizers and flame retardants, adverse health effects, including endocrine disruption, asthma, and allergy symptoms, have recently become significant problems (Jaakkola et al., 2004; Matsumoto et al., 2008; Manikkam et al., 2013; Wu et al., 2016). This is related not only to chemical hazards but also to high product ingredients and long-term emission to indoors, as well as complicated indoor dynamics, such as surface adsorption and distribution to suspended particles and house dust (Weschler and Nazaroff, 2008, 2010). For plasticizers and flame retardants, substitution has become an important strategy. However, there are not enough data of measured exposure concentrations available to perform comparable risk assessments for these alternatives. Therefore, this study aimed at establishing a novel relative and quantitative risk assessment framework that combines consumer exposure tools and the damage function and at evaluating the reduction effects of the exposure concentration and the human health damage of alternative plasticizers to typical plasticizers, such as di(2-ethylhexyl) phthalate (DEHP). However, when concretely assessing the risk of indoor SVOC exposure, some problems remain to be solved for both the exposure and hazard assessments.
The history of developing the mathematical models of SVOC exposure has been described in detail by Liang et al. (2019). Concerning applications to the chemical substance management system, the consumer exposure estimation tools recommended for REACH are shown by ECHA (2016) and Eichler et al. (2019). Among them, the consumer exposure models (CEM) of the US EPA and the integrated exposure for risk assessment in indoor environments (INTERA) of the European Chemical Industry Council (CEFIC) support indoor SVOC exposure. The DustEx tool, developed by the Dutch National Institute for Public Health and the Environment (RIVM) under CEFIC’s long-range research initiative (LRI) project, has also been shown as a tool used in REACH by Wijnhoven and Affourtit (2018).
One of the most important factors with regard to operating these exposure tools is to determine suitable datasets for the input parameters because some parameters are difficult for users to collect data and to set rational values. As described by Little et al. (2012), these difficult parameters include the chemical substance concentration in the layer adjacent to the emission surface C0 (material/air partition coefficient Kma), mass transfer coefficient hm, suspended particle/air partition coefficient Kp, and octanol/air partition coefficient Koa. Sufficient studies have not been conducted to determine rational parameter values, even in various exposure model studies, such as in the study performed by Liang et al. (2019).
Another important factor is to determine the estimation accuracy of the exposure concentration and the sensitivity of parameters to estimated concentrations, as the estimated exposure concentration is directly linked to the risk-based assessment. Sensitivity analyses also clarify the important parameters for operating the tools. However, from a user’s point of view, tool developers have not provided sufficient information to users regarding this kind of information. Hence, in this study, we also aimed at determining the rational values for the main parameters and at revealing the key parameters and estimation accuracy of exposure tools.
Meanwhile, Bui et al. (2016) investigated the risks of the alternative plasticizers to phthalate esters. Bui et al. (2016) stated that there were very few studies on the risks of alternative plasticizers, and they proposed a method that estimated the human intake rate of phthalates and alternative plasticizers from the literature survey, compared intake rates with limit values taken from the derived no-effect levels (DNEL) of the European Chemicals Agency (ECHA), and calculated the risk ratios of phthalates and alternative plasticizers. However, their risk ratios only showed the margin with the limit values of each substance, and it was impossible to compare the magnitude of risk between substances. Therefore, in this study, it was necessary to employ the damage function of LCIA using DALY, to modify it for risk assessment, and then, to evaluate the relative risk between plasticizers (Aoki et al., 2020).
Usually, the health impacts of indoor chemical exposures are neglected in LCIA methods, although the concentrations of chemicals indoors are typically higher than those outdoors. Additionally, people spend most of their time indoors (Hellweg et al., 2009). Hellweg et al. (2009) summarized historic approaches to indoor chemical exposure and the LCIA of Meijer et al. (2005a, 2005b) and Hellweg et al. (2005). Recently, some impressive works have tried to integrate indoor exposure models within the environmental models of LCIA. Istubo and Inaba (2010) determined the damage functions of the sick building syndrome (SBS) for several indoor chemicals, such as formaldehyde, in the Japanese LCIA method based on endpoint modeling (LIME2). Also, Rosenbaum et al. (2015) determined characterization factors of the indoor chemical exposure for human health by incorporating the indoor compartment into the USEtox model of Rosenbaum et al. (2008) and by applying the indoor intake fraction considering the surface sorption of the air organic compounds of Wenger et al. (2012).
However, indoor SVOC exposures have not been studied enough in LCIA methods due to the new impact category. Concretely, the indoor model of Wenger et al. (2012) applied in the USEtox model considered the effects of partitioning to airborne particles and surface adsorption, but it did not consider the exposure of SVOC in settled house dust (Wenger et al., 2012). In contrast, Aoki et al. (2020) determined the noncarcinogenic damage functions of phthalate-based plasticizers for the relative health risk assessment by modifying the method of Pennington et al. (2002) in consideration of indoor SVOC dynamics. Based on Aoki et al. (2020), this study extended to nonphthalic plasticizers.
Thus, in this study, we quantitatively and relatively evaluated the reduction effects of the exposure concentration and the human health damage of alternative plasticizers to DEHP, by using SVOC consumer exposure tools and damage functions. In the process, for plasticizers, the rational datasets of major complicated parameters, such as the mass transfer coefficient and the material/air partition coefficient of the CEM and DustEx tools, were determined. Also, the estimation accuracy was identified, and the damage functions of nonphthalates were further determined. This risk assessment method can have an important impact on chemical management because it can easily evaluate the relative risk between chemicals.
MATERIALS AND METHODS
TARGET PLASTICIZERS
Phthalates and alternative plasticizers are SVOCs, which form an important class of the indoor pollutants that may have significant adverse effects on human health (Wu et al., 2016). DEHP, diisononyl phthalate (DINP), diisodecyl phthalate (DIDP), and di(2-propylheptyl) phthalate (DPHP) are the four plasticizers with the highest production volume in Japan (JPIA, 2016). The market for plasticizers in Japan and Europe substantially differs. For example, in Japan’s plasticizer market (JPIA, 2016), the production volume ratio of DEHP exceeds 50%. In contrast, the production volume ratio of DEHP in Europe is only ~10% (JPIA, 2016). DINP and DIDP are used for similar general purposes as DEHP and serve as substitutes (FSC, 2013; JEITA, 2016; Shu et al., 2018). DPHP is a structural isomer of DIDP and is a known plasticizer with the same physicochemical properties of DIDP (Kozlowski and Storzum, 2005).
DEHP has been a regulated substance in Japan, the United States, and Europe (the same as DINP and DIDP) with regard to its use in toys and childcare articles. However, in Europe, the amendment to Entry 51 of Annex XVII of REACH extended the scope of DEHP restrictions to all articles with some exceptions (EU, 2018). This amendment was applied after July 7, 2020. Thus, the replacement of DEHP is expected to continue in the future.
In this study, DEHP and its major alternative plasticizers in Japan, as well as DINP and DIDP, were selected as target substances. DPHP, which is a structural isomer of DIDP, was excluded from the target substances because experimental data on the vapor pressure could not be collected. In addition, 1,2-cyclohexanedicarboxylic acid, diisononyl ester (DINCH) and di(2-ethylhexyl) terephthalate (DEHT) were added as target substances because they are nonphthalate plasticizers and are expected to be extensively used as alternative plasticizers in Japan in the future (Isazawa, 2015; Bui et al., 2016; Wu et al., 2016; Xie et al., 2016). DINCH is a hydrogen adduct of DINP and has a molecular weight of 424.67 g/mol, which is larger than DINP’s molecular weight of 418.62 g/mol. Thus, it is expected to have a lower emission rate than that of DINP (Hirata et al., 2012). DEHT is the structural isomer of DEHP and has higher hydrolyzability than DEHP (Isazawa, 2015). Also, DEHT has a higher emission rate of 2-ethyl-1-hexanol (2E1H) than DEHP because of its higher hydrolyzability (Isazawa, 2015).
EXPOSURE TOOLS
We estimated the indoor exposure concentrations of DEHP and its alternative plasticizers by using CEM and DustEx, which are used in chemical substance management systems as part of the assessment process for relative changes in the indoor environmental risks associated with DEHP substitution. INTERA was excluded from this study because it is not currently updated or maintained.
CEM ver 2.1 (ICF, 2019)
CEM is a consumer exposure estimation tool built in Microsoft Access. CEM was originally developed as a module within the US EPA’s exposure and fate assessment simulation tool (E-FAST), and it can be extensively used for various consumer products and indoor-use environments, such as residences, offices, schools, and automobiles. The current version includes six emission models, three inhalation models, five ingestion models, and seven dermal models. Notably, models for estimating the exposure to SVOCs from consumer articles have been incorporated, including a mass-balanced model for estimating the emissions and indoor fate and transport of SVOCs. CEM adopts two-zone models, namely Zone 1 and Zone 2. Zone 1 represents the area where a consumer product is used, and Zone 2 is the remainder of the building. CEM does not have the probabilistic processing function of the Monte Carlo method. Thus, it cannot deal with the parameter uncertainty as RIVM’s ConsExpo can. Also, it does not have a sensitivity analysis function. The emission model E6, which is the only internal model for articles, was used in this study. This model assumes the partitioning of the gaseous SVOC emitted from a product to suspended particles and settled dust and does not consider the direct transfer of SVOC from a product to settled dust. The published CEM’s parameters and estimation equations are shown in Tables SA-1 and SA-2 in the Supplementary Material, respectively.
DustEx ver. 1.0 (RIVM, 2018a; 2018b)
DustEx was developed by RIVM and ETH Zürich in the CEFIC LRI project B12. DustEx is used to assess exposure based on the SVOCs in various products, such as flooring materials, wall covering materials, and electronic devices. DustEx calculates the daily average exposure through each of these four pathways: inhalation of a substance in the gas phase, inhalation of a substance bound to airborne particles, dermal absorption of a substance from air (gas phase), and oral ingestion of a substance with dust. Also, DustEx supports probabilistic evaluations like ConsExpo, but it does not have a sensitivity analysis function. The published DustEx’s estimation equations are shown in Table SA-3 in the Supplementary Material. The structure of DustEx’s estimation equations is similar to but simpler than those of CEM. The major differences between CEM and DustEx are as follows: DustEx does not consider the resuspension of suspended particles, and the radius of particulate matter cannot be set by users.
MAIN PHYSICOCHEMICAL PARAMETERS FOR SIMULATING THE EMISSIONS OF DEHP AND ITS ALTERNATIVES
CEM and DustEx are useful for various parties (e.g., consumers, government agencies, consumer product manufacturers, architects) with regard to estimating SVOC exposures and identifying exposure routes and health risks. However, a great deal of uncertainty exists in the physicochemical properties of SVOC. Thus, setting rational values for the parameters of CEM and DustEx is difficult. To deal with this problem, the physicochemical property data of the main parameters of target plasticizers were collected using literature surveys, and the uncertainty of the parameters was examined. The information on setting the main physicochemical parameters was summarized in section SB of the Supplementary Material.
INDOOR ROOM MODEL FOR EXPOSURE ASSESSMENT
To understand the exposure estimation characteristics of CEM and DustEx, the model of Little et al. (2012) was used. Table 1 shows the common exposure factors of Little et al.’s indoor model (Addington et al., 2020). However, some exposure factors were modified in this study. Concretely, the ceiling height is not denoted in Little et al.’s model. Thus, the typical height was used. The floor area was calculated from the room volume and ceiling height. The ventilation rate of 50 m3/h in Little et al.’s model is generally high, and the ventilation frequency of CEM is fixed at 0.45 times/h, so that the ventilation rate was set to 22.5 m3/h. For the emission surface area, 15 m2 (model of Addington et al. (2020)) was used instead of 20 m2 (model of Little et al. (2012)). This was also reasonable from the viewpoint of the surface area to volume ratio of 0.22 m2/m3 (model of Liang et al. (2019)). DEHP was selected as the target substance because DEHP has more field data than the alternatives. Vinyl flooring was selected as the evaluated article because the main source of indoor DEHP is vinyl flooring (Liang et al., 2019). The other parameter values inputted for CEM and DustEx are shown in Tables SC-1 and SC-2.
Table 1 Indoor exposure factors
To evaluate the exposure estimation characteristics of CEM and DustEx, the predicted DEHP concentrations in air and settled house dust were compared with the field data. For the alternative plasticizers, DINP, DIDP, DINCH, and DEHT, the concentrations in air and settled house dust were estimated using a similar method to that of DEHP, and the results were compared with those of DEHP.
SENSITIVITY ANALYSIS
The sensitivity of each parameter to the exposure concentration was analyzed. The sensitivity ratio was determined from Eqs. (1) and (2) by calculating the change in the estimated DEHP exposure concentrations of CEM and DustEx per 10% increase in the input variable (ICF, 2017). Variable parameters were determined for CEM and DustEx with reference to previous studies on sensitivity and uncertainty analyses (Xu et al., 2010; Shi and Zhao, 2012, 2014; Liang et al., 2019). To make it easier to understand the results, a sensitivity ratio of ± 0.5 was used as the threshold value.
|
Sensitivity Ratio=
(
Y
2
-
Y
1
)
/
Y
1
(
X
2
-
X
1
)
/
X
1
| (1) |
where
X is the input variable,
Y is the estimated concentration, and
σ is the percentage change (10%).
HUMAN HEALTH DAMAGE AMOUNT
The damage function shows the increment of human health damage associated with the increment of chemical exposure. The human health damage amount can be calculated by multiplying the damage function of the hazard index by the exposure concentration. Here, the exposure concentrations estimated by CEM were employed because DustEx had problems with the ventilation equation for the particles in air, as shown in the Supplementary Material.
The damage functions of DEHP, DINP, and DIDP were derived by Aoki et al. (2020), and the damage functions of DINCH and DEHT were additionally calculated using the same method in the present study. Concretely, for risk assessment, we modified the fundamental damage function for noncarcinogenic substances developed by Pennington et al. (Pennington et al., 2002; Aoki et al., 2020). The damage functions DF for inhalation and oral exposure in this study are shown in the following equations.
|
Inhalation exposure:DF=
β
ED10
×L
T
h
-1
×DAL
Y
p
| (3) |
where
βED10 is the slope factor,
LTh is the lifetime of human, and
DALYp is the DALY per incidence. The units of
DF and
βED10 are year-lost/(mg/m
3) and incident/(mg/m
3), respectively.
|
Oralexposure:DF=
β
ED10
×B
W
-1
×INR×L
T
h
-1
×DAL
Y
p
| (4) |
where
BW is the body weight, and
INR is the ingestion rate (g/day). The units of
DF and
βED10 are year-lost/(mg/g) and incident/(mg/kg/day), respectively.
Details of the damage function are described in section SG of the Supplementary Materials. The hazard information is shown in Supplementary Table SG-1, and the damage functions are summarized in Supplementary Table SG-2.
To simply understand the trade-off relationship of the damage amount at the substitution, the SVOC concentration in the product Cprod was assumed to be similar between each substance, and the calculation was performed using the same Cprod value (Liang and Xu, 2014; Eichler et al., 2018).
RESULTS AND DISCUSSION
MAIN PHYSICOCHEMICAL PARAMETERS FOR SIMULATING THE EMISSIONS OF DEHP AND ITS ALTERNATIVES
We collated the physicochemical property data of main parameters for target plasticizers by literature surveys, determined the rational values, and examined the uncertainty of parameters. Table 2 summarizes the main physicochemical values used in this study. These details are summarized in section SB of Supplementary Materials.
Table 2 Determined physicochemical properties of plasticizers
| DEHP | DINP | DIDP | DINCH | DEHT | Reference |
|---|
| Cas No. | 117-81-7 | 28553-12-0 | 26761-40-0 | 166412-78-8 | 6422-86-2 | |
| Vapor pressure, Vp*10−6 (Pa) | 16 | 2.3 | 0.6 | 9.2 | 2.7 | Wu et al. (2016) |
| Vapor pressure, Vp*10−6 (mmHg) | 0.12 | 1.7E-2 | 4.5E-3 | 6.9E-2 | 2.0E-2 | Wu et al. (2016) |
| Octanol/air partition coefficient, LogKoa | 11.43 | 12.26 | 12.84 | 11.67 | 11.71 | Median in Table SB-2 |
| Material/air Partition coefficient, LogKma | 11.06 | 11.88 | 12.43 | 11.27 | 11.84 | Eichler et al. (2018) |
| Particle/air partition coefficient, Kp (m3/μg) | 0.221 | 1.12 | 3.77 | 0.322 | 0.164 | Median in Table SB-4 |
| Mass transfer coefficient, hm (m/h) | 1.31 | 1.26 | 1.21 | 1.25 | 1.31 | Sparks et al. (1996) |
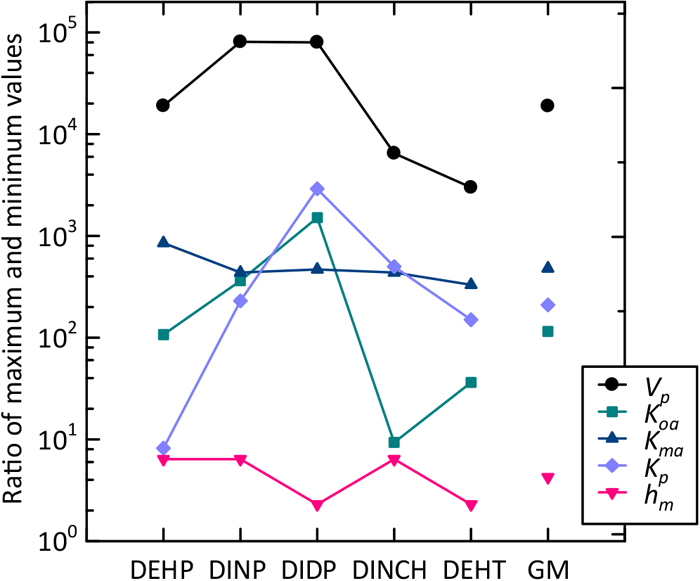
Fig. 1 shows the ratios of the maximum and minimum values of each parameter for each plasticizer. Here, this ratio was used as an index of the uncertainty associated with the exposure tool parameters. The geometric means of the ratios of the maximum and minimum values were larger than two orders of magnitude, except for the mass transfer coefficient hm. It was not possible to use the physicochemical values of various databases and reported literature values without scrutinizing them because of the large uncertainty.
In particular, as shown in the Supplementary Material, the vapor pressure affects other parameters because it is used as a variable of the estimation equation for other parameters except for the mass transfer coefficient hm, such as the octanol/air partition coefficient Koa, material/air partition coefficient Kma, and suspended particle/air partition coefficient Kp.
As shown in Fig. 1, the ratios of the maximum and minimum reported vapor pressures of DEHP and its alternatives were distributed between 3.0E+3 and 8.1E+4. This uncertainty is due to the difficulty in measuring the vapor pressure of SVOC (Wu et al., 2016). The progress of the experimental research on vapor pressure would lead to improvements in the estimation accuracy of other parameters, such as Kma, and finally to the improvement of the estimation accuracy of the exposure concentration.
COMPARISON OF THE ESTIMATED AND MEASURED CONCENTRATIONS OF DEHP
The DEHP concentrations in air and house dust, which were estimated by CEM and DustEx, were compared with the field measurement concentrations, and their estimation characteristics were evaluated. As actual measurement data of DEHP, we selected the studies of Rudel et al. (2003), Fromme et al. (2004), Kanazawa et al. (2010), Bergh et al. (2011), Blanchard et al. (2014), and Luongo and Östman (2016) for comparison purposes because they have air and dust phase concentrations. Table SD-1 in the Supplementary Material shows the field measurement concentrations of DEHP in indoor air and house dust.
Meanwhile, Table 3 shows the estimated concentrations by CEM and DustEx. The estimated concentrations are average values for one year. For CEM, three types of particulate matter in air were defined: respirable particles (RP), abraded particles, and dust. Given that the “Particle” column in Table 3 is consistent with the results of DustEx, the RP data are listed. The concentrations of the abraded particles and dust are included in the “Total” column. The ratio of the estimated concentration to the measured concentration is defined as Factor. Concretely, it was obtained by dividing the estimated concentration by the average measured concentration in Table SD-1. Empirically, Factor 10−1–10 is defined as the screening assessment accuracy, and Factor 3−1–3 is defined as the higher tier assessment accuracy. Factor 10 of the screening assessment accuracy and Factor 3 of the higher tier assessment accuracy were used as criteria for the Factor value of the conservative estimation, respectively (Keil et al., 2009; Weschler and Nazaroff, 2010).
Table 3 Estimated concentration data of DEHP in indoor air and house dust
| in air | in house dust |
|---|
| Conc. (μg/m3) | Gas/Total (%) | Factor | Conc. (μg/g) | Factor |
|---|
| Gas | Particle | Total |
|---|
| Exposure tool | | | | | | | |
| CEM | 0.225 | 0.156 | 0.387 | 58 | 2.8 | 423 | 0.69 |
| DustEx | 0.207 | 0.447 | 0.653 | 32 | 4.7 | 1,360 | 2.2 |
| Measurement data | | | | | | | |
| Average | — | — | 0.138 | — | — | 610 | — |
| Blanchard et al. | 0.005 | 0.0415 | 0.0465 | 11 | — | 289 | — |
For the estimated DEHP concentration in house dust, the higher tier assessment accuracy of 3−1–3 was obtained for CEM and DustEx. For the estimated DEHP concentration in air, CEM and DustEx had the screening assessment accuracy of Factor 10. For CEM, the higher tier assessment accuracy of Factor 3 was also obtained. However, for CEM, the gas phase concentration fraction in air was 58%, which significantly differed from the 11% found by Blanchard et al. (2014), who separately measured the gas- and particle-phase concentrations in air. Even in other model predictions, the estimated fractions of gas- and particle-phase concentrations did not completely reproduce the measured fraction (Liang et al., 2019). This may be due to a technical issue that needs to be resolved. However, here, the estimation accuracy of the total gas- and particle-phase concentrations in air is more important from the viewpoint of calculating the human health damage amount due to inhalation exposure.
For DustEx, the estimation equation (SA-18) related to ventilation revealed that the ventilation effect may have been ignored or omitted for the air particles. The particle phase concentration may have been estimated higher than that of CEM. The details are reported in section SF in the Supplementary Material.
ESTIMATED CONCENTRATIONS OF THE ALTERNATIVE PLASTICIZERS
For DINP, DIDP, DINCH, and DEHT, the concentrations in air and house dust were estimated for the indoor exposure assessment model shown in Table 1, the same as DEHP. The estimated exposure concentrations of the alternative plasticizers and their ratios (%) compared with those of DEHP are shown in Table SE-1.
In the case of CEM, the air concentration decreased from 53.2% (DINCH) to 4.5% (DIDP), whereas the concentration of the house dust phase decreased from 75.5% (DINCH) to 13.5% (DIDP). In the case of DustEx, the air concentration decreased from 86.8% (DINCH) to 25.3% (DEHT), and the concentration of the house dust phase decreased from 61.8% (DINCH) to 4.4% (DIDP). In particular, in the region of LogKoa <12 for DEHP, DINCH, and DEHT, the dust phase concentration of DustEx tended to be higher than that of CEM.
Overall, the alternative plasticizers showed lower exposure concentrations of 86.8%–4.5% in air and 75.5%–4.4% in dust. Thus, the lowering effect of the exposure concentrations by the substitution was confirmed.
SENSITIVITY ANALYSIS
A sensitivity analysis was performed for DEHP with CEM and DustEx, respectively. In addition to the parameters related to the section of “Main physicochemical parameters for simulating the emissions of DEHP and its alternatives” in RESULTS AND DISCUSSION, the parameters related to the product specifications, total suspended particle concentration, cleaning frequency, and ventilation rate were used as variables. However, some parameter names had different expressions between CEM and DustEx. The ventilation rate of CEM was fixed. Thus, it could not be used as a variable.
The results of the sensitivity analyses for CEM and DustEx are shown in Table 4. The product surface area and SVOC concentration in the product were directly related to the emitted SVOC amount. Thus, they showed sensitivity ratios close to 1 in the air and dust phase concentrations.
Table 4 Sensitivity ratio of the predicted concentrations to the selected model parameters for CEM and DustEx
| CEM’s Variables | Baseline value | Sensitivity Ratio |
|---|
| in air | in house dust |
|---|
| Gas | Particle | Total |
|---|
| Product surface area (A, m2) | 15 | 1.00 | 1.00 | 0.98 | 0.91 |
| Initial Concentration of SVOC in Article (Cprod, mg/cm3) | 225 | 1.02 | 1.02 | 1.02 | 1.02 |
| Vapor pressure (torr) | 1.20E-07 | 0.00 | 0.00 | 0.00 | 0.00 |
| Substance Koa (Log Koa) | 11.43 | 0.00 | 0.00 | 0.00 | 0.00 |
| Solid-Air Partition Coefficient (Kma) | 1.15E+11 | −1.06 | −1.06 | −1.05 | −0.97 |
| SVOC Partition Coefficient, RP (Kp, m3/mg) | 221 | −0.17 | −0.02 | −0.11 | 0.68 |
| SVOC Partition Coefficient, Dust (Kdust, m3/mg) | 26.92 | 0.00 | 0.00 | 0.00 | 0.00 |
| Gas Phase Mass Transfer Coefficient for surfaces (hm, m/h) | 1.31 | 0.59 | 0.59 | 0.58 | 0.54 |
| Total suspended particle concentration (TSP, mg/m3) | 0.02 | −0.26 | 0.73 | 0.14 | 0.66 |
| Cleaning Frequency (per hour) | 0.006 | 0.01 | 0.00 | 0.00 | −0.03 |
| DustEx’s Variables | | | | | |
| Product surface area (A, m2) | 15 | 0.97 | 0.90 | 0.92 | 0.88 |
| Concentration of the substance in the product (Cprod, g/cm3) | 0.225 | 0.97 | 1.04 | 1.02 | 1.03 |
| Substance Koa (Log Koa) | 11.43 | 0.00 | 0.90 | 0.61 | 0.15 |
| Kma (Log Kma) | 11.06 | −0.97 | −0.90 | −0.92 | −0.88 |
| Gas Phase Mass Transfer Coefficient for surfaces (hm, m/hr) | 1.31 | 0.32 | 0.30 | 0.31 | 1.03 |
| Air concentration particulate matter (TSP, μg/m3) | 20 | 0.00 | 1.04 | 0.71 | 0.15 |
| Ventilation rate (times/h) | 0.45 | 0.00 | −0.15 | −0.10 | 0.00 |
| Elimination rate from indoor environment (per year) | 3 | 0.00 | 0.00 | 0.00 | −0.44 |
In the case of CEM, apart for them, the highly sensitive parameters in the air and dust phase concentrations were the material/air partition coefficient Kma of −1.05, −0.97 and the mass transfer coefficient hm of 0.58, 0.54, respectively. The sensitivity ratio of Kma was high because Kma is a parameter involved in the generation of gaseous SVOC, and both tools assumed the distribution of the generated gaseous SVOC in the suspended particles and floor dust. The highly sensitive parameter related to the suspended particles was the total suspended particle concentration TSP of 0.73. TSP showed opposite effects of 0.73 and −0.26 on the sensitivity ratios of the suspended particle-phase and gaseous concentrations, respectively. The highly sensitive parameters related to house dust were the suspended particle/air partition coefficient Kp (0.68) and TSP (0.66).
In the case of DustEx, except for the product surface area and the SVOC concentration in the product, the highly sensitive parameter in the air and dust phase concentrations was the material/air partition coefficient Kma of −0.92, −0.88. The highly sensitive parameters related to the suspended particles were the octanol/air partition coefficient Koa of 0.90 and TSP of 1.04. The highly sensitive parameter related to house dust was the mass transfer coefficient hm of 1.03.
As mentioned in the paper published by Aoki et al. (2020), for SVOC, oral exposure is dominant with regard to the health damage amount. The product surface area A, SVOC concentration in a product Cprod, material/air partition coefficient Kma, and mass transfer coefficient hm showed high sensitivity ratios for the dust phase concentration with the two tools. Therefore, these parameter settings require attention. In terms of the parameter uncertainty, excluding A and Cprod related to product specifications, the maximum/minimum ratio of hm in Table SB-5 was 4.25 on the geometric means, whereas that of Kma in Table SB-3 was 479. The uncertainty of Kma was 113 times larger than that of hm, indicating that Kma is the most crucial parameter to set. To improve the estimation accuracy, it is necessary to further advance the actual measurement research of Kma so as to refine the parameter estimation approaches, such as the quantitative structure-activity relationship (QSAR), and construct an exposure model to deal with the large uncertainty of Kma.
DETERMINATION OF THE DAMAGE FUNCTION FOR NONPHTHALATE PLASTICIZERS AND QUANTITATIVE COMPARISON OF HUMAN HEALTH DAMAGE
The damage functions are summarized in Supplementary Table SG-2. Huijbregts et al. (2005) reported 3.50E-2 year-lost/kg (oral route) of the noncarcinogenic damage function of DEHP. When the unit was converted according to this study, the damage function became 6.39E-7 year-lost/(mg/g). The damage function of the oral exposure of DEHP in Table SG-2 was 5.7 times larger than that reported by Huijbregts et al. (2005). This difference was because Pennington et al. (2002) used 10% effective dose (ED10) and Huijbregts et al. (2005) used 50% effective dose (ED50). The details of the calculation method of the damage function were also different.
The damage functions of the alternative plasticizers in the inhalation route were 15−1 (DIDP)–112−1 (DEHT) compared to those of DEHP. Moreover, the damage functions of the oral route were 17−1 (DINP)–112−1 (DEHT), those of DEHP. For both routes, the damage function was reduced by substituting DEHP, and the damage functions of DINCH and DEHT of the nonphthalates among the alternative plasticizers were smaller. Concretely, compared with the damage function of the phthalate DINP, the nonphthalate DINCH was 2.7−1 and DEHT was 6.8−1 in the inhalation and oral routes. These findings indicate that the hazardous effects were further reduced in the case of the nonphthalates.
In addition, risk assessments not only require the damage function but also the exposure concentration. The human health damage (year-lost) was calculated by multiplying the damage function shown in Table SG-2 by the estimated exposure concentration of CEM shown in Table SE-1, as shown in Table 5. The total damage, which was obtained by adding the human health damage amount of the inhalation route and that of the oral route, was 59−1 (DINP)–655−1 (DEHT) that of DEHP. This result shows that the damage amount can be reduced by substituting DEHP and that the effect is highest in the case of DEHT.
Table 5 Human health damage amount calculated by the damage functions and the exposure concentrations of CEM
| Substance | Damage amount (year-lost) | Normalized total damage amount
(unitless) |
|---|
| Inhalation | Oral | Total |
|---|
| DEHP | 1.05E-09 | 1.55E-09 | 2.60E-09 | 1 |
| DINP | 6.44E-12 | 3.75E-11 | 4.39E-11 | 59−1 |
| DIDP | 3.06E-12 | 1.12E-11 | 1.42E-11 | 183−1 |
| DINCH | 1.27E-11 | 2.65E-11 | 3.92E-11 | 66−1 |
| DEHT | 1.40E-12 | 2.57E-12 | 3.96E-12 | 655−1 |
DEHT is one of the most promising alternative plasticizers in Japan from the viewpoint of its raw materials (Isazawa, 2015). However, the amount of 2E1H, which is classified as a volatile organic compound and is emitted by hydrolysis, is 13 times larger than that for DEHP (Isazawa, 2015). This finding shows that comprehensive risk assessments including the target substance and byproducts are further required to ultimately determine an optimal alternative substance to DEHP. Correspondingly, our relative risk assessment framework, which uses the exposure tool and the damage function based on the peer-reviewed and publicly available hazard information, can also be easily extended to the combined exposure of heterogeneous chemicals, such as VOC and SVOC.
CONCLUSION
Concerning exposure tools, the rational values of the main parameters for plasticizers, which have not been sufficiently examined in previous studies, were determined by literature surveys. Under estimation conditions based on them, the estimation accuracy was Factor 3−1–3 for the DEHP concentration in air and dust. The performed sensitivity analysis clarified that Kma is the most influential parameter for exposure concentrations in both air and house dust.
We also evaluated the lowering effect of the exposure concentrations of alternative plasticizers, which have longer molecular chains and are expected to suppress their release into indoor environments. Compared with DEHP, the alternative plasticizers showed lower exposure concentrations of 86.8%–4.5% in air and 75.5%–4.4% in dust.
In addition, the relative risk assessment conducted using damage functions clarified that the human health damage amount of alternative plasticizers is 59−1–655−1 that of DEHP. DALY is a common index for risk assessment, and the health damage amount can be compared and added for each exposure route and substance. By using suitable exposure tools and damage functions for target substances and byproducts, this risk assessment framework can be easily expanded to comprehensive risk assessments from the perspective of exposure routes and exposure substances.
ACKNOWLEDGEMENTS
The authors thank Dr. Mianqiang Xue, Prof. Takeshi Nakano, and the anonymous reviewers for their valuable suggestions to improve the quality of this paper.
FUNDING
This research did not receive any specific grant from funding agencies in the public, commercial, or not-for-profit sectors.
CONFLICT OF INTEREST
The authors declare that they have no conflict of interest.
SUPPLEMENTARY MATERIAL
Section SA. Comparison of exposure tools; Section SB. Important parameters; Section SC. Input parameters used in this study for exposure estimation of CEM and DustEx; Section SD. Comparison of estimated and measured concentrations of DEHP; Section SE. Estimated concentrations of alternative plasticizers; Section SF. Relationship of estimated air concentration of CEM and DustEx with ventilation; Section SG. Determination of damage function for nonphthalate plasticizers and quantitative comparison of human health damage.
This material is available on the Website at https://doi.org/10.5985/emcr.20210010.
REFERENCES
- Addington, C.K., Phillips, K.A., Isaacs, K.K., 2020. Estimation of the Emission Characteristics of SVOCs from Household Articles Using Group Contribution Methods. Environ. Sci. Technol. 54, 110–119. doi: 10.1021/acs.est.9b06118.
- Aoki, Y., Kojima, N., Ito, L., Tokai, A., Hanai, S., 2020. Determination of the damage function considering equilibrium partitioning of semivolatile organic compounds and the application for indoor health risk assessment. Proceedings of the 16th Conference of the International Society of Indoor Air Quality & Climate, ABS-0555, Seoul.
- Bergh, C., Torgrip, R., Emenius, G., Östman, C., 2011. Organophosphate and phthalate esters in air and settled dust–a multi-location indoor study. Indoor Air. 21, 67–76. doi: 10.1111/j.1600-0668.2010.00684.x.
- Blanchard, O, Glorennec, P., Mercier, F., 2014. Semivolatile organic compounds in indoor air and settled dust in 30 French dwellings. Environ Sci Technol. 48(7), 3959–3969. doi: 10.1021/es405269q.
- Bui, T.T., Giovanoulis, G., Cousins, A.P., Magner, J., Cousins, I.T., de Wit, C.A., 2016. Human exposure, hazard and risk of alternative plasticizers to phthalate esters. Sci. Total Environ. 541, 451–467. doi: 10.1016/j.scitotenv.2015.09.036.
- Commission regulation (EU), 2018. 2018/2005, (of 17 December 2018) amending Annex XVII to regulation (EC) No 1907/2006 of the European parliament and of the council concerning the registration, evaluation, authorization and restriction of chemicals (REACH) as regards Bis(2-ethylhexyl) phthalate (DEHP), Dibutyl phthalate (DBP), Benzyl butyl phthalate (BBP) and Diisobutyl phthalate (DIBP). https://eur-lex.europa.eu/legal-content/EN/TXT/?qid=1547003781168&uri=CELEX:32018R2005 (accessed 7 June 2020)
- Eichler, C.M.A., Wu, Y., Cao, J., Shi, S., Little, J.C., 2018. Equilibrium relationship between SVOCs in PVC products and the air in contact with the product. Environ. Sci. Technol., 52, 2918–2925. doi: 10.1021/acs.est.7b06253.
- Eichler, C.M.A., Hubal, E.A.C., Little, J.C., 2019. Assessing human exposure to chemicals in materials, products and articles: The international risk management landscape for phthalates. Environ. Sci. Technol. 53, 13583–13597. doi: 10.1021/acs.est.9b03794.
- Environmental committee, Japan electronics and information technology industries association (JEITA), 2016. https://home.jeita.or.jp/eps/euRoHS.html (accessed 7 June 2020) (in Japanese)
- European Chemicals Agency (ECHA), 2016. Guidance on Information Requirements and Chemical Safety Assessment Chapter R.15: Consumer exposure assessment. ECHA-16-G-07-EN, 62–66.
- European Food Safety Authority (EFSA), 2012. Statement on the applicability of the margin of exposure approach for the safety assessment of impurities which are both genotoxic and carcinogenic in substances added to food/feed. EFSA J. 10(3), 2578. doi: 10.2903/j.efsa.2012.2578.
- Food safety commission, Cabinet office, Government of Japan (FSC), 2013. http://www.fsc.go.jp/fsciis/attachedFile/download?retrievalId=kai20130711ky1&fileId=120 (accessed 7 June 2020) (in Japanese)
- Fromme, H., Lahrz, T., Piloty, M., Gebhart, H., Oddoy, A., Rüden, H., 2004. Occurrence of phthalates and musk fragrances in indoor air and dust from apartments and kindergartens in Berlin (Germany). Indoor Air. 14(3), 188–195. doi: 10.1111/j.1600-0668.2004.00223.x.
- Gamo, M., 2012. Risk assessment and management of chemical centering on human health effects of air pollutants -2. Risk assessment method and risk comparison-. J. Jpn. Soc. Atmos. Environ. 47(3), A23–A28. (in Japanese)
- Heinemeyer, G., Jantunen, M., Hakkinen, P., 2019. The practice of consumer exposure assessment editors, 1st ed., pp.1–3, Springer, Cham.
- Hellweg, S., Demou, E., Scheringer, M., McKone, T.E., Hungerbuehler, K. 2005., Confronting workplace exposure to chemicals with LCA: The examples of trichloroethylene and tetrachloroethylene in metal-degreasing and dry-cleaning. Environ. Sci. Technol. 39, 7741–7748. doi: 10.1021/es047944z.
- Hellweg, S., Demou, E., Bruzzi, R., Meijer, A., Rosenbaum, R.K., Huijbregts, M.A.J., McKone, T.E., 2009. Integrating indoor air pollutant exposure within life cycle impact assessment. Environ. Sci. Technol. 43, 1670–1679. doi: 10.1021/es8018176.
- Hirata-Koizumi, M., Takahashi, M., Matsumoto, M., Kawamura, T., Ono, A., Hirose, A., 2012. Toxicity effects of phthalate substitute plasticizers used in toys. Bull. Natl. Inst. Health Sci. 130, 31–42. (in Japanese)
- Huijbregts, M.A.J., Rombouts, L.J.A., Ragas, A.M.J., van de Meent, D., 2005. Human-toxicological effect and damage factors of carcinogenic and noncarcinogenic chemicals for life cycle impact assessment. Integr. Environ. Assess. Manag. 1(3), 181–244.
- ICF, 2017. Consumer Exposure Model (CEM) Appendices prepared for EPA office of pollution prevention and toxics. https://www.epa.gov/sites/production/files/2017-06/documents/cem_user_guide_appendices.pdf (accessed 7 June 2020)
- ICF, 2019. Consumer exposure model (CEM) user guide prepared for EPA office of pollution prevention and toxics. https://www.epa.gov/sites/production/files/2019-06/documents/cem_2.1_user_guide.pdf (accessed 7 June 2020)
- Isazawa, S., 2015. Analysis on VOC emission of vinyl floor covering based on alternative plasticizer. Proceedings of annual meeting of Japan society for finishing technology, 99–102, JSFT, Tokyo. doi: 10.14820/finex.2015.0_23. (in Japanese)
- Istubo, N., Inaba, A., 2010. LIME2 Life-cycle impact assessment method based on endpoint modeling, pp. 372–441, Maruzen, Tokyo. (in Japanese)
- Jaakkola, J.J., Parise, H., Kislitsin, V., Lebedeva, N.I., Spengler, J.D., 2004. Asthma, wheezing, and allergies in Russian schoolchildren in relation to new surface materials in the home. Am. J. Public Health. 94(4), 560–562.
- Japan plasticizer industry association (JPIA), 2016. https://docs.wixstatic.com/ugd/c86bef_1d6183136ccd440693f9b31ac9923bd7.pdf (accessed 31 January 2022) (in Japanese)
- Kanazawa, A., Saito, I., Araki, A., 2010. Association between indoor exposure to semi-volatile organic compounds and building-related symptoms among the occupants of residential dwellings. Indoor Air. 20(1), 72–84. doi: 10.1111/j.1600-0668.2009.00629.x.
- Keil, C.B., Simmons, C.E., Anthony, T.R., 2009. Mathematical models for estimating occupational exposure to chemicals, 2nd ed., pp. 175–177, AIHA, Fairfax.
- Kozlowski, R.R., Storzum, U., 2005. Di (2-propylheptyl) phthalate: A new plasticizer choice for PVC compounders. J. Vinyl Add. Tech. 155–159. doi: 10.1002/vnl.20055.
- Lachenmeier, D.W., Przybylski, M.C., Rehm, J., 2012. Comparative risk assessment of carcinogens in alcoholic beverages using the margin of exposure approach. Int. J. Cancer 131, E995–E1003. doi: 10.1002/ijc.27553.
- Liang, Y., Xu, Y., 2014. Improved method for measuring and characterizing phthalate emissions from building materials and its application to exposure assessment. Environ. Sci. Technol. 48(8), 4475–4484. doi: 10.1021/es405809r.
- Liang, Y., Bi, C., Wang, X., Xu, Y., 2019. A general mechanistic model for predicting the fate and transport of phthalates in indoor environments. Indoor Air. 29, 55–69. doi: 10.1111/ina.12514.
- Little, J.C., Weschler, C.J., Nazaroff, W.W., Liu, Z., Cohen, H.E.A., 2012. Rapid methods to estimate potential exposure to semivolatile organic compounds in the indoor environment. Environ. Sci. Technol. 46, 11171–11178. doi: 10.1021/es301088a.
- Luongo, G., Östman, C., 2016. Organophosphate and phthalate esters in settled dust from apartment buildings in Stockholm. Indoor Air. 26(3), 414–425. doi: 10.1111/ina.12217.
- Manikkam, M., Tracey, R., Guerrero-Bosagna, C., Skinner, M.K., 2013. Plastics derived endocrine disruptors (BPA, DEHP and DBP) induce epigenetic transgenerational inheritance of obesity, reproductive disease and sperm epimutations. PLoS One. 8(1), e55387. doi: 10.1371/journal.pone.0055387.
- Matsumoto, M., Hirata-Koizumi, M., Ema, M., 2008. Potential adverse effects of phthalic acid esters on human health: A review of recent studies on reproduction. Regul. Toxicol. Pharmacol. 50(1), 37–49. doi: 10.1016/j.yrtph.2007.09.004.
- Meijer, A., Huijbregts, M.A.J., Reijnders, L., 2005a. Human health damages due to indoor sources of organic compounds and radioactivity in life cycle assessment of dwellings- Part 1: Characterization factors. Int. J. Life Cycle Assess. 10, 309–316. doi: 10.1065/lca2004.12.194.1.
- Meijer, A., Huijbregts, M.A.J., Reijnders, L. 2005b. Human health damages due to indoor sources of organic compounds and radioactivity in life cycle assessment of dwellings-Part 2: Damage sources. Int. J. Life Cycle Assess. 10, 383–392. doi: 10.1065/lca2004.12.194.2.
- Pennington, D., Crettaz, P., Tauxe, A., Rhomberg, L., Brand, K., Jolliet, O. 2002. Assessing human health response in life cycle assessment using ED10s and DALYs: part 2- Noncancer effects. Risk Anal. 22(5), 931–946. doi: 10.1111/1539-6924.00263.
- RIVM, 2018a. DustEx tool. https://www.rivm.nl/en/consexpo/related-tools/dustex-tool (accessed 7 June 2020)
- RIVM, 2018b. The DustEx modelling tool. https://www.rivm.nl/en/consexpo/related-tools/dustex-tool/help (accessed 7 June 2020)
- Rosenbaum, R.K., Bachmann, T.M.K., Gold, L.S., Huijbregts, M.A.J., Jolliet, O., Juraske, R., Koehler, A., Larsen, H.F., MacLeod, M., Margni, M. 2008. USEtox-The UNEP/SETAC-consensus model: recommended characterisation factors for human toxicity and freshwater ecotoxicity in life cycle impact assessment. Int. J. Life Cycle Assess. 13, 532–546. doi: 10.1007/s11367-008-0038-4.
- Rosenbaum, R.K., Meijer, A., Demou, E., Hellweg, S., Jolliet, O., Lam, N.L., Margni, M., McKone, T.E., 2015. Indoor air pollutant exposure for life cycle assessment: Regional health impact factors for households. Environ. Sci. Technol. 49, 12823–12831. doi: 10.1021/acs.est.5b00890.
- Rudel, R., Camann, D., Spengler, J., Korn, L., Brody, J., 2003. Phthalates, alkylphenols, pesticides, polybrominated diphenyl ethers and other endocrine disrupting compounds in indoor air and dust. Environ. Sci. Technol. 37, 4543–4553. doi: 10.1021/es0264596.
- Shi, S., Zhao, B., 2012. Comparison of the predicted concentration of outdoor originated indoor polycyclic aromatic hydrocarbons between a kinetic partition model and a linear instantaneous model for gas–particle partition. Atmos. Environ. 59, 93–101. doi: 10.1016/j.atmosenv.2012.05.007.
- Shi, S., Zhao, B., 2014. Modeled Exposure Assessment via Inhalation and Dermal Pathways to Airborne Semivolatile Organic Compounds (SVOCs) in Residences. Environ. Sci. Technol. 48, 5691–5699. doi: 10.1021/es500235q.
- Shu, H., Jönsson, B.A.G., Gennings, C., Svensson, A., Nånberg, E., Lindh, C.H.et al., 2018. Temporal trends of phthalate exposures during 2007–2010 in Swedish pregnant women. J. Expo. Sci. Environ. Epidemiol. 28, 437–447. doi: 10.1038/s41370-018-0020-6.
- Sparks, L.E., Tichenor, B.A., Guo, J.C.Z., 1996. Gas-phase mass transfer model for predicting volatile organic compound (VOC) emission rates from indoor pollutant sources. Indoor Air. 6, 31–40. doi: 10.1111/j.1600-0668.1996.t01-3-00004.x.
- Wenger, Y., Li, D.S., Jolliet, O., 2012. Indoor intake fraction considering surface sorption of air organic compounds for life cycle assessment. Int. J. Life Cycle Assess. 17, 919–931. doi: 10.1007/s11367-012-0420-0.
- Weschler, J.C., Nazaroff, W., 2008. Semivolatile organic compounds in indoor environments. Atmos. Environ. 42(40), 9018–9040. doi: 10.1016/j.atmosenv.2008.09.052.
- Weschler, J.C., Nazaroff, W., 2010. SVOC partitioning between the gas phase and settled dust indoors. Atmos. Environ. 44(30), 3609–3620. doi: 10.1016/j.atmosenv.2010.06.029.
- Wijnhoven, S., Affourtit, F., 2018. Approaches and tools to better support consumer exposure assessment under REACH. 72–74. https://ec.europa.eu/environment/chemicals/reach/pdf/Full%20Report%20RIVM%20Cons.pdf (accessed 7 June 2020)
- Wu, Y., Eichler, C.M.A., Chen, S., Little, J.C., 2016. Simple method to measure the vapor pressure of phthalates and their alternatives. Environ. Sci. Technol. 50, 10082–10088. doi: 10.1021/acs.est.6b02643.
- Xie, M., Wu, Y., Little, J.C., Marr, L.C., 2016. Phthalates and alternative plasticizers and potential for contact exposure from children’s backpacks and toys. J. Exposure Sci. Environ. Epidemiol. 26(1), 119–124. doi: 10.1038/jes.2015.71.
- Xu. Y., Hubal, E.A.C., Little, J.C., 2010. Predicting residential exposure to phthalate plasticizer emitted from vinyl flooring: Sensitivity, uncertainty, and implications for biomonitoring. Environ. Health Perspectives. 118(2), 253–258. doi: 10.1289/ehp.0900559.