ABSTRACT
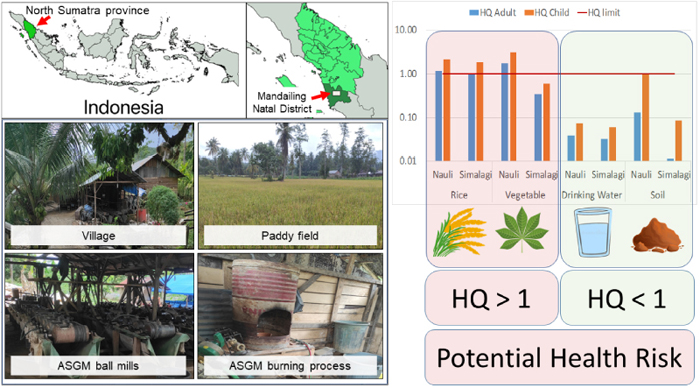
Artisanal small-scale gold mining (ASGM) is the largest single source of mercury (Hg) emissions globally. In this study, Hg contamination was investigated in rice, vegetables, soil, drinking water and groundwater near ASGM sites in Mandailing Natal District, North Sumatra, Indonesia to assess the human health risk of Hg to the residents. The mean Hg concentrations in the rice and vegetables were 50±33 μg/kg dw (n=20) and 2,100±2,500 μg/kg dw (n=12), respectively, and that in the paddy soil and farm soil were 5,600±12,000 μg/kg dw (n=20) and 19,000±33,000 μg/kg dw (n=12), respectively. Hg concentrations in the food, soil and drinking water samples decreased significantly with increasing distance from the amalgam burning facility to the sampling site, suggesting that the burning facility is a major source of Hg in this area. All drinking water samples were below the WHO safe value of Hg, whereas 96% of the vegetable and 82% of rice samples exceeded the safe value from the Indonesian National Standard or the FAO/WHO. The non-cancer risk calculated from the hazard quotients for the rice and vegetables exceeded 1 for children and adults. This paper provides information on Hg contamination in food and the environment in an understudied area, employing health risk assessment to evaluate long-term impacts on human health and offering insights for government decision-making regarding food quality.
INTRODUCTION
Mercury is highly toxic to human health and is one of the top 10 chemicals of major public health concerns (WHO, 2021). Most of the Hg in the environment results from human activity, including coal-fired power plants (UNEP, 2013a). Artisanal and small-scale gold mining (ASGM) is the single largest source (37%) of airborne global anthropogenic Hg emissions (UNEP, 2013b; Gibb and O’Leary, 2014; WHO, 2021). Hg is used in gold mining to extract gold from ore by forming amalgam in ASGM, and estimated Hg emissions from ASGM doubled between 2005 and 2010 (UNEP, 2013a).
Indonesia has more than 1,200 ASGM hotspots (BaliFokus, 2018). The ASGM sector accounts for about 69.7% of the total national Hg released into the environment (about 244 tonnes) in Indonesia (BaliFokus, 2018). Hg concentrations in air, river water, soil and fish around ASGM sites have been investigated in several areas; including Central Kalimantan (Elvince et al., 2008), Gorontalo (Mallongi et al., 2014), North Sulawesi (Limbong et al., 2003), Java (Iqbal and Inoue, 2011) and West Java (Yustiawati et al., 2006; Harianja et al., 2020) in Indonesia. Hg pollution has been investigated in detail in West Java and high Hg concentrations in river water, soil and air near ASGM sites have been reported (Yustiawati et al., 2006; Yasuda et al., 2011; Kono et al., 2012; Kono and Tomiyasu, 2013; Tomiyasu et al., 2013, 2019). The health risks to miners and residents, including children, have also been reported (Castilhos et al., 2006; Bose-O’Reilly et al., 2008, 2010, 2016; Gibb and O’Leary, 2014; Nakazawa et al., 2016). Mandailing Natal, North Sumatra, Indonesia is a region with abundant gold-containing geological resources. Since 2005, gold rock exploration has been conducted in the rugged region of Mount Hutabargot using conventional, primitive technology (Agrawal and Susilorini, 2020). However, more than a decade has passed since ASGM began in Mandailing Natal, yet information on Hg contamination is still scarce.
Several studies have suggested that rice has been identified as a possible source of methylmercury (MeHg) exposure from food (Feng et al., 2008; Novirsa et al., 2019). Globally, Indonesia ranks as the third largest consumer of rice (OECD/FAO, 2021a), and each year, rice consumption amounts to roughly 37.7 million tonnes, most of which is produced domestically (OECD/FAO, 2021b). Indonesia’s per capita rice consumption per year is higher than that of China (76.5 kg/year) and India (69.9 kg/year), at about 126 kg/year (OECD/FAO, 2021b). In addition, Addai-Arhin et al. suggested that vegetables, such as cassava, cultivated around ASGM sites are potential source of Hg (Addai-Arhin et al., 2022), but little is known about Hg concentration in vegetables in Indonesia. Thus, investigating Hg concentration in rice and vegetables is necessary to evaluate the health risk to residents around ASGM sites.
In the present study, the Hg contamination in rice, vegetables, soil and water was investigated near two gold mining areas in Mandailing Natal, North Sumatra; the Hg intake of local residents was estimated and potential health risks associated with Hg exposure were discussed.
MATERIALS AND METHODS
STUDY AREA AND SAMPLING SITES
The study area is in Mandailing Natal District, North Sumatra Province, Indonesia (Fig. 1). Nauli and Simalagi villages, which are affected by Hg pollution from gold mining and processing activities, were selected. ASGM has been active in this location since 2005 and is becoming one of the most promising sources of income in addition to farming for most local people. The total populations of Nauli and Simalagi villages were 1,599 and 460, respectively (BPS, 2021).
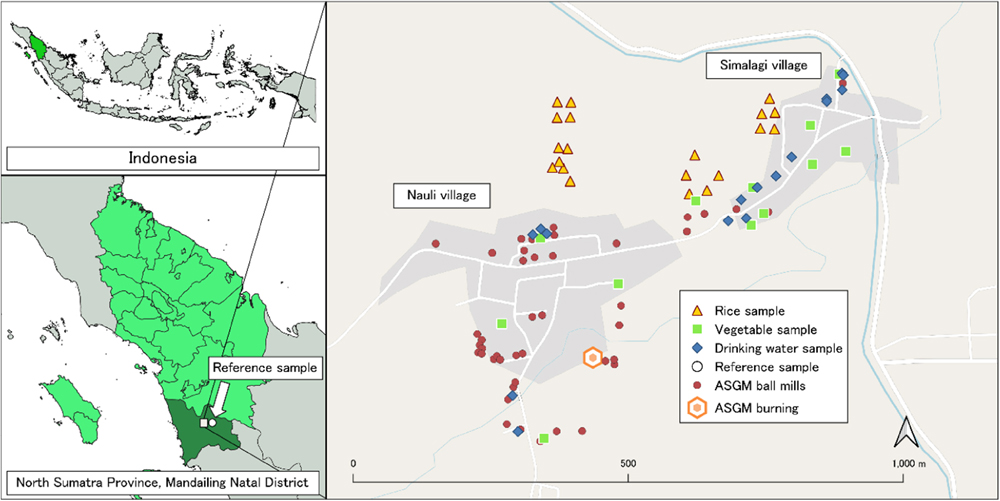
Agricultural soil (n=32), rice (n=20), vegetables namely cassava (Manihot esculenta) leaves, katuk sweet (Sauropus androgynus) leaves, papaya (Carica papaya) flower, bilimbi (Averrhoa bilimbi) fruit, water spinach (Ipomoea aquatica) and susumber (Solanum torvum) (n=12), drinking water (n=16) and groundwater (n=16) were collected in late October 2021 in the rainy season from the villages (Fig. 1). Soil samples were collected from the same site as the rice and vegetable samples. The communities consume drinking water from groundwater, so we collected samples of drinking water and groundwater from the same source. We also collected reference samples of rice (n=3), vegetables consisting of green onion (Allium cepa), cabbage (Brassica oleracea) and baby spinach (Spinacia oleracea) (n=3), drinking water (n=3) and groundwater (n=3) from non-contaminated areas with no industry and mining activities 10 km from the sampling area to compare with the results from the study area and we assumed that the Hg level is negligible.
SAMPLE PREPARATION AND PRE-TREATMENT
Rice and vegetable samples (about 200 g) were packed in zipped plastic bags, washed with distilled water and oven dried at 40°C (DX601, Yamato Scientific co., ltd., Tokyo, Japan) until their weight was stable. Soil samples (about 500 g) were taken from the surface to a depth of 10 cm with a plastic scoop and then placed in zipped plastic bags. Roots, rocks, wood and extraneous matter were removed and the samples were oven dried at 40°C until the weight was stable. The dried rice samples were hulled to separate the husks and grains before the grains were ground with a porcelain mortar and pestle and sifted through a 150 μm sieve. The samples were homogenised. The water samples (around 100 mL) were placed in polyethylene bottles. Clean handling of all samples was performed to prevent cross-contamination. All the samples were stored at 4°C and kept in light-dark conditions until the analysis.
ANALYTICAL METHODS
Total mercury concentration in every sample was determined with a mercury analyser (MA-3000, Nippon Instrument Corporation, Tokyo, Japan). Hg concentration in rice, vegetables and soil was determined by thermal decomposition using method number 7,473 published by the U.S. Environmental Protection Agency (USEPA). Hg in samples was analysed without chemical pre-treatment. Three sample boats were used to weigh three aliquots (50 mg) from each sample to obtain triplicate data.
Hg concentration in water was determined by reduction vaporisation using method number 245.1 published by the USEPA. The unfiltered water samples (100 mL) were poured into Teflon bottles and 0.5 N sulfuric acid (5 mL) and nitric acid (2.5 mL) were added. Then, 5% potassium permanganate (15 mL) was added, and the mixture was left for 10 min to ensure that it remained purple, before 5% potassium persulfate (8 mL) was added. The samples were heated in a water bath at 95°C for a period of 2 hours with the bottle lids tightened so that the samples would not leak. After cooling the samples to a room temperature, a solution of sodium chloride and hydroxylammonium chloride (6 mL) was applied to eliminate excess permanganate, and then 10% tin (II) chloride (0.3 mL) was added to the samples for immediate analysis. The analysis was conducted using a total of 5 mL of the treated water sample for each measurement. All of the chemical reagents, with the exception of tin (II) chloride, were of analytical grade and procured from FUJIFILM Wako Pure Chemical Corporation (Osaka, Japan). Tin (II) chloride was purchased from Kanto Chemical co., Inc. (Tokyo, Japan).
QUALITY ASSURANCE AND QUALITY CONTROL
Each instrumental analysis was performed on three replicates, and a blank analysis was performed for every three samples. Three certified reference materials (CRM) were used to determine the accuracy of the results for rice, vegetables and soil. The CRMs used were 7302-a from the National Metrology Institute of Japan for trace elements in marine sediment, European Reference Material ERM-CC580 for estuarine sediment and 7402-a for trace elements in cod fish tissue with the value obtained was 0.51±0.02 mg/kg, 132.4±6.06 mg/kg and 0.61±0.01 mg/kg respectively (n=3, recovery rates of 94%–102%, 96%–105% and 99%–101% respectively). The recovery analysis for Hg in water involved the addition of a known amount of Hg to both blank and sample water to evaluate the accuracy of the analysis. The coefficient of variation was 3.3%.
RISK ASSESSMENT METHODOLOGY
To conduct this research, several assumptions were made. It was assumed that body weight refers to the guidelines for environmental health risk analysis by the Indonesian Ministry of Health of 55 kg for adults and 15 kg for children. Adults are defined as being older than 19 years, and children as being 6 to 12 years old. We also assumed that local people consume food and drink from the area where they live. Data on the consumption of vegetables, rice and drinking water were taken from a similar study in Indonesia, namely the risk assessment of the population in Bogor (Rahman et al., 2019), and the parameters are listed in Table 1.
Table 1 Parameters used to estimate average daily intake (ADI)
| Parameters | Unit | Adult | Child | Reference |
|---|
| Hg concentration, C | μg/kg dw; μg/L | — | — | This study |
| Ingestion rate of rice, IRrice | kg ww/day | 0.4 | 0.2 | (Rahman et al., 2019) |
| Ingestion rate of vegetables, IRveg | kg ww/day | 0.029 | 0.014 | (Rahman et al., 2019) |
| Ingestion rate of water, IRdw | L/day | 1 | 0.5 | (Rahman et al., 2019) |
| Ingestion rate of soil, IRsoil | mg/day | 100 | 200 | (US EPA, 2011) |
| Rice dw to ww conversion factor, WCF | kg ww/kg dw | 0.91 | 0.91 | (Staven et al., 2003) |
| Vegetable dw to ww conversion factor, WCF | kg ww/kg dw | 0.23 | 0.23 | (Staven et al., 2003) |
| Exposure frequency, EF | day/year | 350 | 350 | (Minister of Health, Indonesia, 2012; US EPA, 2011) |
| Exposure duration, ED | Years | 30 | 6 | (Minister of Health, Indonesia, 2012; US EPA, 2011) |
| Body weight, BW | kg | 55 | 15 | (Minister of Health, Indonesia, 2012) |
| Averaging time, AT | days | 10,950 | 2,190 | (Minister of Health, Indonesia, 2012; US EPA, 2011) |
| Skin surface, SA | cm2 | 5,700 | 2,800 | (US EPA, 2011) |
| Skin adherence factor, AF | mg/cm2/day | 0.07 | 0.2 | (US EPA, 2011) |
| Dermal absorption factor, ABS | — | 0.1 | 0.1 | (DEA, Republic of South Africa, 2010) |
| Conversion factor, CF | kg/mg | 10−6 | 10−6 | (US EPA, 2011) |
| Inhalation rate, IRinh | m3/day | 20 | 12 | (Minister of Health, Indonesia, 2012) |
| Particulate emission factor, PEF | m3/kg | 1.36×10⁹ | 1.36×10⁹ | (US EPA, 2011) |
| Oral reference dose, RfDOral | μg/kg/day | 0.3 | 0.3 | (DEA, Republic of South Africa, 2010; US EPA, 2011) |
| Dermal reference dose, RfDDermal | μg/kg/day | 0.3 | 0.3 | (DEA, Republic of South Africa, 2010; US EPA, 2011) |
| Inhalation reference dose, RfDInhalation | μg/kg/day | 0.0857 | 0.0857 | (DEA, Republic of South Africa, 2010; US EPA, 2011) |
Hg can enter the human body by the following pathways: oral ingestion of food (e.g. fish, meat, rice, vegetables and other agricultural products), drinking water and soil particles; skin contact with water and soil particles; and inhalation of soil particles, gaseous elemental Hg and particulate Hg. This study did not measure airborne Hg; thus, it was not included.
To estimate the potential Hg exposure of the local population through consumption from several exposure sources, the following calculation was used. Average daily intake (ADI) by oral ingestion, dermal and inhalation exposure was estimated using equations 1, 2, 3 provided by the US EPA (US EPA, 1989, 2011; Yeganeh et al., 2013). The estimation of ADI-Inhalation in this study is solely based on the Hg content in the soil and does not incorporate measurements of atmospheric Hg levels.
|
ADI-Ingestion=
C×IR×EF×ED
BW×AT
×WCF
| (1) |
|
ADI-Dermal=
C×SA×AF×ABS×EF×ED
BW×AT
×CF
| (2) |
|
ADI-Inhalation=
C×IR-inh×EF×ED
BW×AT×PEF
| (3) |
Here, ADI is the average daily intake exposure dose via the subscript pathway; C is the pollutant concentration in environmental media (μg/kg or μg/L); IR is the daily intake rate (kg/d); EF is exposure frequency (day/year); ED is exposure duration (years); BW is body weight (kg); AT is the exposure time (ED×365) (days); SA is body surface area (cm2); AF is skin adherence factor (mg/cm2/day); ABS is dermal absorption factor (unitless); CF is conversion factor (kg/mg); and PEF is the particle emission factor (m3/kg). Detailed information on these parameters is listed in Table 1.
Assessments for non-cancer risks were estimated by dividing the estimated daily intake by the reference dose (RfD), following USEPA guidelines.
where HQ is the hazard quotient (HQ). An HQ value of less than 1 indicates that there is no potential risk of adverse health effects from exposure to Hg over a lifetime. However, if the frequency and severity of exposure exceed the RfD, the probability of side effects also increases.
STATISTICAL ANALYSIS
Statistical analysis was performed using SPSS 26.0 software (IBM Corp., Armonk, NY, USA) and R version 3.6.3 (R Core Team, 2022, Vienna, Austria). The difference of log Hg concentrations between two groups was tested with Student’s t-test. The significance of the correlation coefficients (r) was confirmed by the test for non-correlation between two variables. The difference of slopes between two regressions was tested by an analysis of covariance (ANCOVA). Differences were declared as significant when p<0.05. The bootstrap method was used to assess the uncertainty of the sample estimates (Kulesa et al., 2015). The non-parametric bootstrap method was applied to the log Hg concentration in each medium. The bootstrap was repeated 10,000 times.
RESULTS AND DISCUSSION
Hg CONCENTRATION IN RICE AND VEGETABLE SAMPLES
The Hg concentrations in the samples are shown in Table 2. The Hg concentrations in the rice samples ranged from 26 to 180 μg/kg dw with an average standard deviation (SD) of 50±33 μg/kg dw (n=20). These Hg concentrations were much higher than those in the rice samples collected from the reference sites in Indonesia (8.3±2.0 μg/kg dw, n=3) and in the rice samples bought in markets around the world (1.1–5.3 μg/kg dw) (Wang et al., 2020). However, the Hg concentration in this study area was lower than that in the rice samples collected from other gold mining areas in Cisitu, Gorontalo, Lebaksitu and Sukabumi, Indonesia (mean 90–560 μg/kg dw) (Mallongi et al., 2014; Bose-O’Reilly et al., 2016; Novirsa et al., 2019; Saragih et al., 2021) and Camarines Norte, Philippines (600 μg/kg dw) (Murao et al., 2019). Variations in the Hg concentrations among the study areas may result from the scale and years of operation of each ASGM, and the distance from the hotspot (Novirsa et al., 2019).
Table 2 Hg concentrations in rice, vegetable, soil and water samples
| All study area | Nauli Village | Simalagi Village |
|---|
| Mean±SD | n | Mean±SD | n | Mean±SD | n |
|---|
| Rice, Oryza sativa (μg/kg dw) | 50±33 | 20 | 54±43 | 10 | 47±18 | 10 |
| Paddy soil (μg/kg dw) | 5,600±12,000 | 20 | 9,000±16,000 | 10 | 2,200±1,800 | 10 |
| Vegetables (μg/kg dw) | 2,100±2,500 | 12 | 4,500±2,800 | 4 | 870±920 | 8 |
| Cassava (Manihot esculenta) leaves | 2,000±1,600 | 6 | 3,000±1,100 | 3 | 880±740 | 3 |
| Katuk sweet (Sauropus androgynus) leaves | 4,800 | 2 | 9,000 | 1 | 590 | 1 |
| Papaya (Carica papaya) flower | 2,800 | 1 | — | — | 2,800 | 1 |
| Bilimbi (Averrhoa bilimbi) fruit | 220 | 1 | — | — | 220 | 1 |
| Water spinach (Ipomoea aquatica) | 550 | 1 | — | — | 550 | 1 |
| Susumber (Solanum torvum) | 100 | 1 | — | — | 100 | 1 |
| Farm soil (μg/kg dw) | 19,000±33,000 | 12 | 55,000±35,000 | 4 | 1,400±1,200 | 8 |
| Drinking water (μg/L) | 0.59±0.09 | 16 | 0.67±0.06 | 5 | 0.55±0.08 | 11 |
| Groundwater (μg/L) | 0.62±0.18 | 16 | 0.71±0.27 | 5 | 0.58±0.09 | 11 |
| Reference sites | | | | | | |
| Rice, Oryza sativa (μg/kg dw) | 8.3±2.0 | 3 | | | | |
| Vegetables (μg/kg dw) | 82±23 | 3 | | | | |
| Drinking water (μg/L) | 0.040±0.0058 | 3 | | | | |
| Groundwater (μg/L) | 0.060±0.0058 | 3 | | | | |
The Hg concentrations in the vegetable samples ranged from 100 to 9,000 μg/kg dw with an average SD of 2,100±2,500 μg/kg dw (n=12). The average Hg concentration in the study area was about 25 times higher than that in the vegetable samples collected from the reference sites in Indonesia (82±23 μg/kg dw for green onion, cabbage and baby spinach, n=3). In contrast, the Hg concentrations in vegetables in this study area were equivalent to those in vegetables, such as cassava leaf, papaya leaf and neem leaves collected in gold mining areas in Sukabumi and Bombana, Indonesia (1,780–9,900 μg/kg dw) (Basri et al., 2020; Saragih et al., 2021) and were higher in concentration than that in the cassava’s edible part (115–3,331 μg/kg dw) and peel (370–991 μg/kg dw) collected near an ASGM site in Ghana (Addai-Arhin et al., 2022).
The Hg concentration in the vegetables was highest in katuk sweet leaf (mean 4,800 μg/kg dw, n=2), followed by Carica papaya flower (2,800 μg/kg dw, n=1) and cassava leaves (mean 2,000 μg/kg dw, n=6). The mean Hg concentration in the vegetables was about 40 times higher than that in the rice. The difference in Hg concentration between the vegetables and rice samples can be attributed to the variation in plant parts analysed. While no parts were removed from the vegetable samples, the husks were excluded from the rice samples. Removing the husks could result in a lower Hg concentration since the grains generally have lower Hg levels compared to the roots and husks (Enamorado-Montes et al., 2021).
Hg CONCENTRATION IN SOIL SAMPLES
The Hg concentrations in the paddy soil ranged from 260 to 58,000 μg/kg dw with an average SD of 5,600±12,000 μg/kg dw (n=20) (Table 2). In contrast, the Hg concentrations in the farm soil ranged from 180 to 100,000 μg/kg dw with an average SD of 19,000±33,000 μg/kg dw (n=12). The mean Hg concentration in the farm soil was about 3.4 times higher than that in the paddy soil due to shorter distances to the burning sites, for Hg farm soil (average length of 390 metres) and paddy soil (average length of 430 metres), emphasising the importance of spatial factors in Hg contamination. The Hg concentrations in the paddy field soil were similar to those found in previous studies. For example, research conducted in ASGM areas of Buladu, Gorontalo, Indonesia, showed that the Hg concentrations in the paddy field soil ranged from 484 to 4,244 μg/kg (Mallongi et al., 2014). Several studies (Krisnayanti et al., 2012; Tomiyasu et al., 2013) have reported significantly elevated levels of Hg in ASGM areas in Indonesia, with the highest concentrations observed in samples collected near mining operations.
Hg CONCENTRATION IN WATER SAMPLES
The Hg concentrations in the drinking water ranged from 0.45 to 0.75 μg/L with an average SD of 0.59±0.090 μg/L (n=16) (Table 2). The average concentration of Hg in drinking water analysed in this study was comparable to that collected from a gold mining area in Pakistan (0.91 μg/L) (Riaz et al., 2019) and other areas (sampling site unknown) in Iran (0.31 μg/L) (Yeganeh et al., 2013) and Nepal (0.5 μg/L) (Sarkar et al., 2022). These Hg concentrations around gold mining areas have higher order of magnitude than that collected from the reference site in Indonesia (0.050±0.0082 μg/L).
The Hg concentrations in the groundwater ranged from 0.45 to 1.3 μg/L with an average SD of 0.62±0.18 μg/L (n=16). No difference in Hg concentration between the groundwater and the drinking water was observed (p=0.59).
RELATIONSHIP OF Hg CONCENTRATION BETWEEN FOOD AND SOIL SAMPLES
The relationship of log Hg concentration between the food (rice and vegetables) and soil samples is shown in Fig. 2. The log Hg concentration in the food was significantly correlated with that in the soil (p<0.05), indicating that the Hg concentration in the food reflected that in the soil. Furthermore, the slope in the regression equation between the vegetables and the farm soil differed significantly from the slope between the rice and the paddy soil (ANCOVA, p<0.05) (Fig. 2). The larger slope for the vegetables suggests that the vegetables may absorb more Hg than the grain rice from the soil and that they may have received some of the load from atmospheric deposition.
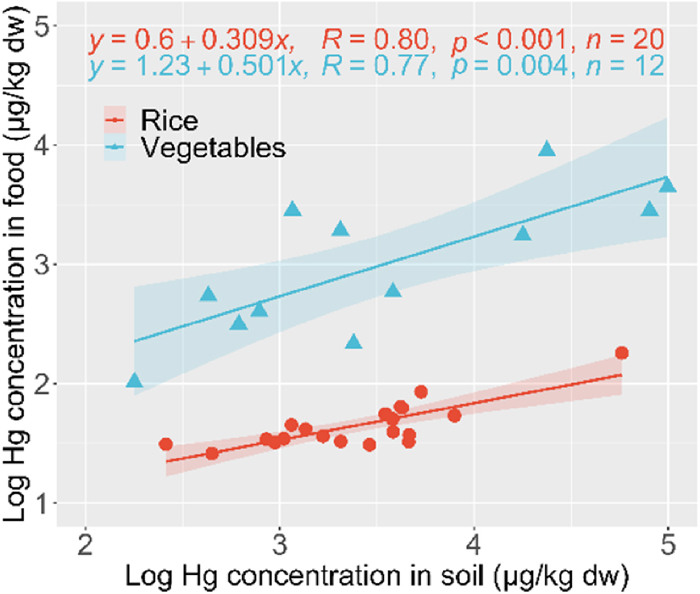
The wider 95% confidence interval in the regression equation for the vegetables than for the rice may be explained by the variation of the Hg concentration in the vegetables. The mean ratio of the Hg concentration between the rice and soil was about 0.0090, but that for the vegetables varied from 0.06 (cassava leaves, n=6) to 2.4 (Carica papaya flower, n=1) depending on species (Fig. S2). This variation may be caused by differences in the part analysed (leaf, flower and fruit), species-specific physiological factors, such as the absorption mechanism, and the cultivation environment, such as the distance from the burning site. The ability of plants to accumulate Hg in their tissues differs between species. Hg can be accumulated by plant roots through the process of transpiration or dry deposition, which occurs through foliar absorption mediated by stomata (Rea et al., 2001). For the rice samples, the soil Hg pool was confirmed to be the primary source of inorganic Hg in the roots and a unique bioaccumulation pathway of MeHg for rice plant tissues was identified (Meng et al., 2010, 2011, 2014).
SPATIAL DISTRIBUTION OF Hg CONCENTRATION IN THE STUDY AREA
The Hg concentrations in the soil, vegetable and drinking water samples collected in Nauli village were statistically higher than those in Simalagi village (Table 2 and Fig. 3). The higher Hg concentration in Nauli village probably resulted from the facilities and activities relating to ASGM (Fig. 1). Nauli village has the burning facility, many ball mills and more frequent activities than Simalagi village.

The relationship between the Hg concentration and the distance from the burning facility to the sampling site was examined (Fig. 4). The log Hg concentrations in samples other than groundwater decreased significantly with increasing distance from the burning facility to the sampling site (p<0.05). This results suggested that the Hg concentrations in the samples were mainly explained by the distance from the burning facility to the sampling site. The slopes and intercepts in the regression equations were similar between the farm and paddy soil samples (Fig. 4 (a)). Furthermore, although the mean Hg concentration differed between the farm and paddy soil samples, the farm soil corresponded well with that in the paddy soil at 300 to 600 m from the burning facility. The Hg concentration in the soil around the burning facility was estimated to be on the order of about 105 μg/kg dw from the intercept of the regression equation in Fig. 4 (a).
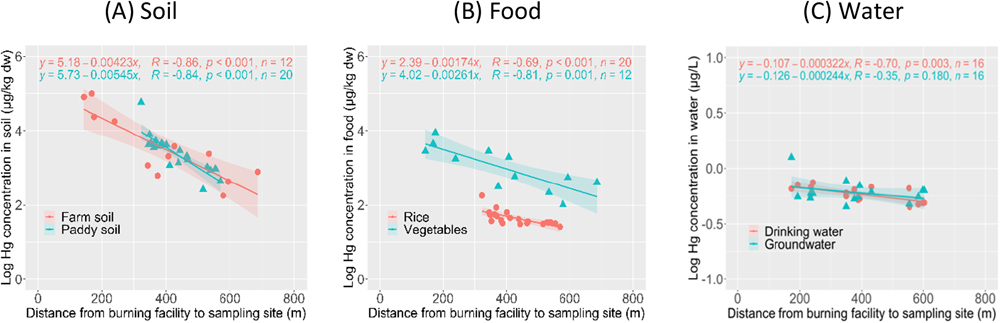
The Hg concentration on the rice and vegetables also decreased with increasing distance from the burning facility to the sampling site (Fig. 4 (b)). These food samples were affected by the Hg concentrations in the soil and the potential for atmospheric deposition of Hg, as described in the section on the relationship of Hg concentration between food and soil samples. The Hg concentration in the drinking water decreased significantly with increasing distance from the burning facility to the sampling site, but that in the groundwater did not (Fig. 4 (c)).
EVALUATION OF Hg CONTAMINATION IN THE STUDY AREA
To obtain a more precise assessment, the non-parametric bootstrap method was applied to the log Hg concentration in the food, soil and water samples (Fig. S1 and Table S1). The proportion of samples exceeding the safe value proposed by Indonesia Food and Drugs Administration (30 μg/kg) (BPOM, 2017) was estimated to be 82% for rice. The proportion exceeding the standard value given by the FAO/WHO (100 μg/kg) (WHO, 2006) was estimated to be 96% for vegetables. The Indonesian Ministry of Environment and Forestry has set a permissible tolerable value of 300 μg/kg for agricultural soil (Minister of Environment and Forestry, Indonesia, 2021) while the Council of the European Communities standard for agriculture soil is 1,000 μg/kg (Council of the European Communities, 1986). The proportions of paddy soil and farm soil samples exceeding the Indonesian values were estimated to be 97% and 89%, respectively. Thus, almost all the food and soil samples in this area exceeded the safe value or the permissible tolerable value and these results indicate that severe Hg contamination is occurring in the target area. The Indonesian standard is 1 μg/L for drinking water (Minister of Health, Indonesia, 2017), and the proportions exceeding this value in the drinking water and the groundwater were estimated to be 0.03% and 1.4%, respectively. Thus, the proportions of water samples exceeding the standard value were smaller than those of the food and soil samples.
RESIDENT HEALTH RISK ASSESSMENT
The ADIs and HQs of food, drinking water, soil and groundwater samples are shown in Table 3. The ADIs of the residents from rice for children and adults in all the study areas were far higher than the USEPA recommended guideline values. However, vegetable samples in Simalagi village were indeed lower than the USEPA recommended guideline values. For oral exposure, the consumption limit is 0.3 μg/kg/day for adult and children (DEA, Republic of South Africa, 2010; US EPA, 2011). The HQ of rice and vegetables was the highest of the consumption sources in Nauli village. The HQ of rice was 2.1 and 1.1 in Nauli village and 1.8 and 1.0 in Simalagi village for children and adults, respectively. The HQ of the vegetables from Nauli village exceeded the safe value but was below the safe value in Simalagi village for both adults and children. The high HQ for rice may be caused by the high daily consumption of rice in the community because it is the staple food. Likewise, the HQ for vegetables from Nauli village was high because of the high Hg concentration in these plants. However, the ADI of drinking water and soil was far below the safe limit and the HQ value was below 1 for all study areas for children and adults. The soil ingestion pathway exposure has a value that is near the threshold for having an impact on human health, especially Nauli village.
Table 3 Average daily intake (ADI) and hazard quotient (HQ) of Hg for the resident
| Sample | Nauli village | Simalagi village |
|---|
| ADI (μg/kg/day) | HQ | ADI (μg/kg/day) | HQ |
|---|
| Adult | Child | Adult | Child | Adult | Child | Adult | Child |
|---|
| Oral (RfD=0.3 μg/kg/day) |
| Rice | 0.34 | 0.63 | 1.1 | 2.1 | 0.30 | 0.54 | 1.0 | 1.8 |
| Vegetables | 0.52 | 0.93 | 1.7 | 3.1 | 0.10 | 0.18 | 0.3 | 0.6 |
| Drinking water | 0.01 | 0.02 | 0.04 | 0.07 | 0.01 | 0.02 | 0.03 | 0.06 |
| Soil | 0.04 | 0.28 | 0.13 | 0.95 | 0.00 | 0.02 | 0.01 | 0.08 |
| Dermal (RfD=0.3 μg/kg/day) |
| Groundwater | 4.9×10⁻⁷ | 2.5×10⁻⁶ | 1.6×10⁻⁶ | 8.5×10⁻⁶ | 4.5×10⁻⁷ | 2.3×10⁻⁶ | 1.5×10⁻⁶ | 7.7×10⁻⁶ |
| Soil | 1.6×10⁻² | 8.0×10⁻² | 5.2×10⁻² | 2.7×10⁻¹ | 1.4×10⁻³ | 7.0×10⁻³ | 4.5×10⁻³ | 2.3×10⁻² |
| Inhalation (RfD=0.086 μg/kg/day) |
| Soil | 5.7×10⁻⁶ | 1.3×10⁻⁵ | 6.7×10⁻⁵ | 1.5×10⁻⁴ | 5.0×10⁻⁷ | 1.1×10⁻⁶ | 5.9×10⁻⁶ | 1.3×10⁻⁵ |
Even though the ADI of dermal and Inhalation exposure was very low, it has had an impact on society. According to USEPA, the absorption limit for dermal exposure is 0.3 μg/kg/day for adults and children, and the absorption limit for inhalation exposure is 0.086 μg/kg/day for adults and children (DEA, Republic of South Africa, 2010; US EPA, 2011). The relatively low ADI and HQ values arise from the low potential for entry into the body owing to various factors, such as dermal absorption and particulate emission. Several similar studies have also shown a low HQ value for oral ingestion, inhalation and dermal exposure from soil in both children and adults. Sources of exposure vary between ASGM and agriculture (Table S2).
The health risk assessment of Hg via oral ingestion exposure showed that rice and vegetables have an HQ value above 1, which means that rice and vegetables have the potential to affect health in children and adults. A similar study by Novirsa et al. (2020) in Indonesia shows that rice consumption and oral exposure have a high HQ value and can affect health (Novirsa et al., 2020). The average ADI of people living in the mining area in this study was 0.116 μg/kg/day (range 0.040–0.240 μg/kg/day). Natasha et al. (2020) calculated the possible health risks associated with the consumption of Hg-contaminated food both in adults and children (Natasha et al., 2020). The study concluded that the accumulation of Hg in edible plant parts can pose health hazards to both adults and children. As a result, it emphasised the need for effective measures to control the transfer of Hg from soil to plants and ultimately to humans in order to minimise health risks.
CONCLUSIONS
Mercury contamination in the gold mining area, Mandailing Natal District, Indonesia, was investigated. The study found high concentrations of Hg in the food, soil and water samples from the study area, despite the gold mining activity only being conducted for about 15 years. The Hg concentrations in the samples collected in Nauli village were statistically higher than those in Simalagi village, and the horizontal distribution of Hg concentrations in the study area was strongly related to the distance from the burning facility. This result suggested that a distance of more than 500 m from the burning site is needed to reduce Hg exposure. According to the safe value from the Indonesian National Standard or the permissible tolerable value from the FAO/WHO, the level of Hg contamination in vegetables and rice was above these values, making them unfit for human consumption. With a HQ greater than 1, this study indicates a possible health risk for people who mostly consume locally grown vegetables and grains. Hg contamination in vegetables and rice cultivated in the regions of this study will certainly rise over time due to the Hg deposition to the soil by gold mining activities. Further monitoring of and countermeasures against Hg contamination are required to reduce the health risks for residents.
ACKNOWLEDGEMENTS
The authors would like to acknowledge the support and commitment of the Kumamoto Prefectural Government and the Prefectural University of Kumamoto in Japan towards this study. We are also grateful to Mr. Adri Hasanuddin, Mrs. Nikmah Khairani Batubara and Mrs. Suaibah for their assistance during the sample collection process. In addition, the authors appreciate the cooperation of the residents in the surroundings of the ASGM region where samples were gathered.
SUPPLEMENTARY MATERIAL
Fig. S1, Distribution of the Hg concentration after the bootstrap method; Fig. S2, Hg concentration ratio between the rice or vegetable samples and soil samples; Table S1, Proportions of food, soil, and water samples exceeding the standard Hg values; Table S2, Study comparison of hazard quotient (HQ) from soil exposure.
This material is available on the Website at https://doi.org/10.5985/emcr.20230003.
FUNDING
This study was financially supported by the Kumamoto Prefectural Government and the Prefectural University of Kumamoto, Japan, through the International Postgraduate Scholarship for Mercury Research.
COMPETING INTEREST
The authors declare no competing interests.
ETHICS APPROVAL
Not applicable.
CONSENT TO PARTICIPATE
Not applicable.
DATA AVAILABILITY
Not applicable.
REFERENCES
- Addai-Arhin, S., Novirsa, R., Jeong, H.H., Phan, Q.D., Hirota, N., Ishibashi, Y., Shiratsuchi, H., Arizono, K., 2022. Potential human health risks of mercury-contaminated cassavas—Preliminary studies. Fundam. Toxicol. Sci. 9(2), 61–69. doi: 10.2131/fts.9.61.
- Agrawal, S., Susilorini, B., 2020. National Overview of the Indonesian ASGM Sector. https://rc-sea.org/wp-content/uploads/2021/12/National-Overview-of-ASGM-in-Indonesia-FINAL-31-Oct-2020.pdf (accessed 24 May 2023)
- BaliFokus, 2018. Mercury Country Situation Report—Indonesia. IPEN, Bali. https://ipen.org/documents/mercury-country-situation-report-indonesia (accessed 24 May 2023)
- Basri, Sakakibara, M., Sera. K., 2020. Mercury in soil and forage plants from artisanal and small-scale gold mining in the Bombana area, Indonesia. Toxics 8(1), 15. doi: 10.3390/toxics8010015.
- Bose-O’Reilly, S., Drasch, G., Beinhoff, C., Rodrigues-Filho, S., Roider, G., Lettmeier, B., Maydl, A., Maydl, S., Siebert, U., 2010. Health assessment of artisanal gold miners in Indonesia. Sci. Total Environ. 408(4), 713–725. doi: 10.1016/j.scitotenv.2009.10.070.
- Bose-O’Reilly, S., Lettmeier, B., Gothe, R.M., Beinhoff, C., Siebert, U., Drasch, G., 2008. Mercury as a serious health hazard for children in gold mining areas. Environ. Res. 107(1), 89–97. doi: 10.1016/j.envres.2008.01.009.
- Bose-O’Reilly, S., Schierl, R., Nowak, D., Siebert, U., William, J.F., Owi, F.T., Ir, Y.I., 2016. A preliminary study on health effects in villagers exposed to mercury in a small-scale artisanal gold mining area in Indonesia. Environ. Res. 149, 274–281. doi: 10.1016/j.envres.2016.04.007.
- BPOM, 2017. Maximum Limit of Heavy Metal Contamination in Processed Food. National Agency of Drug and Food Control of Indonesia, Jakarta. https://peraturan.infoasn.id/peraturan-kepala-badan-pengawas-obat-dan-makanan-nomor-23-tahun-2017/ (accessed 30 November 2022)
- BPS, 2021. Huta Bargot Sub-district in Figures 2021. Central Bureau of Statistics of Indonesia, Mandailing Natal. https://mandailingnatalkab.bps.go.id/publication/2021/09/24/a98d9e0e94a9c73e3543da54/kecamatan-huta-bargot-dalam-angka-2021.html (accessed 22 October 2022)
- Castilhos, Z.C., Rodrigues-Filho, S., Rodrigues, A.P.C., Villas-Bôas, R.C., Siegel, S., Veiga, M.M., Beinhoff, C., 2006. Mercury contamination in fish from gold mining areas in Indonesia and human health risk assessment. Sci. Total Environ. 368(1), 320–325. doi: 10.1016/j.scitotenv.2006.01.039.
- Council of the European Communities, 1986. The protection of the environment, and in particular of the soil, when sewage sludge is used in agriculture. Council Directive of 12 June 1986. https://www.legislation.gov.uk/eudr/1986/278/2018-07-04/data.pdf (accessed 30 November 2022)
- DEA, Republic of South Africa, 2010. Framework for the management of contaminated land. Department Environmental Affairs, Republic of South Africa, Pretoria. http://sawic.environment.gov.za/documents/518.pdf (accessed 2 November 2022)
- Elvince, R., Inoue, T., Tsushima, K., Takayanagi, R., Ardianor, Darung, U., Gumiri, S., Dohong, S., Nagafuchi, O., Kawakami, T., Yamada, T., 2008. Assessment of Mercury Contamination in the Kahayan River, Central Kalimantan, Indonesia. J. Water Environ. Technol. 6(2), 103–112. doi: 10.2965/jwet.2008.103.
- Enamorado-Montes, G., Reino-Causil, B., Urango-Cardenas, I., Marrugo-Madrid, S., Marrugo-Negrete, J., 2021. Mercury Accumulation in Commercial Varieties of Oryza sativa L. Cultivated in Soils of La Mojana Region, Colombia. Toxics 9(11), 304. doi: 10.3390/toxics9110304.
- Feng, X., Li, P., Qiu, G., Wang, S., Li, G., Shang, L., Meng, B., Jiang, H., Bai, W., Li, Z., Fu, X., 2008. Human exposure to methylmercury through rice intake in mercury mining areas, Guizhou province, China. Environ. Sci. Technol. 42(1), 326–332. doi: 10.1021/es071948x.
- Gibb, H., O’Leary, K.G., 2014. Mercury exposure and health impacts among individuals in the artisanal and small-scale gold mining community: A comprehensive review. Environ. Health Perspect. 122(7), 667–672. doi: 10.1289/EHP.1307864.
- Harianja, A.H., Saragih, G.S., Fauzi, R., Hidayat, M.Y., Syofyan, Y., Tapriziah, E.R., Kartiningsih, S.E., 2020. Mercury Exposure in Artisanal and Small-Scale Gold Mining Communities in Sukabumi, Indonesia. J. Health Pollut. 10(28), 1–11. doi: 10.5696/2156-9614-10.28.201209.
- Iqbal, R., Inoue, T., 2011. Mercury Pollution in Java Island: Past and Present. J. Ecotechnol. Res. 16(2), 51–57. doi: 10.11190/jer.16.51.
- Kono, Y., Rahajoe, J.S., Hidayati, N., Kodamatani, H., Tomiyasu, T., 2012. Using native epiphytic ferns to estimate the atmospheric mercury levels in a small-scale gold mining area of West Java, Indonesia. Chemosphere 89(3), 241–248. doi: 10.1016/j.chemosphere.2012.04.027.
- Kono, Y., Tomiyasu, T., 2013. Quantitative Evaluation of Real-time Measurements of Atmospheric Mercury in a Mercury-contaminated Area. J. Environ. Saf. 4(2), 2_153–2_157. doi: 10.11162/daikankyo.ES12P1201.
- Krisnayanti, B.D., Anderson, C.W.N., Utomo, W.H., Feng, X., Handayanto, E., Mudarisna, N., Ikram, H., Khususiah, 2012. Assessment of environmental mercury discharge at a four-year-old artisanal gold mining area on Lombok Island, Indonesia. J. Environ. Monit. 14(10), 2598–2607. doi: 10.1039/c2em30515a.
- Kulesa, A., Krzywinski, M., Blainey, P., Altman, N., 2015. Sampling distributions and the bootstrap. Nat. Methods 12, 477–478. doi: 10.1038/nmeth.3414.
- Limbong, D., Kumampung, J., Rimper, J., Arai, T., Miyazaki, N., 2003. Emissions and environmental implications of mercury from artisanal gold mining in north Sulawesi, Indonesia. Sci. Total Environ. 302(1–3), 227–236. doi: 10.1016/S0048-9697(02)00397-2.
- Mallongi, A., Pataranawat, P., Parkpian, P., 2014. Mercury emission from artisanal buladu gold mine and its bioaccumulation in rice grains, Gorontalo Province, Indonesia. Adv. Mater. Res. 931–932, 744–748. doi: 10.4028/www.scientific.net/AMR.931-932.744.
- Meng, B., Feng, X., Qiu, G., Cai, Y., Wang, D., Li, P., Shang, L., Sommar, J., 2010. Distribution patterns of inorganic mercury and methylmercury in tissues of rice (Oryza sativa L.) plants and possible bioaccumulation pathways. J. Agric. Food Chem. 58(8), 4951–4958. doi: 10.1021/jf904557x.
- Meng, B., Feng, X., Qiu, G., Liang, P., Li, P., Chen, C., Shang, L., 2011. The process of methylmercury accumulation in rice (Oryza sativa L.). Environ. Sci. Technol. 45(7), 2711–2717. doi: 10.1021/es103384v.
- Meng, M., Li, B., Shao, J.J., Wang, T., He, B., Shi, J.B., Ye, Z.H., Jiang, G.B., 2014. Accumulation of total mercury and methylmercury in rice plants collected from different mining areas in China. Environ. Pollut. 184, 179–186. doi: 10.1016/j.envpol.2013.08.030.
- Minister of Environment and Forestry, Indonesia, 2021. Minister of Environment and Forestry Regulation No. 6 of 2021 concerning Procedures and Requirements for Managing Hazardous and Toxic Waste. Department Environmental Affairs of Indonesia, Jakarta. https://jdih.menlhk.go.id/new/uploads/files/2021pmlhk006_menlhk_06082021104752.pdf (accessed 30 November 2022)
- Minister of Health, Indonesia, 2012. Guidelines for Environmental Health Risk Analysis, Directorate General of PP and PL. Minister of Health of Indonesia, Jakarta. https://ebook.poltekkestasikmalaya.ac.id/2020/08/13/pedoman-analisis-risiko-kesehatan-lingkungan-arkl/ (accessed 30 November 2022)
- Minister of Health, Indonesia, 2017. Minister of Health Regulation No. 32 of 2017 concerning Environmental Health Quality Standards and Water Health Requirements for Sanitary Hygiene, Swimming Pools, Solus Per Aqua, and Public Baths. Minister of Health of Indonesia, Jakarta. https://peraturan.bpk.go.id/Home/Details/112092/permenkes-no-32-tahun-2017 (accessed 30 November 2022)
- Murao, S., Tomiyasu, T., Ono, K., Shibata, H., Narisawa, N., Takenaka, C., 2019. Mercury distribution in artisanal and small-scale gold mining area: A case study of hot spots in Camarines Norte, Philippines. Int. J. Environ. Sci. Dev. 10(5), 122–129. doi: 10.18178/ijesd.2019.10.5.1160.
- Nakazawa, K., Nagafuchi, O., Kawakami, T., Inoue, T., Yokota, K., Serikawa, Y., Basir-Cyio, M., Elvince, R., 2016. Human health risk assessment of mercury vapor around artisanal small-scale gold mining area, Palu city, Central Sulawesi, Indonesia. Ecotoxicol. Environ. Saf. 124, 155–162. doi: 10.1016/j.ecoenv.2015.09.042.
- Natasha, Shahid, M., Khalid, S., Bibi, I., Bundschuh, J., Niazi, N.K., Dumat, C., 2020. A critical review of mercury speciation, bioavailability, toxicity and detoxification in soil-plant environment: Ecotoxicology and health risk assessment. Sci. Total Environ. 711, 134749. doi: 10.1016/j.scitotenv.2019.134749.
- Novirsa, R., Dinh, Q.P., Jeong, H., Addai-Arhin, S., Nugraha, W.C., Hirota, N., Wispriyono, B., Ishibashi, Y., Arizono, K., 2020. The dietary intake of mercury from rice and human health risk in artisanal small-scale gold mining area, Indonesia. Fundam. Toxicol. Sci. 7(5), 215–225. doi: 10.2131/fts.7.215.
- Novirsa, R., Quang, P., Jeong, H., Fukushima, S., Ishibashi, Y., Wispriyono, B., Arizono, K., 2019. The evaluation of mercury contamination in upland rice paddy field around artisanal small-scale gold mining area, Lebaksitu, Indonesia. J. Environ. Saf. 10(2), 119–125. doi: 10.11162/daikankyo.E19RP0103.
- OECD/FAO, 2021a. OECD-FAO Agricultural Outlook 2021–2030. OECD Publishing, Paris. doi: 10.1787/19428846-en (accessed 14 May 2023)
- OECD/FAO, 2021b. Table C.16.2—Rice projections: Consumption, food. OECD Publishing, Paris. doi: 10.1787/f4601323-en (accessed 14 May 2023)
- Rahman, A., Sari, N.P., Wispriyono, B., Novirsa, R., Simanjuntak, J.O., Fukushima, S., Arizono, K., Kusnoputranto, H., 2019. Risk assessment and community health profile among residents living in Artisanal and Small-scale Gold Mining site in Ciguha, Gunung Pongkor, Bogor. J. Environ. Saf. 10(2), 127–136. doi: 10.11162/daikankyo.E19RP0301.
- Rea, A.W., Lindberg, S.E., Keeler, G.J., 2001. Dry deposition and foliar leaching of mercury and selected trace elements in deciduous forest throughfall. Atmos. Environ. 35(20), 3453–3462. doi: 10.1016/S1352-2310(01)00133-9.
- Riaz, A., Khan, S., Muhammad, S., Shah, M.T., 2019. Mercury Contamination in Water and Sediments and the Associated Health Risk: A Case Study of Artisanal Gold-mining. Mine Water Environ. 38(4), 847–854. doi: 10.1007/s10230-019-00613-5.
- Saragih, G.S., Tapriziah, E.R., Syofyan, Y., Masitoh, S., Pandiangan, Y.S.H., Andriantoro, 2021. Mercury Contamination in Selected Edible Plants and Soil from Artisanal and Small-scale Gold Mining in Sukabumi Regency, Indonesia. Makara J. Sci. 25(4), 222–228. doi: 10.7454/mss.v25i4.1280.
- Sarkar, B., Mitchell, E., Frisbie, S., Grigg, L., Adhikari, S., Byanju, R.M., 2022. Drinking Water Quality and Public Health in the Kathmandu Valley, Nepal: Coliform Bacteria, Chemical Contaminants, and Health Status of Consumers. J. Environ. Public Health 2022, 3895859. doi: 10.1155/2022/3895859.
- Staven, L.H., Napier, B.A., Rhoads, K., Strenge, D.L., 2003. A Compendium of Transfer Factors for Agricultural and Animal Products. Pacific Northwest National Laboratory (PNNL), Richland, WA. https://www.pnnl.gov/publications/compendium-transfer-factors-agricultural-and-animal-products (accessed 30 November 2022).
- Tomiyasu, T., Hamada, Y.K., Kodamatani, H., Hidayati, N., Rahajoe, J.S., 2019. Transport of mercury species by river from artisanal and small-scale gold mining in West Java, Indonesia. Environ. Sci. Pollut. Res. Int. 26(24), 25262–25274. doi: 10.1007/S11356-019-05718-6.
- Tomiyasu, T., Kono, Y., Kodamatani, H., Hidayati, N., Rahajoe, J.S., 2013. The distribution of mercury around the small-scale gold mining area along the Cikaniki river, Bogor, Indonesia. Environ. Res. 125, 12–19. doi: 10.1016/J.ENVRES.2013.03.015.
- UNEP, 2013a. Global Mercury Assessment 2013: Sources, emissions, releases, and environmental transport. United Nations Environment Programme, Geneva. https://wedocs.unep.org/20.500.11822/7984 (accessed 22 November 2022)
- UNEP, 2013b. Mercury: Time to Act. United Nations Environment Programme, Geneva. https://wedocs.unep.org/20.500.11822/27436 (accessed 22 November 2022)
- US EPA, 1989. Risk Assessment Guidance for Superfund Volume I: Human Health Evaluation Manual Supplemental Guidance. United States Environmental Protection Agency, Washington D.C. https://www.epa.gov/risk/risk-assessment-guidance-superfund-volume-i-human-health-evaluation-manual-supplemental (accessed 2 November 2022)
- US EPA, 2011. Exposure Factors Handbook: 2011 Edition. United States Environmental Protection Agency, Washington D.C. https://www.nrc.gov/docs/ML1400/ML14007A666.pdf (accessed 2 November 2022)
- Wang, Y., Habibullah-Al-Mamun, M., Han, J., Wang, L., Zhu, Y., Xu, X., Li, N., Qiu, G., 2020. Total mercury and methylmercury in rice: Exposure and health implications in Bangladesh. Environ. Pollut. 265, 114991. doi: 10.1016/j.envpol.2020.114991.
- WHO, 2006. Summary report of the sixty-sixth meeting of JECFA. World Health Organization, Rome. https://www.fao.org/3/at875e/at875e.pdf (accessed 30 November 2022)
- WHO, 2021. Mercury and human health: Educational course. World Health Organization, Copenhagen. https://apps.who.int/iris/bitstream/handle/10665/345443/9789289055888-eng.pdf (accessed 22 November 2022)
- Yasuda, M., Yustiawati, Syawal, M.S., Sikder, M.T., Hosokawa, T., Saito, T., Kurasaki, M., 2011. Metal concentrations of river water and sediments in West Java, Indonesia. Bull. Environ. Contam. Toxicol. 87(6), 669–673. doi: 10.1007/S00128-011-0411-Z.
- Yeganeh, M., Afyuni, M., Khoshgoftarmanesh, A.H., Khodakarami, L., Amini, M., Soffyanian, A.R., Schulin, R., 2013. Mapping of human health risks arising from soil nickel and mercury contamination. J. Hazard. Mater. 244–245, 225–239. doi: 10.1016/j.jhazmat.2012.11.040.
- Yustiawati, Syawal, M.S., Terashima, M., Tanaka, S., 2006. Speciation analysis of mercury in river water in West Java, Indonesia. Tropics 15(4), 425–428. doi: 10.3759/tropics.15.425.
