Abstract
Objectives: This cross-sectional study aims to verify the concentrations of toluene and methyl ethyl ketone (MEK) in personal sampling of air and worker’s urine samples to create a safety/health strategy for a rubber shoe manufacturing factory in Bangkok, Thailand. Methods: Target workers were 180 workers in the rubber shoe manufacturing factory. The data were obtained through an interview using a questionnaire sheet, collection of air and urine samples to measure the toluene and MEK levels, and a walking observation survey. Air samples were individually collected by an organic vapor monitor (n=20). Urine samples were also individually measured (n=165). Results: Among 180 participants, 65.6% always used personal respiratory protective equipment (PPE), but all of them used a carbon cloth mask. Median toluene level was 681 ppb and MEK level was 7.23 ppm in air samples. Median toluene level was 3.14 µg/L and MEK level was 82.7 µg/L in urine samples. In 27 cases, toluene level in urine samples exceeded the exposure limit recommended by the ACGIH (30 µg/L). More than 10% of participants answered that they often had forgetfulness and dyspnea. Dyspnea was significantly positively related to MEK level in urine samples. There were seven cases with lower toluene and MEK levels in air samples but higher levels in urine samples. They sat in the leeward position and used no PPE and no rubber gloves while working. Conclusions: These results suggest that education, correct and suitable PPE, and strict work control should be implemented while working in rubber shoe manufacturing.
Introduction
Toluene and Methyl Ethyl Ketone (MEK) are volatile organic compounds and evaporate or dissipate into vapor under normal room temperature and pressure conditions. The abundance and long accumulation of toluene and MEK in the air will lead to adverse health effects among the exposed. Workers who inhale toluene and MEK in their workplace face a high risk of damaging their health1,2,3). The symptoms caused by toluene and MEK exposures depend on the quantity to which the workers are exposed4).
In Thailand, some industries, including those of middle-sized manufacturing, have poor strategies to prevent inhalation of organic solvents. Commonly, fans are often installed in the workplace for general ventilation, not for exhaust ventilation, which results in low efficiency of ventilation to eliminate chemicals5). Under these conditions, organic solvents are widely spread in the workplace, and the workers are likely to inhale them. Nonetheless, the concentrations of organic solvents are measured in only some workplaces, and many workers incorrectly use personal respiratory protective equipment (PPE)5). To make suitable strategies for preventing adverse health effects, it is necessary to evaluate the exposure to organic solvents, preferably using data from personal sampling. Information on such data, however, is currently lacking in Thailand6,7).
This study aims to verify the concentrations of toluene and MEK in personal sampling of air and worker’s urine samples to create a safety/health strategy for a rubber shoe manufacturing factory in Bangkok, Thailand. A rubber shoe manufacturing factory uses mainly toluene and MEK in their process to make rubber shoes. Workers could be exposed to toluene and MEK while painting glue containing the toluene and MEK onto the rubber sheets and pasting them.
Materials and Methods
Target factory and workers
The target factory was a medium-sized (the number of workers was 240, excluding office workers) rubber shoe manufacturing factory in Bangkok, Thailand. The factory normally uses about 600 liters each of toluene and MEK a month. No other organic solvents were used.
The factory building was two stories high. On the first floor, there was the workspace measuring 50×68×4.2 meters in size (width×length×height). Within that, there were five identical lines for producing the rubber shoes. There were about 50 workers on each line, working on either side. In the first section of the production line, about twenty participants were involved in making the rubber sheets that make up the shoes. In the middle section of the line, about twenty workers were mainly painting glue containing toluene and MEK onto rubber sheets, and pasting them with heat from heating equipment. In the third and final section of the line, about ten workers were active in checking the shoes, packing them into a plastic bag and then a paper box, and labeling the paper box.
A wall-mounted fan was installed for general ventilation in the workplace, but no local exhaust ventilation was installed. Measurements of the working environment were performed several times. The sampling performed for the current study was the first such sampling in the working condition. The PPE provided by the factory management for the workers was a carbon cloth mask (TG33W; Sira Safety, Bangkok, Thailand).
Targeted workers were all workers in the factory (n=240). One of the researchers explained the purposes and methods of the study to them. Of all workers, 180 were willing to participate in the study (participation rate 75%). During the study period, they performed work as usual.
Procedures
This was a cross-sectional study. The data were obtained through an interview using a questionnaire sheet, collection of air and urine samples, and a walking observation survey.
Interview
The interview was conducted in a quiet, privacy-guaranteed room in the factory by the researchers’ team, composed of one researcher, six research assistants, and three persons in charge of the factory. The aim was to explore the working conditions and symptoms. All members of the researchers’ team were fully trained by the principal researcher. The interview time for each participant was less than 10 minutes. The interview was performed at the end of working time (17:00–19:00) on the study day.
The contents of the questionnaire sheet concerned demographic characteristics, working conditions, and symptoms. In the demographic characteristics section, gender, age, marital status, and highest level of education were asked. In the working conditions section, working career, working hours in a day, working days in a week, and the use of PPE were asked. The answers for the use of PPE were ‘always use’, ‘often use’, ‘sometimes use’, and ‘do not use’. In the symptoms section, 26 symptoms were asked: headache, eye irritation, neck stiffness, nausea, cough, decreased grip strength, dyspnea, depression, angina pain, anxiety, skin dryness, sleeplessness, chills and trembling, sweating, general malaise, dizziness, standing dizziness, forgetfulness, convulsion, nightmares, impaired concentration, abdominal pain, fatigue in the arms and legs, arrhythmia, mouth dryness, and tachycardia. These symptoms were selected from the earlier reports5) and the experiences of researchers. The answer was one of three choices: ‘no’, ‘sometimes’, and ‘often’.
Collection of air and urine samples
The American Conference Governmental Industrial Hygienist (ACGIH) recommends measurement of toluene and MEK using exposure index8). The concentrations of toluene and MEK in air and urine samples were, therefore, measured in this study.
Twenty participants in total were selected for air sampling from three working sections: seven participants from the first section of the production lines, seven participants from the middle section, and six participants from the end section. Organic vapor monitors (3M 3500; 3M Thailand, Bangkok, Thailand) were used to collect air samples for measurement of the average concentrations of toluene and MEK in the surrounding atmosphere of the working conditions on the study day (n=20). It was attached to the lapel of workers during the entire working day (08:00–17:00, including 1-hour lunchtime).
To extract toluene and MEK from the monitor, 2 mL of carbon disulfide was used. The sampler was kept in the eluent for 1 hour. After that, the concentrations of toluene and MEK, in ppb, were measured using headspace gas chromatography (GC) (7890B Gas Chromatograph System; Agilent Company, Santa Clara, CA, USA) connected to flame ionization detector (FID) (Agilent Company) with a capillary column (Aquawax; Analytic Columns, Croyden, United Kingdom).
All participants were asked to provide urine samples. Fifteen participants failed to take a urine test. Urine were sampled using 20 mL plastic bottles at the end of work for measuring the concentrations of toluene and MEK in urine, µg/L (n=165). The bottles were stored in ice box coolers. We used the same apparatus as that used for measurement of the concentrations of air samples.
A walking observation survey
During work time on the study day, one of the researchers made a walking observation survey. She checked the temperatures at the workplace, the working section of the production lines and whether they were sitting or standing, as well as whether participants used PPE and rubber gloves while they worked.
Statistical analysis
Descriptive statistics of demographic characteristics, work condition, symptoms, and concentration of toluene and MEK in air and urine samples were shown using number, percentage, mean, standard deviation (SD), median, interquartile range (IQR), and range.
To compare the medians, Mann-Whitney U test was used when there were two groups, and Kruskal Wallis test was used when there were three groups. The level of statistical significance was set at p<0.05.
Ethical consideration
One of the researchers explained the study aims and procedures, the protection of personal information and answers, that participation was voluntary, and that there was no disadvantage in non-participation. Those who agreed to participate in this study submitted the informed consent form to the researchers. This protocol was approved by the Burapha University Ethical Committee (June 6, 2017).
Results
Demographic characteristics, working conditions and symptoms
The participants were 180 workers. The proportion of females was 87.8% (Table 1). The majority age group was 21–25 years (26.1%). The average of age was 29.6 (SD 7.8) years. The majority group for highest education level was junior high school (42.8%), and 55.0% of participants were single. The majority of participants (78.3%) had been working in the factory 1–5 years. Over half of participants (58.3%) worked for 10–12 hours per day, and all of them (100%) worked 6 days a week.
Table 1. Demographic characteristics of participants (n=180)
| Demographic characteristics | Number | Percentage |
|---|
| Gender | Male | 22 | 12.2 |
| Female | 158 | 87.8 |
| Age (years old) | 18–20 | 18 | 10.0 |
| 21–25 | 47 | 26.1 |
| 26–30 | 44 | 24.4 |
| 31–35 | 38 | 21.1 |
| 36–40 | 17 | 9.4 |
| 41–55 | 16 | 8.9 |
| Marital status | Single | 99 | 55.0 |
| Married | 75 | 41.7 |
| Widower/ Divorce/ Separation | 6 | 3.3 |
| Highest level of education | Elementary school | 44 | 24.4 |
| Junior high school | 77 | 42.8 |
| Senior high school | 50 | 27.8 |
| Secondary school and beyond | 9 | 5.0 |
PPE was always used by 118 workers (65.6%), often used by 48 workers (26.7%), sometimes used by 7 workers (3.9%), and not used by 7 workers (3.9%).
The reasons for using the PPE among PPE users (n=173) were bad smell (54.9%), protection from lung diseases (52.6%), and protection from dust or smoke (50.9%), in descending order (multiple answer). The reasons for not using PPE among the 7 non-users (3.9%) were that the equipment was uncomfortable and inconvenient in breathing (85.7%) and that they had no such equipment (14.3%), in descending order (multiple answer).
In the walking observation survey, there were was no air-conditioning apparatus in the workplace. The temperature on the study day was 33–35˚C. Under a general ventilation fan, some workers put a brush into the container of glue containing toluene and MEK with a separate lid, and then spread it onto the rubber sheets. These workers mostly used chairs provided by the company. Others alternated between sitting and standing. The participants sometimes moved to another working section for the purpose of helping others. Some workers used no PPE and some used it incorrectly, even when following the procedure. Most workers did not use their rubber gloves while working. Some workers drank water in the workplace.
Symptoms that participants answered “often” were forgetfulness (18.3%), dyspnea (10.6%), sleeplessness (6.1%), dizziness (5.6%), arrhythmia (5.6%), anxiety (5.0%), standing dizziness (5.0%), convulsion (5.0%), fatigue in the arms and legs (5.0%), tachycardia (4.4%), abdominal pain (3.9%), eye irritation (3.3%), headache (2.8%), decreased grip strength (2.8%), depression (2.8%), neck stiffness (2.2%), general malaise (2.2%), nightmares (2.2%), cough (1.7%), sweating (1.7%), impaired concentration (1.7%), chills and trembling (1.1%), mouth dryness (1.1%), nausea (0.6%), angina pain (0%), and skin dryness (0%), in descending order.
Concentrations of toluene and MEK in air samples
The distribution of the concentrations of toluene in air samples are shown in Figure 1a. Most concentrations ranged from 400 to less than 800 ppb. The median concentration was 681 (IQR 458–904; range: 235–1,127) ppb. The concentrations of toluene did not exceed the exposure limit recommended by the ACGIH (20,000 ppb)8). The median concentration in the first section of the production lines was 422 ppb (n=7), that in the middle section was 845 ppb (n=7), and that in the end section was 728 ppb (n=6). There was no significant difference in the median concentrations of the three working sections.
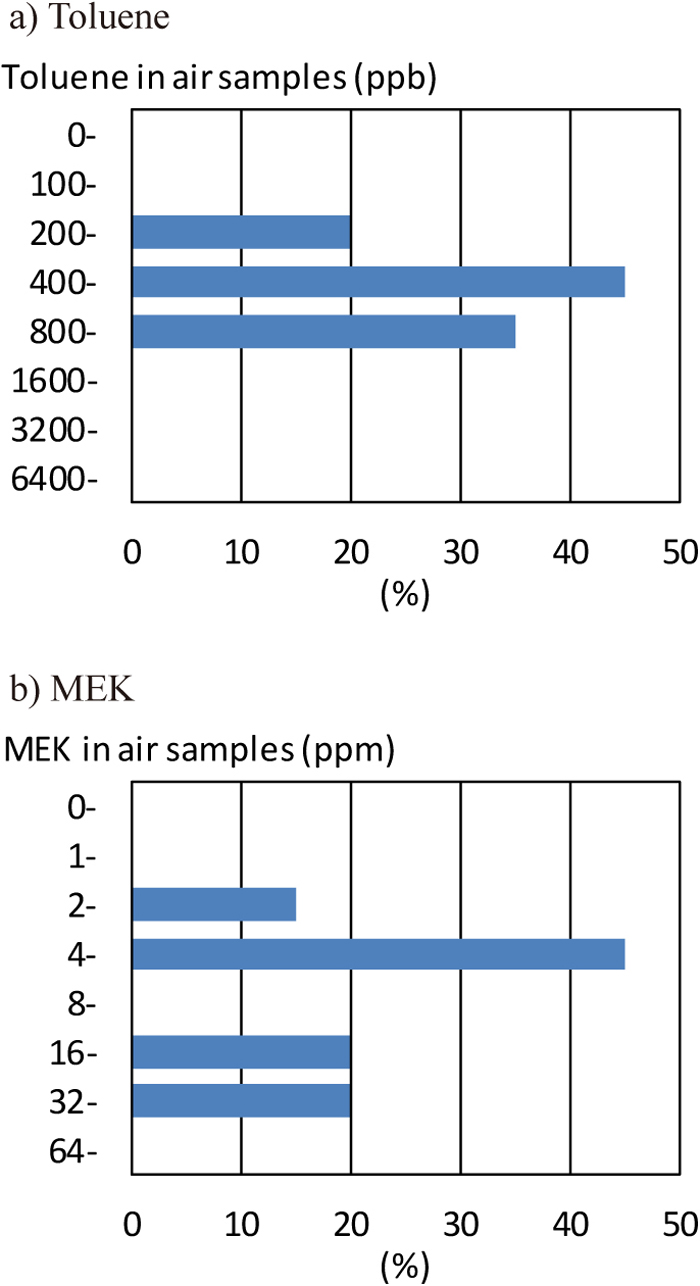
The distribution of the concentrations of MEK in air samples was shown in Figure 1b. The most common concentrations ranged from 4 to less than 8 ppm. Median concentration was 7.23 (IQR 5.03–21.92; range 2.79–60.65) ppm. The concentrations of MEK in air samples were not in excess of the exposure limit recommended by the ACGIH (200 ppm)8). The median concentration in the first section of the production lines was 5.26 ppm (n=7), that in the middle section was 18.64 ppm (n=7), and that in the end section was 7.03 ppm (n=6). That in the middle section was significantly higher than other sections.
Concentrations of toluene and MEK in urine samples
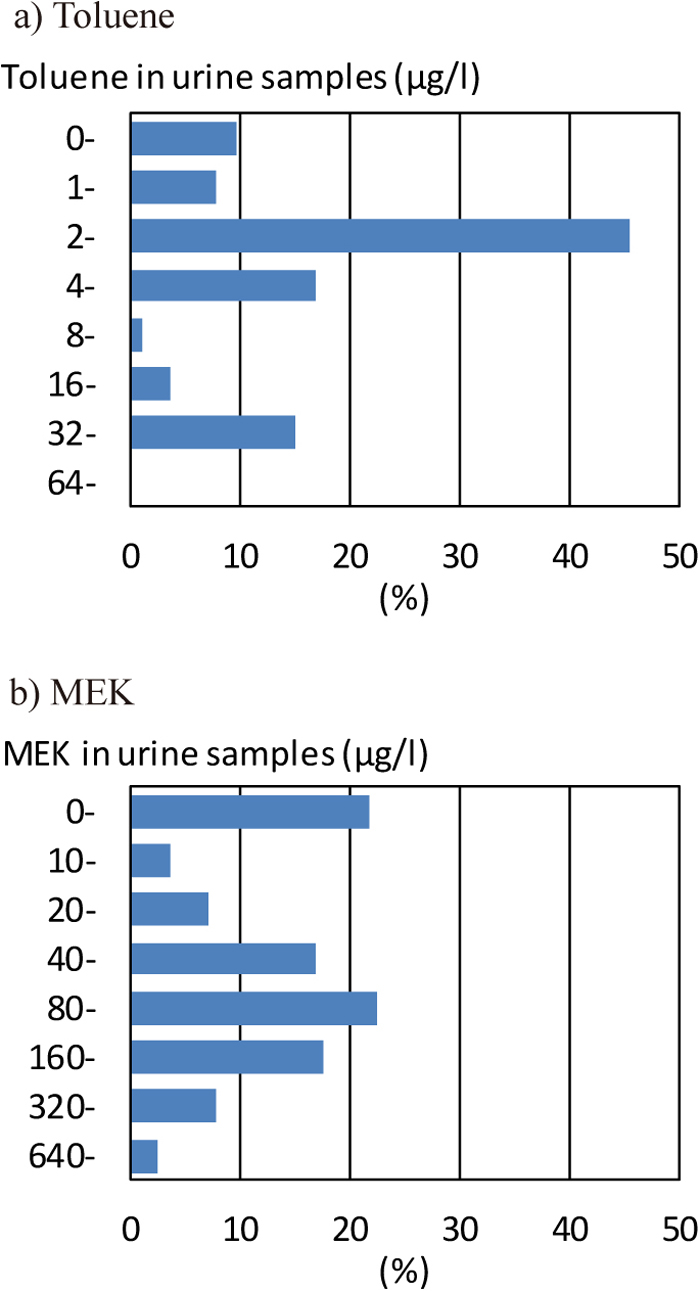
The distribution of the concentration of toluene in urine samples is shown in Figure 2a. The most common concentrations were between 2 and 4 µg/L. The median concentration was 3.14 (IQR 2.26–5.59; range 0–63.06) µg/L. Twenty-seven (16.4%) cases exceeded the exposure limit recommended by the ACGIH (30 µg/L)8). In the walking observation survey, 27 cases whose concentrations of toluene in urine exceeded the exposure limit sat in the leeward position (n=11), and did not use the PPE (n=14) or the rubber gloves (n=21).
The distribution of the concentration of MEK in urine samples is shown in Figure 2b. The most commonly obtained concentrations ranged from 80 to less than 160 µg/L. The median concentration was 82.7 (IQR 20.0–194.1; range: 0–1,231) µg/L. Concentrations of MEK in urine samples were under the exposure limit (2,000 µg/L)8).
Concentrations of toluene and MEK and Symptoms
The concentrations of toluene and MEK in air and urine samples were compared between two groups: those with symptoms (‘often’ and ‘sometimes’) and those without symptoms. There was no significant difference in the median concentrations of toluene and MEK in air samples between the groups.
Participants who had sleeplessness, standing dizziness, forgetfulness, convulsion, arrhythmia, or tachycardia showed significantly lower concentration of toluene in urine samples (Table 2). On the other hand, those who had dyspnea showed significantly higher concentration of MEK in urine samples.
Table 2. Toluene and MEK concentrations in urine samples by group: with symptoms and without symptoms
| | n | Toluene in urine (μg/L) | | MEK in urine (μg/L) | |
|---|
| Headache | Yes | 124 | 3.17 | (2.26–5.86) | | 85.2 | (23.5–210.3) | |
| No | 41 | 3.14 | (2.36–4.93) | | 54.9 | (4.6–122.0) | |
| Eye irritation | Yes | 98 | 3.54 | (2.26–22.98) | | 86.7 | (37.7–229.4) | |
| No | 67 | 2.98 | (2.33–4.02) | | 68.2 | (12.6–147.2) | |
| Neck stiffness | Yes | 92 | 2.83 | (2.17–6.68) | | 81.2 | (27.0–195.0) | |
| No | 73 | 3.40 | (2.44–4.85) | | 82.7 | (15.7–192.6) | |
| Nausea | Yes | 45 | 2.68 | (2.11–4.92) | | 84.3 | (23.1–191.0) | |
| No | 120 | 2.86 | (2.24–6.25) | | 77.3 | (17.1–198.4) | |
| Cough | Yes | 80 | 3.08 | (2.40–5.60) | | 93.1 | (25.3–207.9) | |
| No | 85 | 3.28 | (2.14–4.93) | | 68.6 | (17.5–147.2) | |
| Decreased grip strength | Yes | 73 | 3.13 | (2.35–6.74) | | 89.3 | (20.2–229.2) | |
| No | 92 | 3.17 | (2.35–4.87) | | 74.0 | (21.9–147.2) | |
| Dyspnea | Yes | 99 | 3.20 | (2.26–6.37) | | 87.4 | (28.2–233.2) | ** |
| No | 66 | 3.14 | (2.45–4.16) | | 68.8 | (9.6–121.3) | |
| Depression | Yes | 50 | 2.75 | (2.13–4.70) | | 74.6 | (15.5–183.5) | |
| No | 115 | 3.21 | (2.43–7.51) | | 84.3 | (23.5–199.2) | |
| Angina pain | Yes | 33 | 3.22 | (2.36–4.92) | | 91.4 | (18.9–258.3) | |
| No | 132 | 3.14 | (2.26–5.73) | | 73.4 | (21.6–161.1) | |
| Anxiety | Yes | 98 | 2.99 | (2.24–4.83) | | 82.7 | (6.2–188.8) | |
| No | 67 | 3.32 | (2.45–27.77) | | 73.5 | (29.5–219.8) | |
| Skin dryness | Yes | 67 | 3.22 | (2.26–4.83) | | 84.3 | (17.3–195.9) | |
| No | 98 | 3.14 | (2.33–21.66) | | 77.3 | (22.4–184.7) | |
| Sleeplessness | Yes | 56 | 2.57 | (1.98–5.07) | * | 85.0 | (19.7–195.0) | |
| No | 109 | 3.28 | (2.47–6.74) | | 74.8 | (23.1–192.6) | |
| Chills and trembling | Yes | 19 | 2.41 | (2.15–3.32) | | 85.6 | (11.5–210.1) | |
| No | 146 | 3.25 | (2.37–5.96) | | 77.3 | (22.4–193.7) | |
| Sweating | Yes | 48 | 2.91 | (2.34–5.23) | | 98.7 | (12.3–198.0) | |
| No | 117 | 3.21 | (2.26–5.61) | | 75.6 | (23.1–194.1) | |
| General malaise | Yes | 61 | 3.03 | (2.25–4.83) | | 82.7 | (8.5–150.3) | |
| No | 104 | 3.24 | (2.83–10.46) | | 80.4 | (23.5–210.3) | |
| Dizziness | Yes | 95 | 3.13 | (2.31–5.31) | | 86.0 | (21.0–199.2) | |
| No | 70 | 3.17 | (2.27–6.40) | | 68.9 | (18.9–181.2) | |
| Standing dizziness | Yes | 83 | 2.81 | (2.26–4.14) | ** | 84.3 | (17.3–195.9) | |
| No | 82 | 3.46 | (2.37–28.31) | | 77.3 | (22.4–182.9) | |
| Forgetfulness | Yes | 129 | 3.02 | (2.21–4.76) | ** | 75.6 | (10.7–191.0) | |
| No | 36 | 4.67 | (2.65–37.25) | | 85.9 | (54.1–238.0) | |
| Convulsion | Yes | 76 | 2.91 | (2.19–4.13) | ** | 86.5 | (15.4–191.4) | |
| No | 89 | 3.29 | (2.42–31.46) | | 69.2 | (22.1–204.3) | |
| Nightmares | Yes | 67 | 3.21 | (2.28–5.84) | | 99.7 | (36.3–209.9) | |
| No | 98 | 3.14 | (2.28–5.07) | | 67.8 | (12.4–149.9) | |
| Impaired concentration | Yes | 28 | 2.75 | (2.25–4.05) | | 87.7 | (13.5–261.5) | |
| No | 137 | 3.28 | (2.29–6.74) | | 76.5 | (23.1–191.0) | |
| Abdominal pain | Yes | 86 | 3.13 | (2.25–4.85) | | 85.8 | (35.7–192.2) | |
| No | 79 | 3.22 | (2.40–27.77) | | 68.3 | (7.8–219.8) | |
| Fatigue in the arms and legs | Yes | 73 | 2.81 | (2.11–4.85) | | 76.5 | (18.9–182.3) | |
| No | 92 | 3.24 | (2.48–10.61) | | 84.4 | (23.5–210.6) | |
| Arrhythmia | Yes | 73 | 2.66 | (2.18–4.07) | ** | 85.6 | (14.4–154.1) | |
| No | 92 | 3.65 | (2.47–12.16) | | 73.4 | (23.3–221.7) | |
| Mouth dryness | Yes | 58 | 2.73 | (2.19–4.05) | | 85.0 | (27.8–199.1) | |
| No | 107 | 3.28 | (2.45–7.10) | | 78.2 | (19.4–191.8) | |
| Tachycardia | Yes | 72 | 2.79 | (2.22–4.03) | ** | 80.4 | (21.6–184.4) | |
| No | 93 | 3.40 | (2.35–26.67) | | 82.7 | (17.5–228.2) | |
MEK, methyl ethyl ketone.
Values are reported as median (IQR)
Mann-Whitney U test: * p<0.05 ** p<0.01
Figure 3 shows the relationship between toluene and MEK concentrations in air samples and those in urine samples. As the concentration of toluene in air samples became higher, that in urine samples also increased (Figure 3a). There were four participants whose concentration in urine sample was high but whose concentration in air samples was low. In the walking observation survey, these participants were working in the first section (3 workers) or in the end section (1 worker) of the production lines; were sitting in the leeward position (all 4 workers); and used no PPE (1 worker) and no rubber gloves (2 workers) while working.
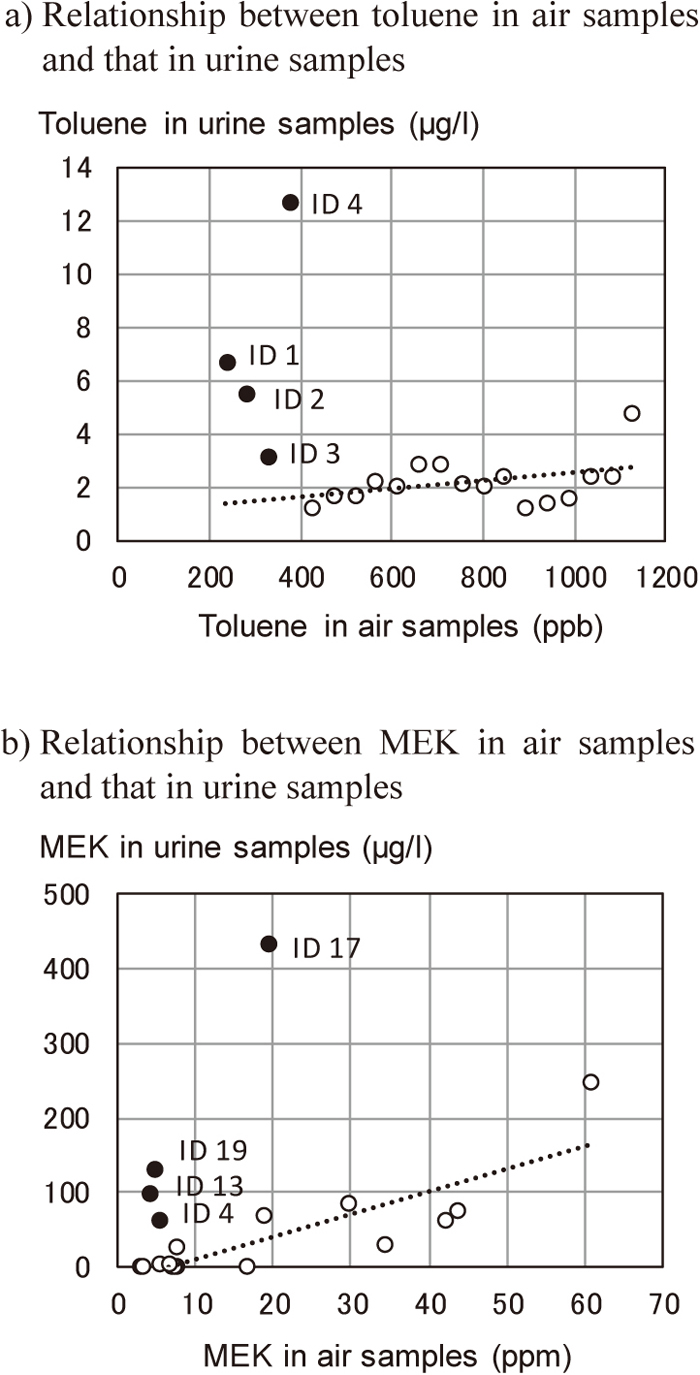
As the concentration of MEK in air sample increased, so did that in urine samples (Figure 3b). As with toluene concentrations, there were four participants whose concentration of MEK in their urine sample was high despite having low concentrations in air samples. In the walking observation survey, they were working in the first section (1 worker), in the middle section 1 worker) or the end section (2 workers) of the production lines; were sitting in the leeward position (all 4 workers); and used no PPE (all 4 workers) and no rubber gloves while working (3 workers).
Discussion
The concentration of toluene and MEK in air samples and the concentration of MEK in urine samples were less than exposure limit recommended by the ACGIH8). However, the concentration of toluene in urine samples was in excess of the exposure limit in 27 cases. More than 10% of participants replied that they often had forgetfulness and dyspnea. Dyspnea was positively related to the concentration of MEK in urine samples. Those who were exposed to the lower concentrations of toluene and MEK in air samples but showed higher concentrations in urine samples sat in the leeward position and used no PPE and no rubber gloves while working.
Participants in this study were mainly working 10–12 hours in a day and 6 days in a week. They were at risk of inhaling toluene and MEK in the working environment.
Two-thirds of participants in this study always used their PPE. The PPE was, however, only a carbon cloth mask. This can be used as air purifier to prevent odor and chemicals. Although toluene and MEK are readily adsorbed by activated carbon9), the surgical mask is usually used only to prevent spreading of the particles emitted from the person wearing the mask into the atmosphere. Even if the concentration of toluene and MEK in the air is less than exposure limits requiring remediation, a suitable type of PPE needs to be used that takes into consideration leakage through the gap between the face and a mask of this type.
The factory did not provide the workers with the appropriate type of PPE. Among participants, 3.9% sometimes used it, and 3.9% do not use it. In a battery manufacturing plant in Thailand, most workers did not use any PPE and some used cotton masks to protect themselves from dust exposure10). The insufficient use of PPE in this study still corresponds with that of the earlier report in 2003.
Understanding the reasons for not using the PPE is important in advancing work management and creating a safer working condition. The main reasons given by the seven non-users of the PPE were that the equipment was uncomfortable and inconvenient in breathing. They had a negative view on using the PPE and did not realize its importance or necessity. This is partially because the participants are not aware of the smell of the toluene and MEK. Toluene has an aromatic, benzene-like odor, detectable at 0.16 to 37 ppm11). The smell is a sweet, distinct odor12). In case of MEK, odor is detectable at 2 to 85 ppm13). The smell is a sharp, sweet odor reminiscent of butterscotch14).
More than 10% of participants answered that they often had forgetfulness and dyspnea. Few, however, responded that they often had eye irritation or cough. In a previous study, eye and upper airway irritation occurred after a 6.5-hour exposure to an air level of 100 ppm toluene. Volunteers exposed to 100 ppm toluene for 6 hours a day for 4 days suffered from subjective complaints of headache, dizziness, and a sensation of intoxication11). In this study, the toluene concentration in air samples was less than 1.2 ppm. Thus, the symptoms were not reported and were not related to the toluene concentration in air samples.
MEK is an irritant, causing irritation to the human eyes and nose14). In this study, however, symptoms of irritation were not reported in relation to the MEK concentration in air samples. This result corresponded with an earlier report that the irritation effects were not related to MEK concentration in the air by exposure to solvent mixtures that include MEK (geometric mean 16 ppm)15).
Toluene causes toxicity throughout the body, specifically affecting the pulmonary system and central and peripheral nervous system, as well as the gastrointestinal, cardiovascular, renal, hepatic, dermal, and hematological systems11,16). In this study, those who had sleeplessness, standing dizziness, forgetfulness, arrhythmia, or tachycardia showed significantly lower concentration of toluene in urine samples than those without such symptoms. In the interviews, the researchers failed to clarify concrete past or present histories that would cause symptoms listed in the questionnaire sheet. There may be inverse relationships. The reason for this result will need to be examined in the near future.
Meanwhile, those who had dyspnea showed significantly higher concentration of MEK in urine samples than those without dyspnea. Information on the chronic effects of MEK in humans is limited13). Symptoms caused by absorption of volatile solvents seem to depend on the concentration of such solvents in urine samples, even if the concentrations of MEK in urine samples were low.
Toluene and MEK are both dermally and orally absorbed5). In case of lower concentrations in air samples but higher concentrations in urine samples, absorption from the skin and the food are assumed because of non-use of rubber gloves and from participants drinking water in the workplace. In this study, higher concentrations might have resulted from sitting in the leeward position, non-use of PPE, and non-use of rubber gloves while working.
Half of our participants worked for 10–12 hours and all of them worked 6 days a week. This shows that the work hours in the factory were on average 60–70 hours per week. The exposure limit of ACGIH was set for a 40-hour work week8). Consequently, the concentrations obtained in this study may possibly underestimate actual exposure.
Concentrations of toluene in urine samples were in excess of the exposure limit of ACGIH in 27 samples, although the concentrations of toluene in air samples were under the exposure limit8). Although the section where the participants were working could not always be clearly identified because they sometimes moved to another section, there was no significant difference in the median concentration across the three working sections. Consequently, higher concentrations of toluene in urine might also result from sitting in the leeward position, non-use of PPE, and non-use of rubber gloves while working. It is an important finding that, even if the concentration in the air is below the exposure limit, the urine concentration will exceed the exposure limit without proper work management.
The concentrations of MEK in air samples and in urine samples were not in excess of the exposure limit recommended by the ACGIH8), even if the median concentration in the air samples in the middle section was significantly higher than other two sections. Low concentration in the air samples may result from low consumption of the solvents.
In this study, the workers in a rubber shoe manufacturing factory were exposed to toluene and MEK in their working environment. The PPE was a carbon mask, which has low protection efficiency. The workers were not seriously considering the harmfulness of volatile solvents. The managers in the factory should properly educate the workers on the dangers of exposure to toluene and MEK and the importance of PPE, and they should not only provide workers with PPE suitable for the type of work, but they should strictly check whether workers are following regulations before and during working.
We should mention possible limitations. The researchers measured the concentration in the air and urine samples for an 8-hour period. These concentrations may not adequately express the real exposure of the workers, who often work more than 8 hours in a day. The concentrations in air samples do not necessarily represent the volume of inhalation. To clarify the volume of inhalation, it is preferable to examine the concentration in the blood, as pointed out by Mandiracioglu et al.4).
Conclusion and Recommendation
Among 180 workers in a rubber shoe manufacturing factory in Bangkok, 65.6% always used PPE, but this was an inadequate carbon cloth mask. Toluene and MEK levels in air samples and MEK in urine samples were less than exposure limits. Toluene level in urine was in excess of the exposure limit in 27 cases. More than 10% of participants replied that they often had forgetfulness and dyspnea. Dyspnea was positively related to the MEK level in urine samples. Those who were exposed to lower toluene and MEK levels in air samples but showed higher levels in urine samples sat in the leeward position, used no PPE, and used no rubber gloves while working. These results suggest that education, correct and suitable PPE, and strict work control are necessary to decrease the absorption of solvents in this workplace.
Acknowledgments
This study has received supporting funds for research as grants by the government supporting fund for the year 2016 of Burapha University.
This study would not have been possible if not for cooperative group of participants and collaboration from the featured workers, for their assistance and the help throughout this study and research. We would like to thank Miss Acamsiri Lormphongs for helping with the preparation of the apparatus for the collection of the urine samples and others who contributed from the beginning of the study to its completion. We acknowledge proofreading and editing by Benjamin Phillis at the Clinical Study Support Center, Wakayama Medical University.
Conflict of interest
The authors declare no conflicts of interest.
References
- 1. Angerer J, Krämer A. Occupational chronic exposure to organic solvents. XVI. Ambient and biological monitoring of workers exposed to toluene. Int Arch Occup Environ Health. 1997; 69(2): 91-96.
- 2. Dennison JE, Bigelow PL, Mumtaz MM, Andersen ME, Dobrev ID, Yang RS. Evaluation of potential toxicity from co-exposure to three CNS depressants (toluene, ethylbenzene, and xylene) under resting and working conditions using PBPK modeling. J Occup Environ Hyg. 2005; 2(3): 127-135.
- 3. Todd L, Puangthongthub ST, Mottus K, Mihlan G, Wing S. Health survey of workers exposed to mixed solvent and ergonomic hazards in footwear and equipment factory workers in Thailand. Ann Occup Hyg. 2008; 52(3): 195-205.
- 4. Mandiracioglu A, Akgur S, Kocabiyik N, Sener U. Evaluation of neuropsychological symptoms and exposure to benzene, toluene and xylene among two different furniture worker groups in Izmir. Toxicol Ind Health. 2011; 27(9): 802-809.
- 5. Srirat L. The factors related to urinary MEK level among workers in a rubber shoe manufacturing factory in Bangkok. Thammasat Med J. 2017; 17(4): 507-515. Listed in TCI and Scopus in Thailand.
- 6. Wanna L, Kunio Y, Auemphorn M, et al. Characterization of ambient benzene, toluene, ethylbenzene and m-, p-and o-xylene in an urban traffic area in Bangkok, Thailand. Int J Environ Pollut. 2009; 36(1/2/3): 241-254. Listed in TCI and Scopus in Thailand.
- 7. Todd LA, Mottus K, Mihlan GJ. A survey of airborne and skin exposures to chemicals in footwear and equipment factories in Thailand. J Occup Environ Hyg. 2008; 5(3): 169-181.
- 8. ACGIH. Threshold limit values for the Chemical substances and physical agents and biological exposure indices. American Conference of Governmental Industrial Hygienists, Cincinnati, Ohio, USA. 2011.
- 9. IP Systems. List of adsorption ability of activated carbon for various materials. Technical Information Bulletin. [Online]. 2019 [cited 2019 July 31]; Available from: http://ipsystemsusa.com/images/resources/Activated_Carbon_Adsorption_List.pdf
- 10. Lormphongs S, Miyashita K, Morioka I, Chaikittiporn C, Miyai N, Yamamoto H. Lead exposure and blood lead level of workers in a battery manufacturing plant in Thailand. Ind Health. 2003; 41(4): 348-353.
- 11. Chemical book: Toluene. [Online]. 2017 [cited 2019 September 8]; Available from: https://www.chemicalbook.com/ChemicalProductProperty_EN_CB4233905.htm
- 12. Vitale CM, Gutovitz S. Aromatic (Benzene, Toluene) Toxicity. StatPearls [Internet]. Treasure Island (FL): StatPearls Publishing; 2018-. 2019 Jan 20. [Online]. 2019 [cited 2019 September 8]; Available from: https://www.ncbi.nlm.nih.gov/books/NBK532257/
- 13. Chemical book: 2-Butanone. [Online]. 2017 [cited 2019 September 8]; Available from: https://www.chemicalbook.com/ChemicalProductProperty_EN_CB4854386.htm
- 14. Wikipedia, the free encyclopedia: Butanone. [Online]. 2019 [cited 2019 September 8]; Available from: https://en.wikipedia.org/wiki/Butanone
- 15. Ukai H, Takada S, Inui S, et al. Occupational exposure to solvent mixtures: effects on health and metabolism. Occup Environ Med. 1994; 51(8): 523-529.
- 16. Karita K, Yano E, Jinsart W, Boudoung D, Tamura K. Respiratory symptoms and pulmonary function among traffic police in Bangkok, Thailand. Arch Environ Health. 2001; 56(5): 467-470.