Original Articles
Relationships between work and objectively measured sedentary time and physical activity in older adults: a descriptive cross-sectional study

2021 年 3 巻 1 号 論文ID: 2021-0003-OA

詳細
2021 年 3 巻 1 号 論文ID: 2021-0003-OA
Objectives: This study aimed to objectively assess sedentary time (ST) and physical activity (PA) time during work performed by older adults and investigate the relationship between work and ST/PA in daily life of this population. Methods: Participants were recruited from members of a Silver Human Resources Center and their families and friends. Data for 194 participants (131 workers and 63 non-workers) were included in the analysis. ST/PA during work (workers only) and daily life (all participants) were assessed using an accelerometer. ST/PA during work were defined according to the Japan Standard Occupational Classification. Associations between work and ST/PA in daily life were analyzed by covariance analysis adjusted for confounders. Results: ST during work was longest in clerical workers (35±16.0 min/h). Light-intensity PA during work was shortest in clerical workers (23.2±15.6 min/h), whereas this value was similar among the other occupational classes. Moderate-to-vigorous PA during work was relatively longer in construction and mining workers (15.3±11.9 min/h). Workers were found to have shorter sedentary and longer PA time in their daily life than non-workers. Moreover, workers with longer weekly work hours (≥14 h/wk) were found to have significantly shorter sedentary and longer PA time, and this trend was apparent in blue-collar workers. Conclusions: This study demonstrated objectively assessed ST/PA during work in older adults according to occupational classifications. Furthermore, it investigated the associations between work and ST/PA in daily life and showed the potential contribution of work, particularly blue-collar work, in decreasing ST and increasing PA.
Maintaining physical activity (PA) at or above a certain level throughout advanced age has been reported to be effective in preventing various chronic diseases and geriatric syndrome, while also being associated with maintaining good quality of life and lowering mortality risk, according to previous epidemiological studies1). Most daily life activities in older adults are sedentary behaviors2); however, routinely prolonged periods of sedentary behavior are reported to be a risk factor of various health outcomes3). These findings are reflected in the recent PA guidelines, which offer guidance on PA and sedentary behaviors, and emphasize the importance of decreasing sedentary behaviors while increasing daily PA4,5). Older adults accounted for 28.6% of the Japanese population as of 20206), and this number is estimated to reach 38.4% by 2065 according to the Japanese government7). Given its faster aging rate than other countries, prevention of age-related decrease in PA and increase in sedentary time (ST) in older adults are important public health issues in Japan today.
The continuous employment system, which seeks to re-employ older adults who have reached retirement age, and establishment of Silver Human Resources Centers in cities, towns, and villages conforming to the Act on Stabilization of Employment of Elderly Person have improved accessibility of employment for older adults who have reached retirement age8). As reforms to the above law have also been passed to further organize the work environment to suit older workers, initiatives to promote employment for older adults is a hot topic in Japan9). According to the Cabinet Office survey, 85.8% of men and 62.6% of women aged 60–64 years have paid employment10). As >50% of these working elderly have answered that they wish to continue working until 70 years or even later10), Japanese older adults appear to be highly motivated for employment. A previous study has reported that retirement is a factor leading to decreased total daily PA in older adults11); employment throughout advanced age may contribute to increasing PA or decreasing ST in daily life. That is, incentivizing employment and further improving working environments to facilitate employment for older adults may be an indirect population approach to promote PA. However, work does not necessarily decrease ST or increase PA in daily life. It may actually limit the available time for other forms of PA and lead to increased ST during non-working hours due to work-related fatigue. Moreover, some types of employment such as those involving sedentary work may increase ST. To the best of our knowledge, details of ST and PA performed by older adults during work are unknown. There have not been any previous studies that have investigated the relationship between work and ST/PA in daily life in older adults; thus, whether work actually contributes to shorter sedentary and longer PA time in advanced age is unclear.
This study, therefore, aimed to objectively assess ST/PA during work performed by older adults with an accelerometer and investigate the relationship between work and ST/PA in daily life by comparing ST/PA in workers and non-workers among older adults.
Participants were recruited from the members of the M city Silver Human Resources Center (total members=2,090) and their families and friends. Of the 231 who agreed to participate, 150 were engaged in paid employment at the time of joining the study, whereas 81 were non-workers. All the participants were aged ≥60 years and physically independent; thus, none of them required a cane or walking aid for transport. The flowchart showing the selection process of participants for various investigative objectives is presented in Figure 1. Data of 194 participants (131 workers and 63 non-workers) were included in the analysis. Silver Human Resources Center is a public service corporation regulated by law that offers temporary, short-term or light employment opportunities for older adults in their familiar communities. It is regarded as an important organization that improves accessibility of ikigai (reason for living) work for older adults8). That is, many of the workers in this study are not employed under the Measures for Securing Employment for Elderly Persons implemented by many organizations and corporations8).
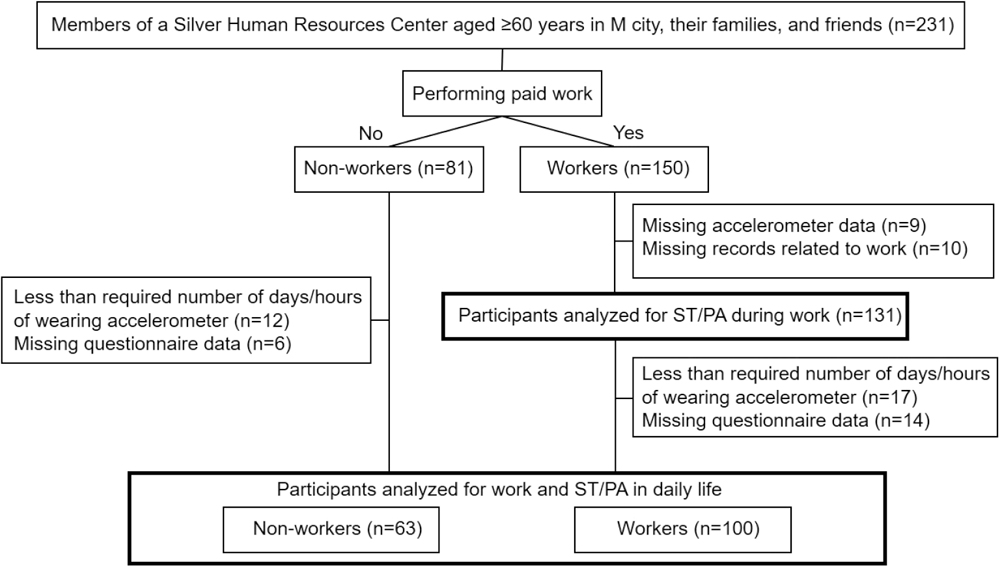
Flowchart for participant selection
PA, Physical activity; ST, sedentary time.
Participants were given explanations covering the purpose of the study, voluntary nature of participation, and risks of measurement in person, and they provided their written informed consent before commencing the study. This study was approved by the Research Ethics Committee of Ehime University Faculty of Collaborative Regional Innovation (201901).
ST and PAST and PA of participants were assessed using a triaxial accelerometer (Active style Pro HJA-750C, Omron Healthcare, Kyoto, Japan), with epoch length set at 60 s. Detailed algorithms and validity of the instrument were reported in previous studies12,13). Participants were instructed to wear their accelerometers from waking up until bedtime for 7 consecutive days. The accelerometer was removed at bedtime and during underwater activities (bathing or swimming). Only those who wore the accelerometer for ≥10 h per day for ≥4 days were included in the analysis of relationship between the presence or absence of work and daily ST and PA, based on a previous study14). The time duration that the device was not worn was defined as at least consecutive 60 min of 0 counts per min15). The valid data of workers included 1 or more working days. Metabolic equivalent of tasks (METs), determined by the accelerometer used in this study, have been shown to be strongly correlated with those measured by indirect calorimetry13). In addition, the validity about gait intensity of the accelerometer has been confirmed in older individuals16). Although the accelerometer may underestimate ST17,18), it has been widely used to evaluate sedentary and PA time among older adults in Japan2,19,20). Intensity of ≤1.5 METs was defined as sedentary behavior, 1.6–2.9 METs as light PA (LPA), and ≥3 METs as moderate-to-vigorous PA (MVPA)21,22). Sedentary behavior accumulated in ≥30 min was defined as long-bout ST, and that accumulated in <30 min as short-bout ST2). MVPA accumulated in <5 min was defined as short-bout MVPA, in 5–9 min as middle-bout MVPA, and in ≥10 min as long-bout MVPA23). Daily mean values for long-bout ST, short-bout ST, LPA, short-bout MVPA, middle-bout MVPA, and long-bout MVPA as well as the number of hours the accelerometer was worn were obtained. Recent PA guidelines have recognized the health benefit of sporadic MVPA as well as continued MVPA for >10 min per activity4,5). With regard to sedentary behavior, the relation between duration of sedentary bouts and health risks remains unclear24). For examining the relationship between work and ST/PA thoroughly, we also used bout-specific ST and MVPA in analysis.
Recording sheets were distributed to workers who were asked to record the time of starting and ending work and breaks during that time on an arbitrary day that they worked in the 7-day period when they wore the accelerometer. Based on these records, ST, LPA, and MVPA during actual working hours (i.e., excluding breaks) were calculated. As the participants worked for different hours, the activity time during work (minutes) was presented as the hourly activity time (minutes), calculated by dividing various activity times (minutes) by work hours (hours).
Questionnaire surveySelf-administered questionnaires were used to survey participants’ age, sex, height, weight, residence status, highest educational qualification, medication status, self-rated health status, and exercise habits. Body mass index (BMI) was calculated from the obtained data on height and weight. To answer the question on residence status, participants were asked to list the number of people they lived with and for medication status, they were asked whether they took prescribed medicines. The question on self-rated health status asked participants to rate their current health status by selecting one of the five options: very good, good, not bad, not good, and bad. Regarding exercise habit, participants were asked whether they practiced ≥60 total minutes of exercise in a week. Participants who worked were asked to classify their employment classification according to the Japan Standard Occupational Classification25) and the number of hours they worked per week in addition to the items above.
Statistical analysisThe means of data on non-workers and workers were compared with independent t-test, and proportions were compared with chi-squared test. ST and PA during work are presented as means±standard deviation (SD) and minimum and maximum values for the total sample and for each occupational classification. The Japan Standard Occupational Classification25) classifies occupations into the following 11 categories: administrative and managerial, professional and engineering, clerical, sales, service, security, agriculture, forestry and fishery, manufacturing process, transport and machine operation, construction and mining, and carrying, cleaning, packaging, and related workers. The following occupations (administrative and managerial [n=4], sales [n=1], security [n=3], and transport and machine operation workers [n=4]) were represented by few participants in our sample. Therefore, with the cooperation of a staff member of the M City Silver Human Resources Center, the similarities between the specific components of these job types were investigated. For the purpose of our analysis, administrative and managerial workers were classified as “clerical workers,” sales and security workers were classified as “service workers,” and transport and machine operation workers were classified as “carrying, cleaning, packaging, and related workers.” One-way analysis of variance was used to compare ST/PA during work by occupational classification.
Analysis of covariance was performed with work (yes/no) as the independent variable and ST/PA as the dependent variable to investigate the relationship between work and ST/PA in daily life. Given that workers did not all work for the same number of hours, they were divided into the group that worked long and short hours at the cut-off value of 14 hours, which was the median number of hours worked per week. That is, the independent variable was divided into three groups: non-workers, short-time workers and long-time workers. Sex (male/female), age (continuous variable), BMI (continuous variable) residence status (living alone/living with someone), highest educational qualification (high school graduate or lower/education past high school), medication status (use/non-use), self-rated health status (“not bad” or better/“not good” or worse), exercise habit (presence/absence), and number of hours that the accelerometer was worn for (continuous variable) were entered into the model as dependent variables.
The workers were further divided into white-collar workers and blue-collar workers. With the cooperation of the staff at the M City Silver Human Resources Center, administrative and managerial workers, clerical workers, professional and technical workers, sales workers, service workers, and security workers were classified as white-collar workers, and agriculture, forestry and fishery workers, manufacturing process workers, construction and mining workers, transport and machine operation workers, and carrying, cleaning, and related workers were classified as blue-collar workers. Those who only white-collar or blue-collar worker were extracted for an analysis of covariance in comparison with the ST/PA of non-workers.
IBM SPSS Statistics Version 25 (IBM Corp, Armonk, NY, USA) was used for all statistical analysis and p<0.05 was considered statistically significant.
The characteristics of the participants are presented in Table 1. The mean age of workers was 71.6±4.8 years, and they worked for 16.5±15.3 hours weekly. Compared to non-workers, workers were more likely to be males and to have attained education past high school. Approximately 90% of both workers and non-workers self-rated their health status as “not bad” or better.
| Non-workers | Workers | p | |||||||
|---|---|---|---|---|---|---|---|---|---|
| n | Mean (SD) or n, % | n | Mean (SD) or n, % | ||||||
| Age, years | 63 | 71.5 | (5.4) | 131 | 71.6 | (4.8) | .925 | ||
| Sex | |||||||||
| Male | 63 | 12 | 19.0 | 131 | 52 | 39.7 | .004 | ||
| Female | 51 | 81.0 | 79 | 60.3 | |||||
| Height, cm | 63 | 155.9 | (6.2) | 129 | 157.2 | (8.5) | .238 | ||
| Weight, kg | 63 | 54.1 | (7.8) | 128 | 55.2 | (8.9) | .413 | ||
| BMI, kg/m2 | 63 | 22.2 | (2.7) | 128 | 22.3 | (2.5) | .952 | ||
| Residence status | |||||||||
| Living alone | 63 | 13 | 20.6 | 129 | 35 | 27.1 | .329 | ||
| Living with someone | 50 | 79.4 | 94 | 72.9 | |||||
| Highest educational qualification | |||||||||
| Education past high school | 63 | 18 | 28.6 | 128 | 61 | 47.7 | .012 | ||
| High school graduate or lower | 45 | 71.4 | 67 | 52.3 | |||||
| Medication status | |||||||||
| Non-use | 63 | 19 | 30.2 | 128 | 35 | 27.3 | .685 | ||
| Use | 44 | 69.8 | 93 | 72.7 | |||||
| Self-rated health | |||||||||
| Very good/Good/Not bad | 63 | 58 | 92.1 | 128 | 117 | 91.4 | .877 | ||
| Not good/Bad | 5 | 7.9 | 11 | 8.6 | |||||
| Working time, hours/week | – | 119 | 16.5 | (15.3) | |||||
| Exercise habit | |||||||||
| Presence | 63 | 34 | 54.0 | 121 | 63 | 52.7 | .806 | ||
| Absence | 29 | 46.0 | 58 | 47.9 | |||||
| Physical activity | |||||||||
| Total-ST, min/day | 63 | 488.0 | (139.6) | 100 | 451.2 | (137.7) | .100 | ||
| Long-bout (≥30 min) ST, min/day | 63 | 198.5 | (126.8) | 100 | 176.1 | (100.0) | .212 | ||
| Short-bout (<30 min) ST, min/day | 63 | 289.5 | (58.3) | 100 | 275.1 | (73.4) | .189 | ||
| Total LPA, min/day | 63 | 360.5 | (89.8) | 100 | 375.2 | (93.6) | .325 | ||
| Total-MVPA, min/day | 63 | 46.9 | (30.8) | 100 | 59.0 | (35.8) | .028 | ||
| Short-bout (1–4 min) MVPA, min/day | 63 | 30.4 | (19.7) | 100 | 39.7 | (21.9) | .007 | ||
| Middle-bout (5–9 min) MVPA, min/day | 63 | 5.5 | (5.3) | 100 | 9.4 | (8.2) | .001 | ||
| Long-bout (≥10 min) MVPA, min/day | 63 | 11.0 | (15.4) | 100 | 9.9 | (13.5) | .644 | ||
| Duration for which the accelerometer was worn, min/day | 63 | 895.5 | (121.2) | 100 | 888.5 | (128.7) | .621 | ||
BMI, body mass index; LPA, light physical activity; MVPA, moderate-to-vigorous physical activity; SD, standard deviation; ST, sedentary time.
ST and PA during work are presented in Table 2. ST, LPA, and MVPA of all participants were 15.1±15.1 min, 37.3±13.3 min, and 7.5±8.6 min and accounted for 25.1%, 62.1%, and 12.5% of their work hours, respectively. There were significant differences between occupational classifications for all of the parameters, ST, LPA, and MVPA. ST was longest in administrative and managerial/clerical workers. LPA was shortest among administrative and managerial/clerical workers whereas these values were similar among the other occupation classifications. MVPA was relatively longer in construction and mining workers. Regardless of occupational classification, large ranges (minimum–maximum values) were observed for ST, LPA, and MVPA.
| ST (min/hour) | LPA (min/hour) | MVPA (min/hour) | ||||||||||||
|---|---|---|---|---|---|---|---|---|---|---|---|---|---|---|
| n | Mean | SD | Min | Max | Mean | SD | Min | Max | Mean | SD | Min | Max | ||
| All participants | 131 | 15.1 | 15.1 | 0.0 | 52.4 | 37.3 | 13.3 | 7.1 | 57.0 | 7.5 | 8.6 | 0.0 | 47.9 | |
| Occupational classification | ||||||||||||||
| Administrative and managerial workers/Clerical workers | 16 | 35.4 | 16.0 | 0.0 | 52.4 | 23.2 | 15.6 | 7.5 | 56.9 | 1.4 | 1.4 | 0.0 | 5.5 | |
| Professional and technical workers | 16 | 21.1 | 15.5 | 5.5 | 51.8 | 35.3 | 13.4 | 7.1 | 50.0 | 3.6 | 3.5 | 0.0 | 13.4 | |
| Sales workers/Service workers/Security workers | 37 | 12.2 | 12.4 | 0.0 | 50.9 | 41.5 | 10.8 | 8.6 | 57.0 | 6.3 | 6.2 | 0.2 | 24.6 | |
| Agriculture, forestry, and fishery workers | 15 | 12.0 | 10.2 | 1.0 | 39.6 | 40.2 | 8.5 | 19.8 | 53.0 | 7.8 | 6.5 | 0.2 | 20.2 | |
| Manufacturing process workers | 6 | 13.8 | 13.9 | 2.3 | 33.8 | 42.5 | 12.4 | 24.8 | 52.8 | 3.7 | 3.0 | 1.4 | 8.6 | |
| Construction and mining workers | 14 | 8.1 | 11.8 | 1.0 | 46.0 | 36.7 | 12.9 | 10.1 | 55.3 | 15.3 | 12.3 | 0.8 | 47.9 | |
| Transport and machine operation workers /Carrying, cleaning, and related workers | 27 | 9.3 | 11.3 | 0.0 | 40.8 | 38.8 | 12.6 | 7.9 | 54.0 | 11.9 | 10.8 | 0.3 | 44.6 | |
| p<.001 | p=.004 | p<.001 | ||||||||||||
LPA, light physical activity; MVPA, moderate-to-vigorous physical activity; SD, standard deviation; ST, sedentary time.
ST/PA of non-workers, short-time workers, and long-time workers are presented in Table 3. Measured ST values were shortest for non-workers, short-time workers, and long-time workers, in that order, whereas total-ST and short-bout ST were significantly shorter in long-time workers than in non-workers. Excluding long-bout MVPA, measured LPA and MVPA were longest in non-workers, short-time workers, and long-time workers, in order, whereas total-LPA, short-bout MVPA, and middle-bout MVPA were significantly longer in long-time workers than non-workers.
| Non-workers (n=63) | Short-time workers (n=53) | Long-time workers (n=47) | p | |||||
|---|---|---|---|---|---|---|---|---|
| Estimate | SE | Estimate | SE | Estimate | SE | |||
| Total-ST, min/day | 489.9 | 13.2 | 473.7 | 14.5 | 423.4 | 16.1* | .009 | |
| Long-bout (≥30 min) ST, min/day | 200.5 | 11.9 | 182.6 | 13.0 | 166.2 | 14.5 | .201 | |
| Short-bout (<30 min) ST, min/day | 289.5 | 7.9 | 291.1 | 8.6 | 257.2 | 9.6* | .021 | |
| Total-LPA, min/day | 352.5 | 11.0 | 359.6 | 12.0 | 403.5 | 13.4* | .014 | |
| Total-MVPA, min/day | 46.9 | 4.3 | 55.9 | 4.7 | 62.4 | 5.3 | .081 | |
| Short-bout (1–4 min) MVPA, min/day | 29.7 | 2.7 | 37.5 | 3.0 | 43.2 | 3.3* | .008 | |
| Middle-bout (5–9 min) MVPA, min/day | 5.5 | 0.9 | 8.8 | 1.0 | 10.0 | 1.1* | .006 | |
| Long-bout (≥10 min) MVPA, min/day | 11.8 | 1.8 | 9.7 | 1.9 | 9.1 | 2.2 | .581 | |
LPA, light physical activity; MVPA, moderate-to-vigorous physical activity; SE, standard error; ST, sedentary time.
Asterisks indicate significant difference from the non-workers.
Adjusted for sex (male/female), age (continuous variable), body mass index (continuous variable), final educational attainment (high school graduate or below, education past high school), residence status (living alone/living with someone), medication status (use/non-use), self-rated health (very good, good, not bad/not good, bad), exercise habit (presence/absence), and duration for which the accelerometer was worn (continuous variable)
In the analyses comparing non-workers with blue-collar workers, the measured STs tended to be shorter in the order of long-time workers, short-time workers, and non-workers, whereas the measured LPA tended to be longer (in the same order) (Table 4). Total-ST was significantly shorter in long-time workers than in non-workers. Moreover, short-bout ST was significantly shorter in long-time workers than in non-workers. Total LPA was significantly longer in long-time-workers than in non-workers. Short-bout MVPA and middle-bout MVPA were longer in short-time and long-time workers than in non-workers.
| Non-workers (n=63) | Short-time workers (n=17) | Long-time workers (n=27) | p | |||||
|---|---|---|---|---|---|---|---|---|
| Estimate | SE | Estimate | SE | Estimate | SE | |||
| Total-ST, min/day | 487.7 | 13.7 | 433.9 | 25.6 | 401.3 | 22.5* | .006 | |
| Long-bout (≥30 min) ST, min/day | 200.8 | 12.4 | 156.7 | 23.1 | 152.7 | 20.4 | .082 | |
| Short-bout (<30 min) ST, min/day | 286.9 | 7.4 | 277.3 | 13.9 | 248.5 | 12.3* | .045 | |
| Total-LPA, min/day | 346.7 | 11.4 | 379.9 | 21.3 | 419.3 | 18.8* | .008 | |
| Total-MVPA, min/day | 47.3 | 4.6 | 67.9 | 8.5 | 61.2 | 7.5 | .068 | |
| Short-bout (1–4 min) MVPA, min/day | 29.8 | 2.9 | 42.3 | 5.4* | 43.4 | 4.7* | .024 | |
| Middle-bout (5–9 min) MVPA, min/day | 5.5 | 1.0 | 11.6 | 1.8* | 9.7 | 1.6* | .006 | |
| Long-bout (≥10 min) MVPA, min/day | 12.0 | 2.0 | 14.0 | 3.8 | 8.0 | 3.3 | .476 | |
LPA, light physical activity; MVPA, moderate-to-vigorous physical activity; SE, standard error; ST, sedentary time.
Asterisks indicate significant difference from non-workers.
Adjusted for sex (male/female), age (continuous variable), body mass index (continuous variable), final educational qualification (high school graduate or lower/education past high school), residence status (living alone/living with someone), medication status (use/non-use), self-rated health (very good, good, not bad/not good, bad), exercise habit (presence/absence), and duration for which the accelerometer was worn (continuous variable)
In the analyses comparing non-workers with white-collar workers, the measured STs were shortest in the long-time workers whereas the measured LPA and MVPA were longest in the long-time workers (Table 5). Middle-bout MVPA was significantly longer in long-time workers than in non-workers.
| Non-workers (n=63) | Short-time workers (n=36) | Long-time workers (n=20) | p | |||||
|---|---|---|---|---|---|---|---|---|
| Estimate | SE | Estimate | SE | Estimate | SE | |||
| Total-ST, min/day | 492.8 | 12.4 | 494.1 | 16.5 | 442.5 | 22.6 | .132 | |
| Long-bout (≥30 min) ST, min/day | 201.1 | 12.2 | 194.0 | 16.2 | 176.7 | 22.2 | .640 | |
| Short-bout (<30 min) ST, min/day | 291.7 | 7.8 | 300.1 | 10.3 | 265.8 | 14.1 | .149 | |
| Total-LPA, min/day | 359.7 | 10.4 | 355.7 | 13.8 | 393.9 | 19.0 | .231 | |
| Total-MVPA, min/day | 47.3 | 3.9 | 49.5 | 5.2 | 63.0 | 7.1 | .165 | |
| Short-bout (1–4 min) MVPA, min/day | 30.3 | 2.6 | 35.4 | 3.4 | 42.8 | 4.7 | .078 | |
| Middle-bout (5–9 min) MVPA, min/day | 5.5 | 0.8 | 7.2 | 1.0 | 10.7 | 1.4* | .009 | |
| Long-bout (≥10 min) MVPA, min/day | 11.4 | 1.6 | 7.1 | 2.2 | 9.9 | 3.0 | .288 | |
LPA, light physical activity; MVPA, moderate-to-vigorous physical activity; SE, standard error; ST, sedentary time.
Asterisks indicate significant difference from non-workers.
Adjusted for sex (male/female), age (continuous variable), body mass index (continuous variable), final educational qualification (high school graduate or lower, education past high school), residence status (living alone/living with someone), medication status (use/non-use), self-rated health (very good, good, not bad/not good, bad), exercise habit (presence/absence), and duration for which the accelerometer was worn (continuous variable)
To the best of our knowledge, this is the first study that surveyed ST/PA during work and investigated the relationships between work status and ST/PA in daily life among older adults. ST/PA during work in adults was objectively assessed with an accelerometer to elucidate the differences in these factors by occupational classification. The distribution of ST/PA during work was also demonstrated between individuals in the same occupational classifications. Moreover, we found that blue-collar work, in particular, may contribute to decreasing ST and increasing PA in daily life. In a previous study on Japanese older adults, working in advanced age was reported to decrease the risk of mortality26). This study supports the importance of work from the standpoint of promoting PA and may explain some of the mechanisms of health benefits of work in older adults26).
Several studies have reported on ST/PA during work objectively assessed in subjects of productive age27,28,29,30,31). These studies reported that the proportion of ST out of work hours is greater whereas those of LPA and MVPA are shorter for white-collared workers, such as office workers, than for blue-collar workers, such as workers in manufacturing jobs27,28,29,30,31). Similar trends were observed in this study. However, the mean percentage of ST during work hours was 68.5–82.0% among white-collared workers27,28,29) and 26.5–55.0% among blue-collared workers30,31). Those levels among the participants of this study were even lower (e.g., 59% in administrative and managerial/clerical workers and 13.5% in manufacturing process workers). This difference roots from the differences in measurement methods between this study and previous studies27,28,29,30,31). The majority of the participants in this study were part-time workers, meaning that their individual shifts varied. Therefore, ST/PA during work was calculated based on the start and end times of their shifts and breaks taken in between, as recorded by the participants. In contrast, the majority of participants in previous studies were full-time workers. Though ST/PA were calculated based on individual shift starting and ending times in one study31), the majority of previous studies defined work hours uniformly (e.g., 08:25–17:10)27,28,29,30). Moreover, the hours also included break times during the shifts27,28,29,30,31). Since our study calculated ST/PA only during actual working hours, shorter values of ST may have been obtained than in previous studies. Despite these differences in measurement methods, ST during work of the participants of our study may still be shorter than that in previous studies. This may suggest that, even within the same occupational classifications, the activity levels per units of work hours performed by older adults may be greater than those performed by workers in their productive age.
In this study, workers’ ST/PA levels during daily life were better than those of non-workers. Moreover, their levels were better when their weekly work hours were longer, and this trend was apparent in blue-collar workers. In a previous study on American adults that investigated relationships between work classifications and ST/PA in daily life, objectively assessed with an accelerometer, shorter ST and longer PA were observed in the following order: workers in mainly moderate-intensity jobs, those in mainly low-intensity activity jobs, those in sedentary jobs, and non-workers32). Studies that examined the changes in PA before and after retirement reported that, though PA may increase temporarily after retirement33), overall PA decreases with the loss of occupational PA11). The results of this study may be supported by these results of previous studies11,32). In this study, short-bout MVPA and middle-bout MVPA were also significantly longer in short-time blue-collar workers than in non-workers. The weekly work hours of short-time workers in this study was <14 hours (median, 6 hours). This finding suggests that in older adults, even such very short-bout work, contributes to increasing PA in daily life.
In contrast, we found that the ST/PA levels, except middle-bout MVPA, of white-collar workers were not significantly better than those of non-workers. However, although it did not reach statistically significant levels, long-time workers had shorter ST and longer PA in daily life than non-workers. In a previous large-sample study on American adults, ST in daily life was slightly, but significantly, shorter and PA time was longer in workers in sedentary jobs than in non-workers32). Among older adults, those who left their homes more often had shorter ST in daily life and longer PA time34). Thus, it is plausible that older adults doing long hours of white-collar work in a week (i.e., many days of work) is linked to increased number of outings from home, which contributes to decreasing ST or increasing PA in daily life. Since the sample in this study was relatively small, it is possible that the statistical detecting power was not sufficient, warranting a larger sample size for future studies.
In order to do an activity, time for other activities must be decreased, as there are only 24 hours in a day. According to an analysis that accounted for such interdependence, replacing 30 min of ST a day with LPA decreased mortality risk by 14%, whereas replacing the same duration of ST with MVPA decreased mortality risk by 50%35). Given the outcomes of such studies35), the difference observed in ST/PA between workers and non-workers, particularly blue-collar workers, may be of clinical significance. Values of long-bout MVPA in workers were not higher than those in non-workers in this study. Although it has been recommended to continue MVPA for at least 10 min per session, recent PA guidelines no longer mentioned per-session durations4,5). This is because associations were observed between health outcomes and PA less than 10 min as well as PA longer than 10 min in a review of studies related to PA duration and health outcomes4,5). Considering this information, our finding of the long-bout MVPA of workers not being longer than that of non-workers may not be a problem with respect to health benefits.
This study had several limitations, and various points need to be kept in mind when interpreting the results. First, as this was a cross-sectional study, we cannot explain causal relationships. Therefore, it is possible that the direction of the causal relationship assumed by the authors (i.e., work contributes to maintaining and increasing PA) may actually be reversed (people with high PA are more likely to work). Thus, a future longitudinal study is warranted to explain this relationship. Second, caution is required about the generalization of our study outcomes related to ST/PA during work. Since the participants represent a convenience sample, they may represent individuals with particularly positive attitudes about work or PA. In particular, ST/PA during work in this study may be under-/over-estimated. Moreover, this study classified occupations broadly according to the Japan Standard Occupational Classification25), which means that the categories include various tasks and responsibilities. Thus, this within-job category diversity may have resulted in the major individual differences observed in ST/PA during work in this study, and ST/PA during work may need to be studied in more detail by selecting participants using specific occupational bases displayed in smaller categories and subcategories. The third point is concerning generalization of study outcomes on the relationship between work and ST/PA. The participants in this study were members of a Silver Human Resources Center and their acquaintances or families and may not be a sample that represents the general population of Japanese older adults. Thus, our outcomes may not necessarily apply to the general older adult population and may only be generalizable to healthy older adults. Although our study had the limitations described above, to the best of our knowledge, this is the first study that investigated the relationships between work and objectively assessed ST/PA in older adults that suggested the validity of new views on work for promoting PA in older adults and provided basic data for further research on the topic.
This study used accelerometers to objectively assess ST/PA during work in members of a Silver Human Resources Center and their family and friends. Furthermore, it investigated the association between work and ST/PA in daily life and revealed the potential contribution of work, particularly blue-collar work, in decreasing ST and increasing PA.
The authors thank the study participants and the staff of Silver Human Resources Center in City M for assistance with data collection. This research was funded by JSPS KAKENHI, grant number 19K11599.
NY and YH designed the study. NY and HA collected the data. NY and HA analyzed the data. NY wrote the paper. HA and YH contributed to the discussion and reviewed/edited the paper. All of the authors have given final approval.
The authors declare that there are no conflicts of interest.
This research was funded by JSPS KAKENHI, grant number 19K11599.