Abstract
Objectives: Metabolic syndrome (MS) is a significant health concern in the working-age population. Since 2008, Japan has mandated health insurers to implement Specific Health Checkups to identify individuals with MS and preliminary groups, making Specific Health Guidance (SHG) compulsory for these groups. People receiving SHG multiple times is increasing as it is conducted as an annual public program. Therefore, we evaluated the influence of a health guidance history on the effectiveness of subsequent guidance. Methods: Using data from 10,191 participants in the 2017 Motivational Health Guidance (a type of SHG involving a single session), this longitudinal study assessed the changes in health checkup findings from 2017 to 2018. Participants were categorized based on their previous year’s (2016) SHG eligibility and participation: Group 1 (n=3,903) met the 2016 SHG criteria and participated, Group 2 (n=2,305) met the criteria but did not participate, and Group 3 (n=3,983) had no MS risk factors and did not need to participate in the 2016 SHG. Results: The entire cohort and Groups 2 and 3 exhibited significant weight loss after 1 year. Group 1 showed a significant negative association, with a 3% (odds ratio [OR] 0.64; 95% confidence interval [CI], 0.55–0.75) and 5% body weight loss (OR 0.66; 95% CI, 0.54–0.81) than Group 3. Men in Group 1 showed a significant association with new-onset MS (OR 2.56; 95% CI, 1.93–3.40). Conclusions: The findings suggest that participants with a history of health guidance in the previous year may have low rates of achieving weight loss and a high incidence of new-onset MS after 1 year.
Introduction
Metabolic syndrome (MS) is a significant health concern among the working-age population because of its high prevalence and its association with serious health risks such as cardiovascular diseases and diabetes1,2,3). To protect the health of mainly working-age people, the Japanese Ministry of Health, Labour and Welfare (MHLW) initiated a novel system in 2008 mandating health insurers to implement Specific Health Checkups (SHC) and Specific Health Guidance (SHG) for individuals with MS and preliminary risk4,5,6). SHC are conducted in a manner that aligns with occupational health checkups mandated by law for employed individuals, ensuring coherence in itemization and enabling health insurers to access occupational health checkup data7). Those who met the criteria for abdominal obesity and risk factors for atherosclerotic diseases are subjected to lifestyle intervention and follow-up by health care professionals through the SHG program. The SHG, which focuses on MS, offers advice for enhancing lifestyle, with body weight used as an efficacy indicator.
The SHG program in Japan considers the following two forms: Intensive Health Guidance and Motivational Health Guidance. Intensive Health Guidance provides initial counseling and continuous follow-up for those diagnosed with MS. Motivational Health Guidance comprises a single health guidance session for those with pre-MS, with over 2 million people targeted and 700,000 participants each year8). In the context of occupational health, there are initiatives to increase the implementation rate of SHG to promote Health and Productivity Management for the company. This highlights the significant demand for SHG to be conducted effectively and efficiently. In particular, Motivational Health Guidance can reduce time and economic costs for providers and participants. Although several studies have explored the outcomes of Intensive Health Guidance9,10), research specifically analyzing the impacts of the Motivational Health Guidance alone is limited. Considering the higher incidence of cardiovascular diseases among those eligible for Motivational Health Guidance compared with the general population11), and the brief nature of these interventions, it is crucial to identify factors that might limit their effectiveness.
According to healthcare professionals on the front lines of health guidance, participants who repeatedly participate in health guidance programs may be less likely to benefit from them. Although guidance itself has been reported to have an improvement effect12,13,14), it is unclear whether the same effect is achieved by participants receiving continuous guidance. Reports on the effectiveness of repeated annual participation in lifestyle prevention programs, such as SHG, are lacking to date. Considering the need to efficiently use the limited resources of health insurers and employing companies that implement health guidance, selectively focusing on individuals likely to benefit from the interventions is crucial. Simultaneously, it is necessary to consider strategies to address factors that reduce the effectiveness of health guidance.
Therefore, we conducted a cohort study targeting the working-age populations who received Motivational Health Guidance, focusing on the history of health guidance as a potential factor that influences the effectiveness of health guidance in weight loss and the prevention of new-onset MS.
Methods
Study design
This population-based longitudinal observational study utilized a large-scale database obtained from 22 health insurers, including the Japan Health Insurance Association, Mutual Aid Associations for Municipal Personnel, and National Health Insurance Associations in Japan, that contained data on individuals who participated in SHC between 2016 and 2018.
In this study, we evaluated the effects of SHG history in the previous year on weight loss and new-onset MS in individuals who completed the Motivational Health Guidance program in 2017 (Figure 1). The changes in health checkup results from 2017 to 2018 were evaluated, and the individuals were divided into three groups according to their eligibility and participation in the previous year’s (2016) SHG. The SHG was conducted as part of a public undertaking; the present study is not a clinical trial.

Fig. 1. Study participants and outcomes. Group 1 satisfied the SHG criteria in 2016 and participated in the 2016 SHG. Group 2 satisfied the SHG criteria in 2016 but did not participate in the 2016 SHG. Group 3 did not satisfy the SHG criteria in 2016 and did not need to participate in the 2016 SHG. SHG, Specific Health Guidance.
This research was conducted in compliance with the guidelines stipulated in the Declaration of Helsinki, and the study protocol was approved by the local Ethics Committee of Kagawa Nutrition University (No. 304) and the Ethics Committee of Nagoya University Graduate School of Medicine (No. 2020-0355). The requirement for obtaining written informed consent from the patients was waived because of the retrospective and anonymized nature of the study.
Motivational health guidance
The details regarding SHC and SHG were described previously5,13). Individuals undergoing checkups are classified according to obesity indicators (waist circumference [WC] and body mass index [BMI]) and the number of additional metabolic risk factors (fasting plasma glucose [FPG] ≥100 mg/dL or glycated hemoglobin [HbA1c] ≥5.6%, triglycerides ≥150 mg/dL or high-density lipoprotein [HDL] cholesterol <40 mg/dL, systolic blood pressure [SBP] ≥130 mm Hg, or diastolic blood pressure [DBP] ≥85 mm Hg, and smoking), with high-risk individuals being eligible for SHG. The Motivational Health Guidance was offered to those with one risk factor with abdominal obesity (WC ≥85 and ≥90 cm for men and women, respectively) or with one or two risk factors with overweight (BMI ≥25 kg/m2) but without abdominal obesity13). Individuals receiving pharmacological therapy for diabetes, hypertension, or dyslipidemia were excluded from the health guidance program. The Motivational Health Guidance program includes initial counseling and a final evaluation after 3 or 6 months. A trained healthcare professional (physician, nurse, or dietitian) who has completed the established MHLW training course provides counseling. The providers of health guidance in this study comprised registered dietitians (n=5,667, 55.6%), public health nurses (n=4,125, 40.5%), nurses (n=397, 3.9%), and physicians (n=2, 0.0%), who were affiliated with health checkup institutions and employing companies.
Population
Data on individuals aged 40–64 years who completed the Motivational Health Guidance program in 2017 and who had undergone SHC in the previous year (2016) and next fiscal year (2018) were collected from 22 health insurers. We then divided the individuals into the following three groups according to their history (previous year) of SHG: Group 1, satisfied the criteria for the SHG (including Intensive Health Guidance and Motivational Health Guidance) in 2016 and participated in the 2016 SHG; Group 2, satisfied the criteria for the SHG in 2016 but did not participate in the 2016 SHG; and Group 3, did not satisfy the criteria for the SHG in 2016 and did not need to participate in the 2016 SHG. Considering the importance of the initial interview, those who participated in any part of the 2016 SHG were included in Group 1. In the evaluation of new-onset MS, we excluded individuals who had been diagnosed with MS in 2017 or those with missing values on MS diagnosis.
Measurements
SHC included physical examinations, anthropometric measurements, laboratory tests, and questionnaires (including a history of present and past illnesses, a medication history, information regarding lifestyle, and transtheoretical model of behavior change). Details of the questionnaire are shown in eTable 1. BMI was calculated as weight (kg) divided by height squared (m2). WC was measured at the umbilical level. Heavy drinking was defined as drinking alcohol daily with an alcohol intake of ≥40 g/day, drinking alcohol occasionally with an alcohol intake of ≥60 g/day. Physical activity was defined as engaging in at least 1 hour of walking or equivalent physical activity per day. Eating speed was classified according to whether or not the individual ate faster than others. Eating dinner late was defined as consuming dinner within 2 hours of bedtime at least thrice weekly. Sleeping condition was classified according to the individuals’ answers to the question regarding whether they were getting enough rest from sleep. The transtheoretical model of behavior change was categorized into the following five stages: (1) precontemplation, (2) contemplation, (3) preparation, (4) action, and (5) maintenance15,16).
Outcome assessment
The body weight target was set at a weight loss of ≥3% as the minimum weight reduction required for the improvement of obesity-related risk factors or conditions was reported to be 3% among Japanese17). Moreover, we assessed the achievement of a weight loss of ≥5% as a weight loss of 5% can promote improvement of arteriosclerosis-related risk factors18,19). MS was diagnosed according to the Japanese criteria of the Japanese Society of Internal Medicine20,21) and National Cholesterol Education Program Adult Treatment Panel III (NCEP-ATP III)22).
Statistical analysis
To characterize the participants at baseline (2017), continuous variables were described as mean and standard deviation (SD), whereas categorical variables were reported as frequency (%). Changes in clinical indicators were expressed as means and standard error (SE) and were compared using the Wilcoxon signed-rank test. For intergroup comparisons, continuous variables were analyzed using one-way analysis of variance followed by the Games–Howell method, whereas nominal variables were analyzed using the Z-test. Univariate and multivariate logistic regression analyses were performed to examine the relationship between the SHG status groups and outcomes (3% and 5% body weight loss, new-onset MS according to the Japanese and NCEP-ATP III criteria) after 1 year. In model 1, univariate logistic regression was performed. In model 2, age, sex, and BMI were used as covariates. In model 3, the covariates were age, sex, BMI, rate of BMI change from 2016 to baseline (2017), smoking status, heavy drinking status, physical activity, eating speed, eating dinner late, sleeping condition, and transtheoretical model of behavior change stage. The results of the regression analyses are presented as estimated odds ratios (ORs) with corresponding 95% confidence intervals (CIs). Similarly, a subgroup analysis was performed. The subgroups were stratified according to age (<50, ≥50 to <60, and ≥60 years), BMI (<25, ≥25 to <27.5, and ≥27.5 kg/m2), and transtheoretical model of behavior change stage (precontemplation, contemplation and preparation, and action and maintenance). All analyses were performed using SPSS Statistics version 28 (IBM Corp., Armonk, NY, USA), with p-values <0.05 indicating statistical significance.
Results
Grouping
Based on the database of 679,284 individuals who participated in SHC between 2016 and 2018 from 22 health insurers, 11,904 individuals participated in the Motivational Health Guidance in 2017 and had SHG status in 2016. After excluding individuals with insufficient or missing data and those who did not undergo SHC in 2018, 10,191 individuals were included in the final data analysis. Among them, Group 1 comprised 3,903 individuals who satisfied the SHG criteria in 2016 and participated in the 2016 SHG, Group 2 comprised 2,305 individuals who satisfied the same criteria but did not participate in the 2016 SHG, and Group 3 comprised 3,983 individuals who did not satisfy the same criteria and did not need to participate in the 2016 SHG (Figure 2).
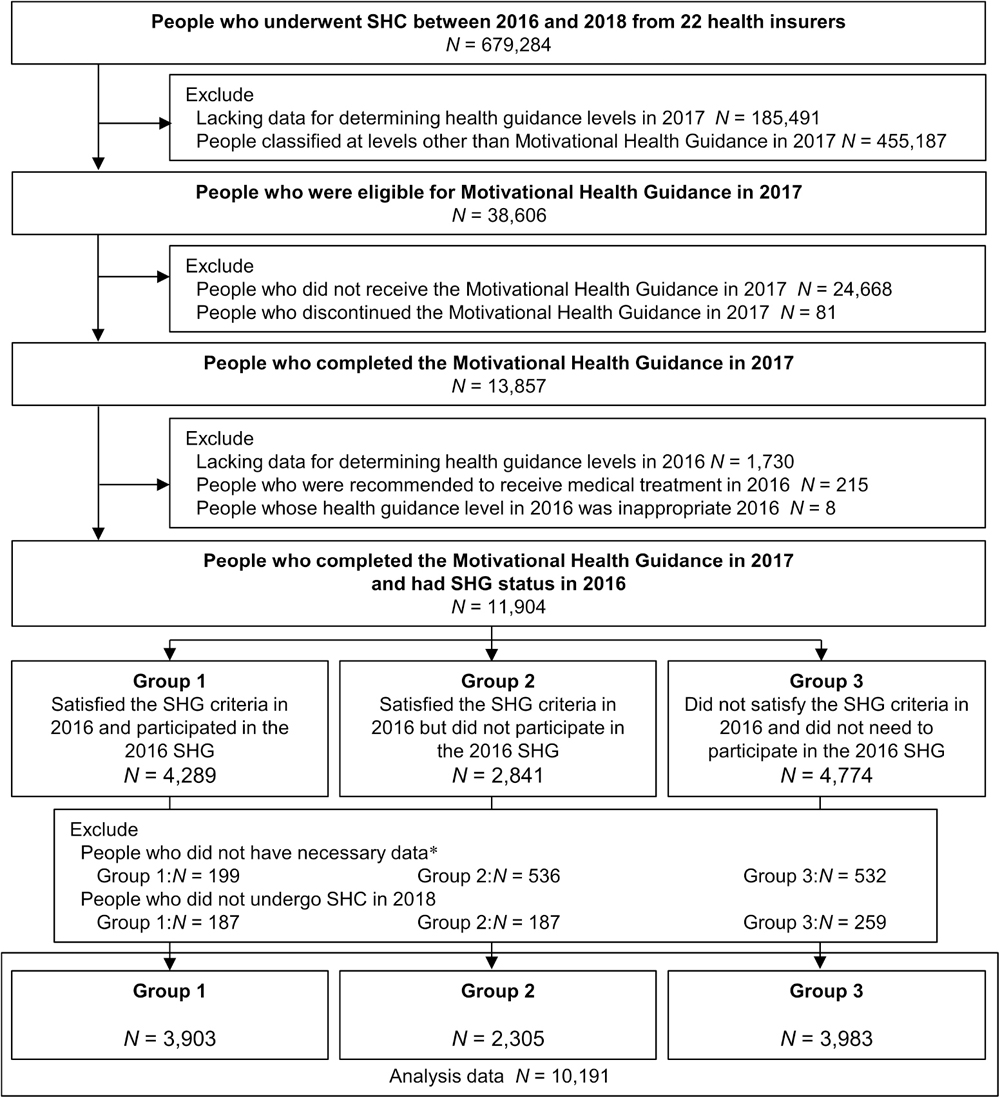
Fig. 2. Flowchart of the study population. *Necessary data mean WC, SBP, DBP, TG, HDL-C, BMI, HbA1c, medication history, and smoking status for 2016 and 2017. BMI, body mass index; DBP, diastolic blood pressure; HbA1c, glycated hemoglobin; HDL-C, high-density-lipoprotein cholesterol; SBP, systolic blood pressure; SHC, Specific Health Checkups; SHG, Specific Health Guidance; TG, triglyceride; WC, waist circumference.
Table 1 shows the participants’ baseline (2017) characteristics stratified according to the SHG status in 2016. Groups 1 and 2 had a higher percentage of men and greater body weight, WC, BMI, SBP, DBP, and FPG, HbA1c, and triglyceride levels; had a lower HDL cholesterol level and percentage of current smokers; and were more likely to have a higher transtheoretical model of behavior change stage than Group 3. For the change in BMI from 2016 to baseline (2017), Group 3 (+0.6 [SD, 0.8] kg/m2) had the greatest change, followed by Group 2 (+0.1 [SD, 0.9] kg/m2) and then Group 1 (−0.1 [SD, 0.9] kg/m2).
Table 1. Baseline characteristics of the study participants stratified according to the SHG status in 2016
| Total | Group 1 | Group 2 | Group 3 |
|---|
| N=10,191 | N=3,903 | N=2,305 | N=3,983 |
|---|
| Age, years | 49.8 (6.1) | 49.8 (6.1) | 50.1 (6.2) | 49.5 (6.0) |
| Woman | 1,587/10,191 (15.6%) | 506/3,903 (13.0%) | 359/2,305 (15.6%) | 722/3,983 (18.1%) |
| Body weight, kg | 75.1 (8.8) | 76.5 (9.1) | 76.6 (9.1) | 72.8 (7.7) |
| WC, cm | 89.8 (6.4) | 90.7 (6.8) | 91.1 (6.7) | 88.1 (5.4) |
| BMI, kg/m2 | 26.2 (2.5) | 26.6 (2.6) | 26.7 (2.6) | 25.5 (2.2) |
| SBP, mm Hg | 126.3 (13.1) | 127.0 (13.3) | 127.8 (14.1) | 124.8 (12.1) |
| DBP, mm Hg | 79.9 (10.0) | 80.6 (10.0) | 81.0 (10.4) | 78.5 (9.4) |
| FPG, mg/dL | 96.4 (10.7) | 96.7 (11.5) | 97.5 (11.1) | 95.3 (9.6) |
| HbA1c, % | 5.5 (0.4) | 5.6 (0.4) | 5.6 (0.4) | 5.5 (0.3) |
| Triglyceride, mg/dL | 131.1 (84.7) | 135.0 (93.1) | 132.7 (82.9) | 126.4 (76.6) |
| HDL cholesterol, mg/dL | 57.1 (13.6) | 56.2 (13.5) | 56.5 (13.7) | 58.5 (13.4) |
| LDL cholesterol, mg/dL | 131.0 (28.3) | 131.3 (28.4) | 132.1 (28.4) | 130.1 (28.2) |
| Current smoker | 420/10,191 (4.1%) | 147/3,903 (3.8%) | 64/2,350 (2.8%) | 209/3,983 (5.2%) |
| Transtheoretical model | | | | |
| Precontemplation | 1,520/8,195 (18.5%) | 502/2,997 (16.8%) | 345/1,941 (17.8%) | 673/3,257 (20.7%) |
| Contemplation | 3,061/8,195 (37.4%) | 1,038/2,997 (34.6%) | 731/1,941 (37.7%) | 1,292/3,257 (39.7%) |
| Preparation | 1,233/8,195 (15.0%) | 419/2,997 (14.0%) | 319/1,941 (16.4%) | 495/3,257 (15.2%) |
| Action | 1,018/8,195 (12.4%) | 478/2,997 (15.9%) | 249/1,941 (12.8%) | 291/3,257 (8.9%) |
| Maintenance | 1,363/8,195 (16.6%) | 560/2,997 (18.7%) | 297/1,941 (15.3%) | 506/3,257 (15.5%) |
| 2016–2017 BMI change, kg/m2 | 0.2 (0.9) | −0.1 (0.9) | 0.1 (0.9) | 0.6 (0.8) |
BMI, body mass index; DBP, diastolic blood pressure; FPG, fasting plasma glucose; SBP, systolic blood pressure; SHG, Specific Health Guidance; WC, waist circumference.
Data are expressed as mean (standard deviation) or n (%). Group 1 satisfied the SHG criteria in 2016 and participated in the 2016 SHG. Group 2 satisfied the SHG criteria in 2016 but did not participate in the 2016 SHG. Group 3 did not satisfy the SHG criteria in 2016 and did not need to participate in the 2016 SHG.
*Significant difference between groups, p<0.05.
Table 2 shows the changes in clinical indicators from baseline (2017) to the subsequent year (2018) and the percentage of individuals achieving 3% or 5% body weight loss and those with new-onset MS according to the Japanese or NCEP-ATPIII criteria at the subsequent year (2018) in each group. For all individuals and those in Groups 2 and 3, weight, WC, and BMI decreased significantly with participation in the Motivational Health Guidance in 2017. In a year, 23.7% participants of Group 3, 20.1% of Group 2, and 13.7% of Group 1 had 3% of weight loss. Furthermore, for a 5% loss, the rates were 12.0%, 10.1%, and 6.1%, respectively. New-onset MS, per Japanese criteria, was most prevalent in Group 2 (16.4% men, 11.2% women), followed by Group 1 (14.8% men, 5.2% women), and then Group 3 (5.9% men, 3.3% women).
Table 2. Change in the clinical indicators from 2017 to 2018 and the rate of outcome
| Total (N=10,191) | Group 1 (N=3,903) | Group 2 (N=2,305) | Group 3 (N=3,983) | Group 1–2 | Group 1–3 | Group 2–3 |
|---|
| change | p-value | change | p-value | change | p-value | change | p-value | p-value | p-value | p-value |
|---|
| Body weight (kg) | −0.35 (2.84) | <0.001 | 0.07 (2.71) | <0.001 | −0.47 (3.13) | <0.001 | −0.70 (2.74) | <0.001 | <0.001 | <0.001 | 0.010 |
| WC, cm | −0.34 (3.52) | <0.001 | 0.17 (3.37) | <0.001 | −0.38 (3.70) | <0.001 | −0.80 (3.50) | <0.001 | <0.001 | <0.001 | <0.001 |
| BMI (kg/m2) | −0.11 (0.99) | <0.001 | 0.04 (0.93) | <0.001 | −0.14 (1.08) | <0.001 | −0.23 (0.97) | <0.001 | <0.001 | <0.001 | 0.006 |
| SBP (mmHg) | 0.23 (11.52) | 0.047 | 1.20 (11.41) | <0.001 | 0.78 (12.02) | <0.001 | −1.03 (11.23) | <0.001 | 0.373 | <0.001 | <0.001 |
| DBP (mmHg) | 0.24 (8.23) | 0.001 | 0.83 (8.34) | <0.001 | 0.70 (8.30) | <0.001 | −0.62 (8.00) | <0.001 | 0.837 | <0.001 | <0.001 |
| FPG (mg/dL)a | 0.29 (7.90) | 0.016 | 0.94 (7.86) | <0.001 | 0.67 (8.03) | <0.001 | −0.48 (7.79) | 0.001 | 0.587 | <0.001 | <0.001 |
| HbA1c, % | 0.01 (0.21) | <0.001 | 0.02 (0.21) | <0.001 | 0.01 (0.26) | 0.001 | 0.01 (0.17) | 0.003 | 0.158 | 0.006 | 0.961 |
| Triglyceride (mg/dL) | −1.61 (80.96) | <0.001 | 2.69 (85.13) | 0.005 | 1.62 (78.62) | 0.948 | −7.68 (77.66) | <0.001 | 0.870 | <0.001 | <0.001 |
| HDL cholesterol (mg/dL) | 0.40 (7.06) | <0.001 | 0.04 (6.80) | 0.628 | 0.50 (6.88) | 0.002 | 0.70 (7.38) | <0.001 | 0.033 | <0.001 | 0.506 |
| LDL cholesterol (mg/dL) | −0.01 (19.69) | 0.024 | 0.41 (19.36) | 0.003 | −0.04 (19.80) | 0.434 | −0.41 (19.95) | 0.879 | 0.654 | 0.150 | 0.756 |
| 3% body weight reduction | 1,943/10,191 (19.1%) | 535/3,903 (13.7%) | 463/2,305 (20.1%) | 945/3,983 (23.7%) | * | * | * |
| 5% body weight reduction | 946/10,191 (9.3%) | 237/3,903 (6.1%) | 233/2,305 (10.1%) | 476/3,983 (12.0%) | * | * | - |
| men | women | men | women | men | women | men | women | | | |
| Japanese criteria for MS | 538/4,585
(11.7%) | 70/1,242
(5.6%) | 234/1,576
(14.8%) | 20/385
(5.2%) | 119/1,215
(16.4%) | 31/278
(11.2%) | 105/1,794
(5.9%) | 19/579
(3.3%) | men –
women * | men *
women – | men *
women * |
| NCEP-ATP III for MS | 164/4,575
(3.6%) | 115/1,131
(10.2%) | 70/1,566
(4.5%) | 42/343
(12.2%) | 62/1,216
(5.1%) | 36/244
(14.8%) | 32/1,793
(1.8%) | 37/544
(6.8%) | men –
women – | men *
women * | men *
women * |
| Percentage of those taking medication | 408/10,191 (4.0%) | 160/3,903 (4.1%) | 128/2,305 (5.5%) | 120/3,983 (3.0%) | * | * | * |
BMI, body mass index; DBP, diastolic blood pressure; FPG, fasting plasma glucose; MS, metabolic syndrome; SBP, systolic blood pressure; SHG, Specific Health Guidance; WC, waist circumference.
Data are expressed as mean (standard error) or n (%). Group 1 satisfied the SHG criteria in 2016 and participated in the 2016 SHG. Group 2 satisfied the SHG criteria in 2016 but did not participate in the 2016 SHG. Group 3 did not satisfy the SHG criteria in 2016 and did not need to participate in the 2016 SHG.
a FPG was calculated in individuals with no missing FPG data for 2018 (Total
N=5,832, Group 1 n=1,962, Group 2 n=1,496, Group 3 n=2,374).
* Significant difference between groups,
p<0.05. For MS, intergroup comparisons were conducted separately for men and women.
Table 3 shows the logistic regression analysis results for the 3% and 5% body weight loss after 1 year. Compared with Group 3, Group 1 showed a significant negative association with a 3% body weight loss in total (OR 0.64; 95% CI, 0.55–0.75, model 3) and men (OR 0.61; 95% CI, 0.52–0.72, model 3). Group 1 also showed a significant negative association with a 5% body weight loss in total (OR 0.66; 95% CI, 0.54–0.81, model 3) and men (OR 0.66; 95% CI, 0.52–0.83) compared with Group 3. Group 2 showed no significant association with a 3% or 5% body weight loss in the multivariable analysis (model 3) compared with Group 3.
Table 3. Association between the SHG status in 2016 and body weight loss after 1 year
| | Model 1 | Model 2 | Model 3 |
|---|
| OR (95%CI) | p-value | OR (95%CI) | p-value | OR (95%CI) | p-value |
|---|
| 3% body weight reduction | | | | | | | |
| Total | N | 10,191 | | 10,191 | | 7,746 | |
| Group 3 | Reference | | Reference | | Reference | |
| Group 1 | 0.51 (0.45–0.57) | <0.001 | 0.51 (0.46–0.58) | <0.001 | 0.64 (0.55–0.75) | <0.001 |
| Group 2 | 0.81 (0.71–0.92) | 0.001 | 0.82 (0.72–0.93) | 0.002 | 0.99 (0.85–1.16) | 0.916 |
| Men | N | 8,604 | | 8,604 | | 6,364 | |
| Group 3 | Reference | | Reference | | Reference | |
| Group 1 | 0.49 (0.43–0.56) | <0.001 | 0.50 (0.43–0.56) | <0.001 | 0.61 (0.52–0.72) | <0.001 |
| Group 2 | 0.81 (0.70–0.93) | 0.002 | 0.82 (0.71–0.94) | 0.005 | 1.02 (0.86–1.21) | 0.820 |
| Women | N | 1,587 | | 1,587 | | 1,382 | |
| Group 3 | Reference | | Reference | | Reference | |
| Group 1 | 0.64 (0.48–0.86) | 0.003 | 0.64 (0.47–0.86) | 0.003 | 0.82 (0.59–1.16) | 0.263 |
| Group 2 | 0.81 (0.59–1.10) | 0.177 | 0.79 (0.48–1.09) | 0.157 | 0.89 (0.61–1.30) | 0.548 |
| 5% body weight reduction | | | | | | | |
| Total | N | 10,191 | | 10,191 | | 7,746 | |
| Group 3 | Reference | | Reference | | Reference | |
| Group 1 | 0.48 (0.40–0.56) | <0.001 | 0.49 (0.41–0.58) | <0.001 | 0.66 (0.54–0.81) | <0.001 |
| Group 2 | 0.83 (0.70–0.98) | 0.026 | 0.85 (0.72–1.01) | 0.063 | 1.07 (0.88–1.32) | 0.494 |
| Men | N | 8,604 | | 8,604 | | 6,364 | |
| Group 3 | Reference | | Reference | | Reference | |
| Group 1 | 0.47 (0.40–0.57) | <0.001 | 0.48 (0.40–0.58) | <0.001 | 0.66 (0.52–0.83) | <0.001 |
| Group 2 | 0.82 (0.68–0.98) | 0.032 | 0.84 (0.69–1.01) | 0.064 | 1.08 (0.86–1.36) | 0.506 |
| Women | N | 1,587 | | 1,587 | | 1,382 | |
| Group 3 | Reference | | Reference | | Reference | |
| Group 1 | 0.52 (0.35–0.78) | 0.001 | 0.53 (0.35–0.79) | 0.002 | 0.73 (0.46–1.15) | 0.178 |
| Group 2 | 0.90 (0.61–1.32) | 0.584 | 0.91 (0.61–1.35) | 0.645 | 1.05 (0.66–1.67) | 0.848 |
CI, confidence interval; MS, metabolic syndrome; OR, odds ratio; SHG, Specific Health Guidance.
Model 1: univariate and multivariable logistic regression analyses were performed. Model 2: age divided by 10, sex, and body mass index (BMI) were used as covariates. Model 3: age divided by 10, sex, BMI, rate of BMI change from 2016 to baseline (2017), current smoking status, heavy drinking status, physical activity, eating speed, eating dinner late, sleeping condition, and the transtheoretical model of behavior change were used as covariates. Group 1 satisfied the SHG criteria in 2016 and participated in the 2016 SHG. Group 2 satisfied the SHG criteria in 2016 but did not participate in the 2016 SHG. Group 3 did not satisfy the SHG criteria in 2016 and did not need to participate in the 2016 SHG.
Table 4 shows the logistic regression analysis results for new-onset MS according to the Japanese or NCEP-ATP III criteria after 1 year. Compared with Group 3, Group 1 was significantly associated with new-onset MS according to the Japanese criteria in men (OR 2.56; 95% CI, 1.93–3.40, model 3) and the NCEP-ATP III criteria in men (OR 2.07; 95% CI, 1.24–3.44, model 3) and women (OR 2.22; 95% CI, 1.28–3.85, model 3). Group 2 showed a significant association with new-onset MS according to the Japanese criteria in men (OR 2.77; 95% CI, 2.06–3.73, model 3) and women (OR 4.43; 95% CI, 2.11–9.29, model 3) and the NCEP-ATP III criteria in men (OR 2.37; 95% CI, 1.40–4.01, model 3) and women (OR 2.80; 95% CI, 1.57–5.02, model 3).
Table 4. Association between SHG status in 2016 and new-onset of MS after 1 year
| | Model 1 | | Model 2 | | Model 3 | |
|---|
| | OR (95%CI) | p-value | OR (95%CI) | p-value | OR (95%CI) | p-value |
|---|
| Japanese criteria for MS | | | | | | | |
| Men | N | 4,585 | | 4,585 | | 3,771 | |
| Group 3 | Reference | | Reference | | Reference | |
| Group 1 | 2.81 (2.20–3.57) | <0.001 | 2.46 (1.92–3.14) | <0.001 | 2.56 (1.93–3.40) | <0.001 |
| Group 2 | 3.15 (2.46–4.04) | <0.001 | 2.75 (2.13–3.54) | <0.001 | 2.77 (2.06–3.73) | <0.001 |
| Women | N | 1,242 | | 1,242 | | 1,112 | |
| Group 3 | Reference | | Reference | | Reference | |
| Group 1 | 1.61 (0.85–3.07) | 0.143 | 1.35 (0.70–2.60) | 0.365 | 2.11 (0.99–4.49) | 0.053 |
| Group 2 | 3.70 (2.05–6.68) | <0.001 | 3.03 (1.66–5.56) | <0.001 | 4.43 (2.11–9.29) | <0.001 |
| NCEP-ATP III for MS | | | | | | | |
| Men | N | 4,575 | | 4,575 | | 3,764 | |
| Group 3 | Reference | | Reference | | Reference | |
| Group 1 | 2.57 (1.69–3.93) | <0.001 | 1.94 (1.26–2.99) | 0.003 | 2.07 (1.24–3.44) | 0.005 |
| Group 2 | 2.96 (1.92–4.56) | <0.001 | 2.12 (1.36–3.30) | 0.001 | 2.37 (1.40–4.01) | 0.001 |
| Women | N | 1,131 | | 1,131 | | 1,011 | |
| Group 3 | Reference | | Reference | | Reference | |
| Group 1 | 1.91 (1.20–3.04) | 0.006 | 1.64 (1.02–2.63) | 0.043 | 2.22 (1.28–3.85) | 0.004 |
| Group 2 | 2.37 (1.46–3.86) | 0.001 | 2.03 (1.23–3.33) | 0.005 | 2.80 (1.57–5.02) | 0.001 |
CI, confidence interval; MS, metabolic syndrome; OR, odds ratio; SHG, Specific Health Guidance.
Model 1: univariate and multivariable logistic regression analyses were performed. Model 2: age divided by 10, sex, and body mass index (BMI) were used as covariates. Model 3: age divided by 10, sex, BMI, rate of BMI change from 2016 to baseline (2017), current smoking status, heavy drinking status, physical activity, eating speed, eating dinner late, sleeping condition and the transtheoretical model of behavior change were used as covariates. Group 1 satisfied the SHG criteria in 2016 and participated in the 2016 SHG. Group 2 satisfied the SHG criteria in 2016 but did not participate in the 2016 SHG. Group 3 did not satisfy the SHG criteria in 2016 and did not need to participate in the 2016 SHG.
To examine whether the impact of health guidance history differs by age, BMI, and transtheoretical model of behavior change stage, we conducted subgroup analyses by age (<50, ≥50 to <60, or ≥60 years), BMI (<25, ≥25 to <27.5, or ≥27.5 kg/m2), and behavior change stage (indifference period, interest and preparation period, and action and maintenance period) (eTable 2, eTable 3, eTable 4, eTable 5, eTable 6, eTable 7, eTable 8, eTable 9, and eTable 10 and eFigure 1, eFigure 2, eFigure 3, eFigure 4, eFigure 5, and eFigure 6). Regarding weight loss, no significant interaction was observed between age, BMI, or behavior change stage and the comparison between Groups 3 and 1. Regardless of BMI and behavior change stage, Group 1 showed a significant negative association with a 5% body weight loss compared to Group 3, and similar patterns were observed among subgroups with participants aged <50 years and ≥60 years. Regarding the outcome of new-onset MS, no significant interaction was observed between age, BMI, or behavior change stage and the comparison between Groups 3 and 1. Regardless of BMI and behavior change stage, Group 1 showed a significant positive association with new-onset MS compared to Group 3, and similar patterns were observed among participants of subgroups aged <50 years and 50–60 years.
Discussion
The current study examined the impact of a health guidance history in the previous year on the effectiveness of the Motivational Health Guidance. Our study results revealed that a single session of the Motivational Health Guidance program resulted in weight loss after 1 year for the population as a whole. However, the effectiveness of the health guidance was contrasted, particularly between individuals with and without a history of SHG. Individuals without a history of SHG showed improvements in obesity indicators and MS risk factors. In contrast, those with a history of SHG showed reduced improvement in these health metrics, despite receiving similar guidance in the same year.
Previous studies analyzing the factors contributing to weight loss success in SHG have highlighted associations with smoking status, exercise habits, and late-night snacking9,23). In this study, the influence of the history of health guidance remained evident even after adjusting for these factors in a multivariate analysis. Educational level also affected the effectiveness of lifestyle interventions, with differences in health literacy potentially playing an important role24). Although our study did not conduct direct assessments of education level and health literacy, we evaluated the readiness for lifestyle behavior improvement by assessing the transtheoretical model of behavior change stages. Patients with an inadequate behavior change stage are unprepared to undergo lifestyle improvements25,26). In addition, the previous year’s SHG participants who were at an advanced stage of preparation may be excluded from the 2017 SHG because of the reduction in MS risk. Therefore, the number of individuals who did not respond to lifestyle interventions may have increased in the group that continued to participate in SHG in 2017. However, our results showed that participants with a history of SHG did not have a lower behavior change stage than those who did not participate in the previous year’s SHG. Additionally, it is necessary to consider the potential influence of the duration since becoming eligible for SHG. There was a difference between Groups 1 and 3 in terms of the presence or absence of a history of health guidance in the previous year and in the duration since meeting the SHG criteria, with Group 3 having a shorter duration. However, even when comparing Group 2, which already met the SHG criteria in the previous year, with Group 1, the weakening effect on weight loss suggests that the presence or absence of a history of health guidance may be more important than the duration since meeting the SHG criteria.
In the group who participated in the previous year’s SHG, weight loss had already been observed at baseline because of the previous year’s guidance. This may explain why this group had difficulty achieving further weight loss. However, the trend did not change even after adjusting for BMI change from 2016 to baseline (2017) (model 3). Most importantly, they satisfied the SHG criteria again in 2017 (ie, they remained at high risk), indicating that they required further weight loss management and that the weight loss achieved at baseline was insufficient.
Furthermore, the content of health guidance may have affected its effectiveness. Regarding weight loss, the health guidance in 2017 was more effective in Group 2 than in Group 1, who already had a history of obtaining health guidance. This could indicate that the participants of the group who participated in the previous year’s SHG might not have felt motivated by the 2017 health guidance, which was identical to the previous year’s guidance. Indeed, research in marketing has highlighted the diminishing effects of repeated exposure to the same information27), a principle that might also apply to health guidance.
The impact of past health guidance history has also been mentioned in a 2020 study by Fukuma et al.28). They conducted two analyses, including and excluding participants with a history of health guidance over the previous year. Both analyses showed that SHG subjects lost weight after 1 year; however, the intervention demonstrated limited effects on cardiovascular risk factors. Unlike our study, their research examined the effects of SHG, including those who do not actually participate in SHG, and did not directly compare groups with and without health guidance histories. These differences may explain the differing results between their study and ours.
This study analyzed the effectiveness of Motivational Health Guidance, a single-session health intervention delivered by healthcare professionals. Such interventions are widely practiced in occupational health settings, including counseling with occupational physicians and health nurses. Because of the similarities with Motivational Health Guidance, the findings of this study may apply to these interventions. Therefore, it may be beneficial to differentiate between first-time and repeat participants in these health interventions and to consider different approaches.
For populations where conventional lifestyle interventions are expected to be ineffective, the same approach as in the previous year cannot be expected to promote improvement. A single, stand-alone health guidance session may be insufficient for those who find behavioral changes challenging. While considering multiple intervention sessions might be worthwhile, there is also a need to reduce intervention costs. Therefore, a combination of traditional methods with cost-effective approaches may be necessary. As a method to provide intensive feedback to participants, recent reports highlight the effectiveness of smartphone applications and Internet of Things devices in health guidance29). These technologies can enrich patient feedback without substantial increases in cost or human resources by incorporating health coaching and real-time feedback through mobile applications. Using group sessions to treat multiple patients simultaneously is another strategy for increasing these programs’ effectiveness without increasing the need for additional staff or work hours. The utility of overnight group health guidance programs has been reported in the context of SHG30). These interventions should be considered for populations more likely to have a decreased response to conventional lifestyle interventions.
Furthermore, when considering the best use of limited resources, we recommend actively promoting health guidance programs while focusing on populations most likely to benefit from the intervention and then focusing on increasing their participation rates. The nationwide implementation rate of SHG was only 26.5% in 202231), indicating that those who met the MS criteria did not participate. Our results suggest that the prior year’s non-participants can achieve greater benefits; strengthening the outreach to these individuals could enhance the group’s overall effectiveness. Specific strategies for reducing non-participation over consecutive years should be considered from an occupational health perspective.
The present study has several limitations. First, given that this was a retrospective, multicenter study, the available data were limited to standard laboratory values and questionnaire information. Second, this study cohort comprised individuals who participated in the Motivational Health Guidance in 2017, which may have induced some selection bias. This limitation constrains the generalizability of the study findings to health guidance beyond SHG. However, it also reflects a setting close to real-world occupational health guidance targets. Third, the number of women among the enrolled individuals was limited. The criteria for health guidance regarding WC differ between men and women, and most people targeted for health guidance are men, including 4 million men (76%) and 1.26 million women (24%)8). Furthermore, by restricting the analysis to those participating in SHC for 3 consecutive years, the proportion of women with a high rate of quitting the company was lower32). Nonetheless, based on the NCEP-ATP III criteria, a health guidance history in the previous year was associated with an increased risk of new-onset MS, even among women. Although no significant differences in other outcomes were observed, women showed the same tendency as men regarding the reduced effect of health guidance among those with health guidance in the previous year. Fourth, the follow-up period lasted only 1 year. The number of individuals who developed MS 1 year later was approximately 3.3–16.4%; hence, a longer observation period is desirable to assess whether the intervention contributed to the long-term prevention of MS onset.
Conclusion
The findings suggest that participants with a history of health guidance in the previous year may have low rates of achieving weight loss and a high incidence of new-onset MS after 1 year. For populations with a history of health guidance, the same approach may not promote improvement. Thus, introducing methods that encourage more behavioral changes is considered. This study afforded insights that could lead to more effective and efficient implementation of MS countermeasures in occupational health.
Acknowledgments
We thank the health insurers for providing data on the SHG participants.
Author contributions
AH, TOn, and KT designed the study. KT acquired the data. AH, TOn, and KT analyzed the data. AH, TOn, KN, YN, FH, MM, NS, TOk, KM, TK, and KT interpreted the data. AH and TOn wrote the first draft of the manuscript and together with all the coauthors worked collaboratively to write, discuss, and review this manuscript, which was revised and edited by KT. All authors have read and approved the final draft. TOn is the guarantor of this work and, as such, had full access to all the data in the study and takes responsibility for the integrity of the data and accuracy of data analysis.
Data availability statement
Data are available upon reasonable request. All data relevant to the study are included in the article or uploaded as supplementary information.
Study funding
This research was supported by Japan Agency for Medical Research and Development [Grant Number: JP19ek0210124].
Conflict of interest
All authors have no conflicts of interest to declare.
Supplementary material
This article contains supplementary material (Appendix), which is available in the online version (doi: 10.1539/eohp.2024-0011-OA)
References
- 1. Scuteri A, Laurent S, Cucca F, et al; Metabolic Syndrome and Arteries Research (MARE) Consortium. Metabolic syndrome across Europe: different clusters of risk factors. Eur J Prev Cardiol. 2015; 22(4): 486-491.
- 2. Arai H, Yamamoto A, Matsuzawa Y, et al. Prevalence of metabolic syndrome in the general Japanese population in 2000. J Atheroscler Thromb. 2006; 13(4): 202-208.
- 3. Cornier MA, Dabelea D, Hernandez TL, et al. The metabolic syndrome. Endocr Rev. 2008; 29(7): 777-822.
- 4. Kohro T, Furui Y, Mitsutake N, et al. The Japanese national health screening and intervention program aimed at preventing worsening of the metabolic syndrome. Int Heart J. 2008; 49(2): 193-203.
- 5. Ministry of Health, Labour and Welfare. Operational Guide to Specific Health Checkups and Specific Health Guidance (in Japanese); 2021. https://www.mhlw.go.jp/content/12400000/000735512.pdf. Accessed July 5, 2024.
- 6. Matsuzawa Y. Specific health guidance, the nationwide lifestyle intervention program targeting metabolic syndrome, seems to be successful in Japan. J Atheroscler Thromb. 2018; 25(4): 304-305.
- 7. Ministry of Health, Labour and Welfare. Standards for the Implementation of Specific Health Checkups and Specific Health Guidance (in Japanese); 2023. https://www.mhlw.go.jp/content/12400000/001081418.pdf. Accessed June 10, 2024.
- 8. Ministry of Health, Labour and Welfare. Data on Specific Health Checkups and Specific Health Guidance (in Japanese); 2021. https://www.mhlw.go.jp/stf/newpage_03092.html. Accessed July 5, 2024.
- 9. Nakashita Y, Nakamura M, Kiyama M, Kitamura A. Relationship between weight loss of at least 4% and lifestyle improvement on receiving active support of specific health instructions. JJHEP. 2013; 21: 317-325.
- 10. Kato S, Ando M, Honda H, et al. Effectiveness of lifestyle intervention using the internet of things system for individuals with early type 2 diabetes mellitus. Intern Med. 2020; 59(1): 45-53.
- 11. Iso H, Cui R, Takamoto I, et al. Risk classification for metabolic syndrome and the incidence of cardiovascular disease in Japan with low prevalence of obesity: a pooled analysis of 10 prospective cohort studies. J Am Heart Assoc. 2021; 10(23): e020760.
- 12. Ministry of Health, Labour and Welfare. National Health and Nutrition Survey (in Japanese); 2019. https://www.mhlw.go.jp/bunya/kenkou/kenkou_eiyou_chousa.html. Accessed July 5, 2024.
- 13. Tsushita K, S Hosler A, Miura K, et al. Rationale and descriptive analysis of specific health guidance: the nationwide lifestyle intervention program targeting metabolic syndrome in Japan. J Atheroscler Thromb. 2018; 25(4): 308-322.
- 14. Sekizawa Y. Effects of being eligible for specific health guidance on health outcomes: A regression discontinuity analysis using Japan’s data on specific health checkups. Prev Med. 2023; 172: 107520.
- 15. Prochaska JO, DiClemente CC. Transtheoretical therapy: toward a more integrative model of change. Psychotherapy (Chic). 1982; 19(3): 276-288.
- 16. Prochaska JO, Velicer WF. The transtheoretical model of health behavior change. Am J Health Promot. 1997; 12(1): 38-48.
- 17. Muramoto A, Matsushita M, Kato A, et al. Three percent weight reduction is the minimum requirement to improve health hazards in obese and overweight people in Japan. Obes Res Clin Pract. 2014; 8(5): e466-e475.
- 18. Wadden TA, Anderson DA, Foster GD. Two-year changes in lipids and lipoproteins associated with the maintenance of a 5% to 10% reduction in initial weight: some findings and some questions. Obes Res. 1999; 7(2): 170-178.
- 19. Franz MJ, Boucher JL, Rutten-Ramos S, VanWormer JJ. Lifestyle weight-loss intervention outcomes in overweight and obese adults with type 2 diabetes: a systematic review and meta-analysis of randomized clinical trials. J Acad Nutr Diet. 2015; 115(9): 1447-1463.
- 20. Committee to evaluate diagnostic standards for metabolic syndrome. Definition and the diagnostic standard for metabolic syndrome. Nihon Naika Gakkai Zasshi. 2005; 94: 794-809 (in Japanese).
- 21. Matsuzawa Y. Metabolic syndrome—definition and diagnostic criteria in Japan. J Atheroscler Thromb. 2005; 12(6): 301.
- 22. Expert Panel on Detection, Evaluation, and Treatment of High Blood Cholesterol in Adults. Executive Summary of the third report of the national cholesterol education program (NCEP) expert panel on detection, evaluation, and treatment of high blood cholesterol in adults (adult treatment panel III). JAMA. 2001; 285(19): 2486-2497.
- 23. Moriguchi J, Matsuo F, Ejima K. Effectiveness of specific health guidance against metabolic syndrome. Offc J Jpn Soc Ningen Dock. 2011; 26: 75-79.
- 24. Rautio N, Jokelainen J, Saaristo T, Oksa H, Keinänen-Kiukaanniemi S; FIN-D2D Writing Group. Predictors of success of a lifestyle intervention in relation to weight loss and improvement in glucose tolerance among individuals at high risk for type 2 diabetes: the FIN-D2D project. J Prim Care Community Health. 2013; 4(1): 59-66.
- 25. Plotnikoff RC, Brez S, Hotz SB. Exercise behavior in a community sample with diabetes: understanding the determinants of exercise behavioral change. Diabetes Educ. 2000; 26(3): 450-459.
- 26. Orozco-González CN, Cortés-Sanabria L, Márquez-Herrera RM, et al. Willingness to change diet and exercise behavior is associated with better lifestyle in dialysis patients close to a kidney transplant. Clin Nutr ESPEN. 2022; 47: 277-282.
- 27. Campbell MC, Keller KL. Brand familiarity and advertising repetition effects. J Consum Res. 2003; 30(2): 292-304.
- 28. Fukuma S, Iizuka T, Ikenoue T, Tsugawa Y. Association of the national health guidance intervention for obesity and cardiovascular risks with health outcomes among Japanese men. JAMA Intern Med. 2020; 180(12): 1630-1637.
- 29. Kobayashi T, Tsushita K, Nomura E, et al. Automated feedback messages with Shichifukujin characters using IoT system-improved glycemic control in people with diabetes: a prospective, multicenter randomized controlled trial. J Diabetes Sci Technol. 2019; 13(4): 796-798.
- 30. Matsushita M, Muramoto A, Nomura E, et al. The Smart Life Stay (SLS) program: effects of a lifestyle intervention program in combination with health tourism and health guidance for type 2 diabetes. Nutr Diabetes. 2020; 10(1): 33.
- 31. Ministry of Health, Labour and Welfare. Implementation Status of Specific Health Checkups and Specific Health Guidance in 2022 (in Japanese); 2022. https://www.mhlw.go.jp/content/12400000/001251421.pdf. Accessed July 5, 2024.
- 32. Ministry of Health, Labour and Welfare. Summary of the 2022 Survey on Employment Trends (in Japanese); 2023. https://www.mhlw.go.jp/toukei/itiran/roudou/koyou/doukou/23-2/dl/gaikyou.pdf. Accessed July 5, 2024.

