INTRODUCTION
Soil contains enormous bacterial diversity, with an estimated 2,000 to 40,000 distinct species of bacteria per sample (Gans et al., 2005; Fierer and Jackson, 2006; Ashby et al., 2007; Roesch et al., 2007). The specific composition and diversity of individual bacterial communities is influenced by many abiotic and biotic factors, including abiotic factors such as soil characteristics, agricultural practices and land use management (Borneman and Triplett, 1997; Jesus et al., 2009; Köberl et al., 2011; Nacke et al., 2011), and biotic factors such as the nature of the above-ground vegetation (Wieland et al., 2001; Hackl et al., 2004). Despite extensive studies, the causal relationships between these factors and the diversity and composition of bacterial communities are poorly understood. Understanding the relationship would provide important information concerning the significant influence on the function of soil microbial community, which could affect the entire ecosystem through nutrient and mineral cycling (Harris, 2009).
Because of the abundant animal and plant species that reside in tropical forests, these forests are well recognized as a “hot spot” of the world’s total biodiversity (Myers et al., 2000), although many of the species in the tropical forests are threatened with extinction. Previous studies indicated that the diversity of above- and below-ground biotas are related, perhaps due to interactions between plants and soil microorganisms and/or through material cycling (Wardle et al., 2004; Harris, 2009). If the interaction between above- and below-ground biotas existed in tropical forests, it might be expected that soil microorganisms in tropical forests would be more diverse and abundant than those in soils in other areas. Several studies have described the microbial community in tropical and subtropical forests. One study on pasture and forest soils in tropical Brazil used a culture-independent metagenomic approach based on 16S rRNA sequences; this study identified previously unreported novel sequences, and suggested that “immense” microbial diversity existed in the studied regions (Borneman and Triplett, 1997). A specific soil bacterial group known as Actinomycete was studied in a Singapore forest using culture-based isolation techniques; this study reported high diversity at the genus level (Wang et al., 1999). Another studies with DNA fingerprinting methods correlated shifts in bacterial communities in soil with changes in land use in Hawaii by amplified rDNA restriction analysis (ARDRA) on SSU rDNA (Nüsslein and Tiedje, 1999) and Brazil by terminal restriction fragment length polymorphism (T-RFLP) analysis on 16S rRNA (Jesus et al., 2009). By comparing forest soil bacteria from arctic to tropical areas in North and South America by using T-RFLP method on 16S rRNA, strong influence of pH on bacterial diversity was shown among soil and site variables considered (including latitude, plant diversity and geographic origin); a Peruvian Amazon forest soil with the higher pH (pH = 5.5) had higher bacterial phylotype richness than another Peruvian Amazon forest less than 1 km apart with the more acidic soil (pH = 4.1), and tropical soils did not have high phylotype diversity (Fierer and Jackson, 2006). Because of technical limitations in experimental methods employed in the studies mentioned above, the absolute estimates of bacterial diversity, such as the number of OTUs and Chao1 index (Chao, 1984), in tropical forests have not been reported. A study based on pyrosequencing of 16S rRNA reported that estimates of bacterial diversity (the number of OTUs and Chao1 index) were similar in subtropical sites in Brazil and Florida and temperate sites in Illinois and Canada (Roesch et al., 2007), questioning the idea that high biodiversity is more prevalent in microbial communities in tropical forests. Another pyrosequencing study of bacterial 16S rRNA in tropical soils in Malaysia (mostly Malay Peninsula) of different land use has also shown the strong influence of pH on bacterial composition and diversity (Tripathi et al., 2012), although diversity estimate in terms of the number of OTUs nor Chao1 index at individual sampling location was not given. Thus, few studies have so far examined bacterial diversity in tropical forests and those in other regions simultaneously on an experimental platform, like pyrosequencing, which could provide more absolute estimate of bacterial diversity (Roesch et al., 2007; Chu et al., 2010; Nacke et al., 2011).
In this study, to investigate the relationship between above-ground environment and below-ground microbial community, a pyrosequencing analysis of the soil microbiome was conducted, based on 16S rRNA gene sequence variation in samples from five tropical forests in Sarawak, Malaysia and one temperate forest in Japan. Two Sarawak forests were in one ridge (LR) and one valley (LV) location in the 52 ha forest dynamics plot in Lambir Hills National Park (LHNP) in Sarawak, Malaysia (Lee et al., 2002). Another three in Sarawak were remnant (BR), secondary (BS) and burned (BB) forests, respectively, in Bakam Experimental Reserve (BER) (Kendawang et al., 2005). The Japanese forest was in the Ashiu Research Forest (AS), a natural temperate forest. These six forests differ in many aspects of above-ground conditions, such as density and number of tree species, and vegetation composition. The two LHNP locations are inside of a natural mixed-dipterocarp forest, and could be characterized with densely populated plants, high humidity and dim lighting. The ridge is drier than the valley. In the remnant forest of BER (BR), dipterocarp and other tree species were still grown, but surrounded by open space. The secondary forest of BER (BS) was an open space covered with shrubs and ferns. The burned forest (fired four months before the soil sampling) in BER (BB) was covered with charcoal; in this region, live vegetation was scarce at the time of soil sampling. The Ashiu forest lies close to the Japan Sea, and is subject to strong winds and heavy snow in winter. By including the Japanese forest in the analyses, we aimed to identify distinguishing features of the tropical and temperate forests, respectively, and to compare bacterial community structures between the geographically distant forests.
We generated approximately 500,000 16S rRNA sequence reads in total, which were used to assess soil bacterial community structure in tropical and temperate forests. The objectives of this study were to (1) clarify soil bacterial composition, (2) estimate soil bacterial diversity and (3) compare the community structure of soil bacteria among these forests with different aboveground conditions, to examine our working hypothesis that aboveground environment influences belowground microbial community structure. However, our analyses indicated that a clear relationship was not detected between forest environment and bacterial community, in particular, in soil of the investigated six forests.
MATERIALS AND METHODS
Soil sampling method, microbial DNA extraction and PCR amplification of 16S rRNA region
Soil samples were collected in 2009 from five tropical forests in Sarawak, Malaysia, and one temperate forest in Kyoto, Japan. The sampled area of Sarawak has a tropical climate, which includes the Lambir Hills National Park (LHNP) and the Bakam Experimental Reserve (BER), approximately 10 km apart from each other. The ridge (LR) and one valley (LV) location in LHNP were ca. 60 m apart. The three forests in BER, remnant (BR), secondary (BS) and burned (BB) forests, were within two km of each other. On the other hand, the Ashiu Research Forest in Kyoto experiences four seasons, and heavy snow accumulates in the winter. A detailed description of sampling locations is given in Table 1. A hierarchical sampling scheme was employed, such that soil samples were collected from five sampling-sites per forest. This allowed us to investigate micro-environmental community structure, while avoiding the negative effect of subsample pooling on the estimate of diversity (Manter et al., 2010). In each forest, ca. 10 g of soil in ca. 10 cm depth from the surface was sampled at five sampling-sites 10–20 m apart from each other. Our dataset consists of a total of 30 samples (five samples from each of six forests). Soil samples were dissolved in a Corning tube containing extraction buffer immediately after removal. Frozen samples were transferred to laboratories and microbial DNA was extracted using PowerSoil DNA Isolation Kit and PowerMax Soil DNA Isolation Kit (MO BIO Laboratories, Inc., Carlsbad, CA, USA) according to the manufacturer’s instructions. About 10 μg DNA was extracted from 10 g of soil. In addition, 1 kg of soil was collected at two randomly chosen sampling-sites in each forest for soil and physico-chemical analyses, and the average values for the two sites are shown in Table 1. Soil and physico-chemical analyses of the Sarawak forest soils were conducted at Sarawak Forestry Corporation, as described (Kendawang et al., 2005), and the Ashiu soil was analyzed by the CreaTErra Inc. (Tokyo, Japan). PCR primers used in this study amplify a 510 bp fragment that includes three variable regions (V1, V2, & V3) of 16S rRNA gene in Escherichia coli (Baker et al., 2003). They are 9F 5’-GAGTTTGATCCTGGCTCAG-3’ and 533R 5’-TIACCGIIICTICTGGCAC-3’, which cover 191,697 16S rRNA genes (60.8%) out of 315,182 16S rRNA genes present in the Ribosomal Database Project (RDP) database at Michigan State University (Cole et al., 2009). The reason why these primers were chosen was that these primers were supposed to amplify the 16S rRNA region of bacteria, archea and eukarya (Baker et al., 2003), although most of sequenced reads (99.9%) were originated from only bacteria. Each PCR reaction (total 50 μl) contained 0.2 mM dNTPs, 2.5 units of TaKaRa ExTaq (TAKARA BIO Inc., Otsu, Japan), 10x Taq buffer, 2 mM MgCl2, 0.2 μM each of the forward and reverse primers, and ca. 10 ng of template DNA. The PCR conditions used were 94℃ for 2 min, 30 cycles of 94℃ for 30 sec denaturation, 55℃ for 30 sec annealing and 72℃ for 1 min extension, followed by 72℃ for 5 min extension. For each sample, three replicate PCR reactions were combined and quantified by agarose gel electrophoresis. The composite sample for pyrosequencing was prepared by pooling ca. 200 ng of PCR amplicons from each of the 30 samples, and cleaned with the QIAquick PCR Purification Kit (Qiagen, Venlo, Netherlands) following the manufacture’s instructions. To distinguish the 30 sampling-sites from each other, a unique tag sequence was attached to 5’ end of the forward and reverse primers used to amplify DNA extracted from each of the 30 soil samples. Tag sequences could be uniquely identified even with 2 misincorporation errors. Sequences of tags are available upon request. All necessary permits were obtained for the described field studies. Research permit in the Sarawak forests and export permit for extracted DNA samples were issued by the Forest Department Sarawak. The Head of the Ashiu Experimental forest, the Field Science Education Center, Kyoto University, gave research permit in the Ashiu forest.
Table 1.Locations and physico-chemical properties of forests studied
| ID |
LR |
LV |
BR |
BS |
BB |
AS |
| Location |
Lambir Hills National Park |
Bakam Experimental Reserve |
Ashiu Research Forest |
| Country |
Sarawak, Malaysia |
Kyoto, Japan |
| Forest Type |
Ridge, Natural |
Valley, Natural |
Remnant |
Secondary |
Burned
(4 month ago) |
Ridge, Natural |
| Sampling Year |
Dec., 2009 |
Oct. 2009 |
| Latitude, Longitude |
4°11′N, 114°01′E |
4°11′N, 114°01′E |
4°16′N, 113°59′E |
4°16′N, 113°59′E |
4°16′N, 113°59′E |
35°21′N, 136°44′E |
| Mean annual temperature |
26℃ (LHNP) |
11.7℃ |
| Annual precipitation |
3000 mm (LHNP) |
2300 mm |
| Elevation |
162 m |
76 m |
81 m |
76 m |
84 m |
757 m |
| Soil Type |
Sandy clay loam |
Light clay |
Sandy loam |
Clay loam |
Sandy clay loam |
Heavy clay |
| Moisture Content(%) |
16.8 |
21.8 |
24.3 |
23.4 |
19.7 |
48.2 |
| pH (H2O) |
3.7 |
4.5 |
4.0 |
4.1 |
4.1 |
4.0 |
| Total Organic Carbon (%) |
1.65 |
1.72 |
2.22 |
1.68 |
1.7 |
16.35 |
| Total Nitrogen (%) |
0.085 |
0.13 |
0.115 |
0.1 |
0.09 |
0.835 |
| C/N ratio |
19.49 |
13.25 |
19.22 |
16.73 |
18.96 |
19.55 |
| Exchangeable K (cmol(+)/kg) |
0.1 |
0.32 |
0.15 |
0.165 |
0.115 |
0.3 |
| Exchangeable Mg (cmol(+)/kg) |
0.03 |
1.45 |
0.25 |
0.41 |
0.22 |
0.69 |
| Exchangeable Ca (cmol(+)/kg) |
0.15 |
1.63 |
0.10 |
0.38 |
0.35 |
1.62 |
| Exchangeable Na (cmol(+)/kg) |
0.58 |
0.92 |
0.02 |
0.05 |
0.02 |
0.19 |
The composite sample of PCR products of 16S rRNA region was sequenced using a 454 Life Sciences Genome Sequencer FLX (Roche, Basel, Switzerland) in Hokkaido System Science CO. Ltd. (Sapporo, Japan). After trimming 454 adapter sequences, as well as tag and primer sequences, and denoising (Quince et al., 2009; Caporaso et al., 2010) by using tools (split_librart.py and denoise_wrapper.py) in QIIME (http,//www.qiime.org/), sequence data were analyzed using the PYROSEQUENCING PIPELINE in the RDP. Briefly, reads of low-quality and shorter than 300 bp were eliminated from further analyses, and PCR and pyrosequencing errors were corrected by denoising. Average length of analyzed sequences was 475.7 bp. Trimmed sequences were classified to taxa using RDP classifier (Wang et al., 2007). Spearman’s rank correlation was calculated to compare the composition of taxa in different forests by using Excel and a web tool (http://www.gen-info.osaka-u.ac.jp/testdocs/tomocom/spea.html). To test heterogeneity in frequency of taxon among sampling-sites and forests, chi-square tests were performed using marginal frequencies of taxon and location to obtain the expectation by using Excel. Sequences were aligned using the secondary-structure aware Infernal aligner (Nawrocki et al., 2009), and clustered using the complete-linkage clustering method (Borcard et al., 2011). Species (OTU) were defined using conventional definitions based on divergence of bacterial 16S rRNA sequences (Bond et al., 1995; Schloss and Handelsman, 2005; Huber et al., 2007) and a 3% level criterion for “species clusters”. The clustered data created by a RDP tool (Complete Linkage Clustering) were used for rarefaction analysis (Sanders, 1968; Gotelli and Colwell, 2001), and to estimate Chao1 (Chao, 1984), Shannon H’ (Shannon, 1948), modified Jaccard (Chao et al., 2005) indices by using the RDP PIPELINE tools. In addition, to normalize read number variation among samples, the Daisychopper program (http://www.genomics.ceh.ac.uk/GeneSwytch/Tools.html) was used to randomly resample to the minimum number of reads. The re-sampled dataset was used to estimate the diversity and abundance indices above. The 3% cluster data, generated using the RDP clustering tool, were converted to a spreadsheet, and the number of reads per cluster was calculated. Pair-wise distance measures between sampling-sites were obtained by 1 - the Jaccard index, and were used to construct a dendrogram by the Unweighted Pair Group Method with Arithmetic Mean (UPGMA) method, and were subjected to the Nonmetric multidimentional scaling (NMDS) analysis by using a QIIME tool (nmds.py). The 16S rRNA sequences have been deposited under DDBJ accession nos. DRR001521 to DRR001550.
RESULTS AND DISCUSSION
Despite differences in aboveground environmental conditions, the composition of soil bacterial taxa at the Phylum level was similar in all 30 samples (Fig. 1). The top five phyla, Acidobacteria, Proteobacteria, Verrucomicrobia, Planctomycetes, and Bacteroidetes accounted for more than 80–90% of the Phyla detected. These five major phyla were detected by pyrosequencing studies on soil environments over the world, for example, in the four locations on the American continent (Brazil, Florida, Illinois and Canada), where Bacteroidetes was the dominant phylum (Roesch et al., 2007), in German forests, where Actinobacteria was abundant (Nacke et al., 2011), in the Canadian, Alaskan and European Arctic soils, where Acidobacteria and Proteobacteria were dominant depending on the soil pH (Chu et al., 2010), in Malaysia soil, where Acidobacteria and Proteobacteria were dominant, as detected here (Tripathi et al., 2012), and in soils at various elevations of Mt. Fuji in Japan (Singh et al., 2012). Major taxa were also shared among forests at the Class, Order and Family taxonomic levels (Supplementary Figs. S1, S2 and S3).

To confirm the similarity in taxonomic composition of different forests, Spearman’s rank correlation was calculated for all pair-wise combinations of the six forests (Table 2 and Supplementary Table S1). Although the BB forest had relatively higher compositional variation than other forests sampled (Fig. 1 and Supplementary Figs. S1, S2 and S3), statistically significant rank correlation was detected for all pair-wise comparisons at least at the 5% level (Table 2 and Supplementary Table S1). These results suggested that, at higher taxonomic levels, the compositions of soil bacterial communities were relatively similar across divergent forest sites/communities in studied forests. This result concurred with a previous comprehensive study on 16S rRNA variation in diverse environments (Tamames et al., 2010). However, in the present study, the frequency of most taxa showed significant heterogeneity among sampling-sites and among forests at least at the 5% level (Table 3), suggesting that some sampling-site (micro-environment)- and forest (macro-environment)-specific factors influenced the distribution of taxa.
Table 2.Rank correlation of taxa in six forests
| Taxonomic level | # of examined taxa | Rank correlation |
|---|
| Range | Average |
|---|
| Phylum | 22 | 0.89–0.98 | 0.93 |
| Class | 53 | 0.77–0.94 | 0.86 |
| Order | 57 | 0.73–0.92 | 0.82 |
| Family | 127 | 0.56–0.79 | 0.62 |
| Genus | 288 | 0.37–0.67 | 0.54 |
| Species | 1000* | –0.25–0.39 | 0.012 |
* Calculations at the species level were based on the top 1000-ranked clusters.
Table 3.The number (percent) of taxa showing significant heterogeneity in frequency in different forests and at different sampling sites within a forest. Tests with expectation < 1 were eliminated
| Taxonomic level |
|---|
| Comparison | Phylum | Class | Order | Family |
|---|
| Six forests | 18/18 (100) | 43/44 (97.7) | 40/43 (93.0) | 82/88 (93.2) |
| Sarawak (5) | 18/18 (100) | 43/44 (97.7) | 40/42 (95.2) | 78/86 (90.7) |
| LR sites | 14/15 (93.3) | 27/31 (87.1) | 20/27 (74.1) | 24/34 (70.6) |
| LV sites | 16/17 (94.1) | 42/43 (97.7) | 31/36 (86.1) | 46/55 (83.6) |
| BR sites | 12/12 (100) | 21/27 (77.8) | 19/24 (79.2) | 26/37 (70.3) |
| BS sites | 17/18 (94.4) | 35/37 (94.6) | 28/32 (87.5) | 39/50 (78) |
| BB sites | 15/15 (100) | 30/32 (93.8) | 27/30 (90) | 45/57 (78.9) |
| AS sites | 14/15 (93.3) | 25/32 (78.1) | 20/26 (76.3) | 27/43 (62.8) |
Rarefaction curves at the 3% divergence level for each forest did not plateau (Fig. 2), indicating that bacterial species diversity in these samples exceeded the scope of the present investigation. The species diversity was estimated at different sampling levels; for one calculation, data were not normalized to the number of sequence reads (Table 4), while the other calculation was performed with normalized data (Supplementary Table S2). However, there were statistically non-significant positive correlations between the read number and diversity measures for all the 30 sampling-sites (Fig. 3: r df = 28 = 0.27 for the number of clusters (OTUs) and 0.16 for Chao1 index). The non-significant correlation suggested that the normalization was not necessary in this case, and indicated that the overall relationship among forests or sampling sites, with respect to bacterial diversity mentioned below, would not be influenced by the read number variation.

Table 4.Summary of bacterial species diversity and abundance based on 16S rRNA OTUs at 3% distance level
| # of Reads | # of OTUs | Chao1 | H’ | # of Shared OTUs1 | # of Singleton OTUs2 (%) | # of Specific OTUs3 (%) | Singleton & Specific (%) | Average # of Reads
per OTU | Max # of Reads |
|---|
| 1) 30 sites | 10275.2 | 1329.3 | 2277.7 | 5.85 | 12 | 576.4 (43.4) | 285.2 (21.5) | 238.6 (17.9) | 7.99 | 570.5 |
| 2) 5 sites | | | | | | | | | | |
| LR | 10665.8 | 1075.4 | 1683.1 | 5.61 | 430 | 412.6 (38.3) | 281.8 (26.2) | 239.6 (22.3) | 9.90 | 691.0 |
| LV | 10104.6 | 1687.2 | 3206.8 | 6.24 | 500 | 819.0 (48.5) | 594.4 (35.2) | 510.8 (30.3) | 6.16 | 409.2 |
| BR | 8378.8 | 1008.0 | 1636.0 | 5.55 | 386 | 412.8 (41.0) | 257.0 (25.5) | 214.2 (21.3) | 8.32 | 495.6 |
| BS | 10178.6 | 1389.0 | 2321.0 | 5.91 | 367 | 603.8 (43.5) | 477.0 (34.3) | 368.4 (26.5) | 7.40 | 596.0 |
| BB | 12090.2 | 1305.2 | 1975.2 | 5.72 | 278 | 506.4 (38.8) | 364.4 (27.3) | 267.6 (20.5) | 9.34 | 884.0 |
| AS | 10233.0 | 1510.8 | 2843.8 | 6.10 | 556 | 703.8 (46.6) | 482.0 (31.3) | 428.2 (28.3) | 6.83 | 347.0 |
| 3) Forest | | | | | | | | | | |
| LR | 53329 | 2456 | 5535.8 | 5.91 | 27 | 1198 (48.8) | 1270 (51.7) | 821 (33.4) | 21.7 | 2358 |
| LV | 50523 | 4518 | 10913.0 | 6.61 | 2554 (56.5) | 2703 (59.8) | 1835 (40.6) | 11.2 | 1638 |
| BR | 41959 | 2301 | 4661.2 | 5.84 | 1071 (46.5) | 922 (40.1) | 566 (24.6) | 18.3 | 1733 |
| BS | 50893 | 3697 | 7927.6 | 6.41 | 1842 (49.8) | 1910 (51.7) | 1217 (32.9) | 13.8 | 1560 |
| BB | 60451 | 3236 | 5908.0 | 6.39 | 1338 (41.3) | 1918 (59.3) | 993 (30.7) | 18.7 | 2702 |
| AS | 51165 | 3803 | 10187.2 | 6.38 | 2141 (56.3) | 2407 (63.3) | 1651 (43.4) | 13.5 | 1534 |
| 4) Total | 308320 | 14703 | 27919.3 | 7.35 | – | 7083 (48.2) | – | – | 21.0 | 7265 |
1) & 2) the average per site is shown, 3) & 4) the total # in each forest and the whole sample, respectively, is shown.
1 Shared, shared OTUs among sites or forests, 2 Singleton, OTU with read # = 1, 3 Specific, OTUs found only at a site or in a forest.

For sampling-sites within a forest, the estimated minimum number of species (OTUs), Chao1 index (Chao, 1984), was approximately 2,300, and the number of OTUs was approximately 1,300 (Table 4). These estimates were at least 50% lower than estimates of the Chao1 index in four soil samples (Brazil, Florida, Illinois and Canada) from the American continent based on pyrosequencing analyses on 16S rRNA (Roesch et al., 2007), where the denoising procedure was not applied to eliminate PCR and pyrosequencing errors so that bacterial diversity could have been over-estimated. On the other hand, the levels of bacterial richness estimated for the German forests and grasslands, also based on pyrosequencing analyses on 16S rRNA (Nacke et al., 2011), where the denoising was conducted, were comparable with those obtained in this study. In the previous pyrosequencing study in the Malaysia (Tripathi et al., 2012), the total number of OTUs over their 28 soil samples was 27,318 and the study on soils in Mt. Fuji in Japan reported 3,843 OTUs over 27 samples (Singh et al., 2012), although the number of OTUs nor Chao1 index at each sampling location was not reported. It was difficult to compare our estimates with those estimated in these two studies, because it was not clear whether denoising was conducted or not, and sampling level was different.
Diversity was estimated to be more than three-fold higher at the forest level after pooling over sampling-sites, and even higher when data for six forests were pooled (Table 4), suggesting that a significant number of bacterial species were sampling-site- and/or forest-specific (i.e., uniquely represented at one sampling-site or several sampling-sites in one forest). This conclusion was also indicated by the low and/or negative rank correlation at the species level (Table 2 and Supplementary Table S1). It should be noted that the six forests studied here had a relatively similar level of soil bacterial diversity, and that the diversity estimates in the Japanese natural forest (AS) were as high as those in the Sarawak natural forest (LV), especially at the forest level. This result suggested that the severe Japanese climate (i.e., cold winter temperature and snow) did not adversely affect the diversity of the bacterial community in the Japanese forest soil, and that soil bacterial diversity in tropical forests in Sarawak was not especially high.
Furthermore, the Shannon index, H’ (Shannon, 1948), which measures the evenness of species distribution, did not increase significantly over sampling levels, indicating that many species at each sampling-site (and in each forest) were present at low frequency (Table 4). Thus, the data collectively supported the conclusion that the forest soil microbiome at each sampling-site included a large number of species at low abundance, many of which were specific to one sampling-site and/or forest (see below). We concluded that bacterial biota in forest soil existed in a “rare biosphere”, as reported previously for bacterial communities in deep-sea water (Sogin et al., 2006), agricultural soil (Ashby et al., 2007) and prairie soil (Elshahed et al., 2008).
To examine the distribution of OTUs (species) in a different way, the occurrence (the number of reads) of an OTU was characterized (Table 4 and Fig. 4). Interpretation of these results relied on the fact that intra-genomic variability of 16S rRNA sequence was much smaller than inter-genomic rRNA variation (Liao, 1999; Klappenbach et al., 2001). For example, intra-genomic sequence variations among seven 16S rRNA in E. coli (0.2%) and six 16S rRNA copies in the closely-related species Haemophilus influenzae (0.0%) were much smaller than the inter-genomic variation (i.e., divergence) of the rRNA between the two bacteria species (5.9%, Fleishmann et al., 1995; Liao, 1999). Although there is the variability in copy number of 16S rRNA cistrons among bacterial species (Klappenbach et al., 2001), the coefficient of variation of the16S rRNA copy number is low (0.72; average = 4.08, standard deviation = 2.94), calculated for 1,044 bacterial genera in the ribosomal RNA operon copy number database (rrndb, Klappenbach et al., 2001). Thus, assuming that the copy number of 16S rRNA genes per genome was also conserved in the microbiome studied here, the number of reads per OTU of 16S rRNA sequences was considered to be representative of the number of individuals of a species (OTU) in the soil sample. Using the above rationale, it was estimated that the average number of reads per OTU for a sampling-site was 7.99 (Table 4). Although it is difficult to accurately convert read number to the number of individual bacteria, this result suggested that the individual bacterial species were represented at very low abundance in the soil of the six forests sampled in this study. The maximum number of reads in a sampling-site was in the hundreds (Table 4); thus, there was no evidence that one or a few bacterial species achieved high predominance in any specific local microbiota.

The results of this study also demonstrated a high degree of divergence between bacterial communities at the OTU level at different sampling-sites within one forest and in different forests (Table 4). In particular, 30 and 54% of OTUs were specific to one sampling-site and one forest, respectively, and the number of shared species (between forests) was very low, only 12 OTUs (0.009%) were represented at all 30 sampling-sites, and 27 OTUs (0.002%) were represented in all six forests. Among sampling-sites in each forest, an average of 32.1% OTUs were shared, indicating that bacterial communities in sampling-sites within a forest were relatively similar, compared to those in different forests. However, it should be noted that the overall pattern of relative species abundance (Table 4), approximately 40% of OTUs being singletons (Fig. 4), was very similar in all forests, despite differences in forest environment, although the actual species composition differed, due to the presence of site- and forest-specific species. This similarity suggested that microbial community structure in these forests was shaped by over-riding constraints and mechanisms that were not unique to any specific forest.
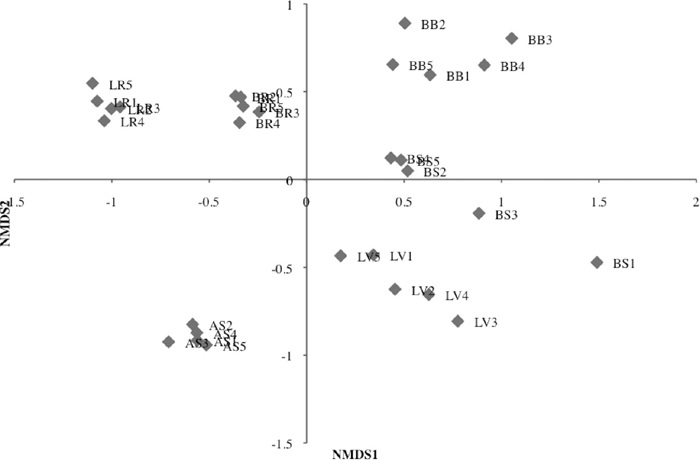
The relationship among sampling-sites and forests was evaluated by constructing an UPGMA dendrogram (Fig. 5) and a NMDS plot (Fig. 6) based on the modified Jaccard index, which measures the similarity of OTU composition. Six forests were separated in two large clusters (Fig. 5). Interestingly, the Sarawak LR and LV forests were separated in different clusters. Sampling-sites within a forest formed well-separated clusters for each forest, indicating the relative similarity in bacterial composition within each forest. Long internal branches leading to each forest was consistent with the presence of forest-specific species discussed above, indicating that variation among forests contributed more to overall variation than variation within forests. The NMDS plot also showed the similar relationship among sampling-sites and forests examined (Fig. 6). Positive and negative values of the first NMDS axis corresponded to the large two clusters in the UPGMA dendrogram (Fig. 5). Relatively scattered distribution of five sampling-sites in the LV, BS and BB forests in the positive side of the first NMDS axis was consistent with relatively longer external branches in the UPGMA tree.

The results reported here provided insights into the structure of soil bacterial communities in tropical forests in Sarawak, Malaysia and a temperate forest in Japan. Because there was no clear association between aboveground environment and belowground bacterial diversity or composition at higher taxonomic levels, it appears that the evolution of soil-living bacterial communities was relatively independent of aboveground biodiversity. Although the influence of environmental factors, such as water, nutrients, and soil pH on the soil microbiota was not well understood (Daniel, 2005), the results presented here suggested that the extent of hydration and the average temperature were not major contributors. For example, despite large differences in average rainfall (3000 mm vs. 2300 mm, mostly snow) and temperature (26℃ vs. 11.7℃) in the Lambir and Ashiu forests, respectively, the Japanese AS forest clustered with the Sarawak LR and BR forests (Fig. 5). Considering the similarity between soil chemistry in all forests sampled in this study, soil pH (3.7–4.5, Table 1) might explain the overall similarity in diversity and composition of taxa at higher taxonomic levels, as suggested previously (Fierer and Jackson, 2006; Lauber et al., 2009; Nacke et al., 2011; Singh et al., 2012). However, the two large clusters (Fig. 5) and positive/negative NMDS axis1 values (Fig. 6) corresponded with three higher and three lower pH soils respectively, although difference was small, suggesting the influence of pH on bacterial composition at the species (OTU) level. In addition, lower and higher C/N ratio in soil (Table 1) also delineated the two groups of the six forests studied. Since the C/N ratio is one of important factors influencing ecosystem structure and function (Ge et al., 2010; Sardans et al., 2012), the effect of C/N ratio on the soil bacterial composition should be examined in future studies.
On the other hand, heterogeneity in taxon frequency at higher taxonomic levels and presence of a large number of site- and forest-specific species suggested that soil-living microbiota indeed adapted to specific forest environments probably by a process involving natural selection. Because environment-specific species would have a small geographic range and therefore a high probability of extinction (Hughes Martiny et al., 2006), this process might lead to rapid speciation and extinction at both the micro (sampling-site)- and macro (forest)- environmental levels. Taken together, the results presented here suggested that the composition and diversity of below-ground bacterial communities might not provide sufficient information to assess overall forest conditions (i.e., healthy or degraded), but that a broader consideration of microflora was needed, perhaps to include fungi, which play an important role in the degradation of organic matter (van der Heijden et al., 1998; Wardle et al., 2004; Lauber et al., 2008), for evaluating the relationship between above- and below-ground biodiversity.
By the hierarchical sampling scheme, this study revealed the observation that many sampling-site-specific bacterial species were identified at sites separated by ≤ 20 m. This result indicated that micro-environmental diversity made a non-negligible contribution to total bacterial diversity in forest soil. The other outcome noted in this study was that the rarefaction curves did not reach saturation, consistent with reports that the microbial diversity in soil is very high (Gans et al., 2005; Fierer and Jackson, 2006; Roesch et al., 2007). It should be stated here that the presence of singleton and sampling-site- and forest-specific OTUs in the studied forest soils could be due to the insufficient read number examined in this study. These results indicated that much larger scale of sequencing effort with a more elaborate forest soil-sampling strategy was needed to accurately investigate the structure of the bacterial communities in the forest soils.