Full papers
Expression analysis of individual homoeologous wheat genome- and rye genome-specific transcripts in a 2BS.2RL wheat-rye translocation
2014 Volume 89 Issue 4 Pages 159-168
Details
2014 Volume 89 Issue 4 Pages 159-168
Wheat-rye translocations are widely used in wheat breeding to confer resistance against abiotic and biotic stress. Studying gene expression in wheat-rye translocations is complicated due to the presence of homoeologous genes in hexaploid wheat and high levels of synteny between wheat and rye chromatin. To distinguish transcripts expressed from each of the three wheat genomes and those from rye chromatin, genomic probes generated from diploid progenitors of wheat and rye were synthesized on a custom array. A total of 407 transcripts showed homoeologous genome (‘A’, ‘B’ or ‘D’ genome)- or rye genome (‘R’)-specific differential expression, based on unequal values of probe hybridization. In a 2BS.2RL wheat-rye translocation, thirteen of the 407 transcripts showed preferential expressions from rye chromatin. As well as quantifying variation in homoeologous transcript in wheat-rye translocations, this study also provides a potential aid to examine the contribution of the subgenomes to complex allohexapolyploids.
Wheat-rye translocations are widely used in wheat breeding. Various forms of the short arm of rye (Secale cereale) chromosome 1 (1RS) have been introduced to confer disease and pest resistance on wheat (Triticum aestivum) in the form of 1AL.1RS, 1BL.1RS, and 1DL.1RS (Friebe et al., 1996; Graybosch, 2001), and roughly 50% of the wheat varieties from the International Maize and Wheat Improvement Center (CIMMYT) contain the 1BL.1RS translocation (Kishii et al., 2008). While the 1BL.1RS translocation is the most common wheat-rye translocation due to the resistance it confers, the long arm of rye chromosome 2 (2RL) also carries resistance genes, especially for Hessian fly (Mayetiola destructor Say) biotype L, the most destructive insect to wheat (Hatchett et al., 1993). The advantage of a 2BS.2RL wheat-rye translocation is that wheat chromosome 2B, unlike 1AS and 1BS, lacks storage protein genes that are essential for bread making quality (Knackstedt et al., 1994; McKendry et al., 2001). 2RL may thus prove useful in wheat breeding (Graybosch, 2001).
Although it is widely known that the rye chromatin within wheat-rye translocations confers resistance to abiotic and biotic stress, the mechanisms of resistance are unknown. Identification of the transcripts involved in stress response in wheat-rye translocations is crucial to understand the functions of rye chromatin within the wheat genome. DNA hybridization-based arrays are an economical and high-throughput method to screen genome-wide transcript levels. These arrays can be customized to contain probes that specifically differentiate transcripts from different subgenomes. The Affymetrix GeneChip Wheat Genome Array (Affymetrix, USA) is commercially available for verifying wheat gene expression, and has been used for independent studies such as low temperature tolerance gene models (Laudencia-Chingcuanco et al., 2011), wheat and rust interactions (Coram et al., 2008), and transcriptome analysis during seed germination (Yu et al., 2014). However, rye chromatin 2RL has been shown to exhibit normal homoeologous relationships with the long arm of wheat chromosome 2B (2BL) (Naranjo and Fernandez-Rueda, 1991; Devos et al., 1995), suggesting that the rye genome is sufficiently similar to that of wheat to permit cross-hybridization. Twenty-five orthologous sequences of coding regions from the long arms of homoeologous group 2, cloned from the ‘B’ genome diploid progenitor of hexaploid wheat and the diploid rye, show 97% overall sequence identity (Lee et al., 2010). Thus, homoeologous relationships among wheat and rye chromatins might cause cross-hybridization of their transcripts on Wheat Genome Array probes, indicating a potential difficulty for distinguishing species-specific transcripts as discussed by Lee et al. (2013).
In this study, we investigate variation in genome-specific transcript abundance in a wheat-rye translocation. Probes were chosen based on sequences unique to each diploid genome, taking into consideration the genome composition of the wheat-rye translocation: an allohexaploid species carrying alien (rye) chromatin within its genome. This probe set was then used to detect differential expression of homoeologous transcripts in hexaploid wheat and the 2BS.2RL wheat-rye translocation, as well as in three diploid progenitors of hexaploid wheat and one diploid rye.
Near-isogenic lines (NILs) were developed by backcross introgression to form BC3F3:4 (‘Coker 797’ *4/‘Hamlet’) and differed in the presence or absence of H21 on the 2RL derived from the diploid rye ‘Chaupon’ (S. cereale, 2n = 14, ‘R’ genome) (Seo et al., 1997). ‘Coker 797’ is a non-2RL U.S. wheat germplasm and ‘Hamlet’ is a U.S. wheat germplasm derived from a 2BS.2RL wheat-rye translocation (Sears et al., 1992). The presence of translocated 2RL was confirmed by FISH in a previous study (Lee et al., 2009). The NIL harboring 2RL (hereafter, 2BS.2RL), ‘Chaupon’, and hexaploid wheat (2n = 6x = 42) ‘Chinese Spring’ were used as custom array probes in this study. Three diploid progenitors (2n = 14) of hexaploid wheat, T. urartu (Kyoto University seed stock accession no. KU199-6, ‘A’ genome), Aegilops speltoides (KU5727, ‘B’) and Ae. squarrosa (KU20-9, ‘D’), were used as surrogates for the hexaploid wheat genome (‘ABD’).
Sequence preparation and a custom array designConsensus sequences for probe design were generated from local unigene clusters. EST and cDNA sequences from T. monococcum (‘A’ genome; 11,337 sequences), Ae. speltoides (‘B’; 4,324), Ae. squarrosa (‘D’; 142), Ae. tauschii (‘D’; 142), T. aestivum (‘ABD’; 1,067,304) and S. cereale (‘R’; 10,858) were downloaded from NCBI (http://www.ncbi.nlm.nih.gov). The sequences were assembled using CAP3 (Huang and Madan, 1999) with percent identity criteria of 89–94. Roughly 95% of the consensus sequences in the Affymetrix GeneChip Wheat Genome Array were covered by the unigene clusters. Two 60 bp probes were designed from each consensus sequence. For T. aestivum, the probes were designed against the middle of the gene (1st probe), and from 30 bp upstream of the stop codon to within the 3’-UTR (2nd probe). One of the two probes for each T. aestivum consensus sequence was designed to encompass the corresponding probe sequence of the Affymetrix GeneChip Wheat Genome Array. Probes for other species covered regions starting 60 bp upstream of the stop codon (1st probe), and from 30 bp upstream of the stop codon to within the 3’-UTR (2nd probe), giving a 30 bp overlap between the 1st and 2nd probe sequences. Probe specificity was enhanced by including a species-specific SNP at or near the middle base position (Udall et al., 2006). Potential cross-hybridization between probe sequences was checked by a reciprocal BLAST search (blastn). A total of 52,589 pairs of probes (5,518 ‘A’-, 2,439 ‘B’-, 225 ‘D’-, 39,060 ‘ABD’-, and 5,347 ‘R’-derived probes from T. monococcum, Ae. speltoides, Ae. squarrosa and Ae. tauschii, T. aestivum, and S. cereale, respectively) representing 52,589 genes were designed (Table 1, Supplementary Fig. S1). The probes were designed to have Tm values between 75 and 85℃. Random GC probes for monitoring hybridization efficiency and four corner fiducial controls were included to assist with overlaying the grid on the image. The array was manufactured by NimbleGen (http://www. nimblegen.com) and synthesized on 12-plex arrays.
| Species | Genome | Total base (bp) of consensus sequences | No. of probes | Genome-specifica | Chromatin-specificb | Cross-hybridizationc | |||
|---|---|---|---|---|---|---|---|---|---|
| > 1.96d | > 2.576 | > 1.96 | > 2.576 | < 80% | ≥ 80% | ||||
| T. monococcum | AA | 3,213,847 | 5,518 | 85 | 56 | 76 | 9 (94.1)e | ||
| Ae. speltoides | BB | 1,435,173 | 2,439 | 42 | 24 | 39 | 3 (96.3) | ||
| Ae. squarrosa & Ae. tauschii | DD | 106,992 | 225 | 2 | 1 | 2 | 0 | ||
| S. cereale | RR | 2,730,048 | 5,347 | 278 | 181 | 13 | 6 | 257 | 21 (91.6) |
| T. aestivum | AABBDD | 33,079,263 | 39,060 | ||||||
| Total | 52,589 | 407 | 262 | ||||||
Seeds were planted in Sunshine Mix #1 (Sun Gro, Canada) and maintained in a plant growth chamber with an average day/night temperature of 23/20℃, 14 h of light (12,000 LUX), and a relative humidity of 60% for 10 days. When plants reached the third leaf stage, the whole seedling including leaf and roots was harvested for RNA isolation. For array experiments, each seedling was frozen immediately in liquid nitrogen and then kept at –80℃ until RNA isolation. To obtain a diverse collection of RNAs, unstressed and drought-stressed (without irrigation for seven days) whole seedlings were used for RNA isolation. Drought-stressed plants showed clear symptoms of wilting when they reached seven days of treatment. Equimolar quantities of RNA from unstressed and stressed seedlings were pooled. Total RNA was isolated from seedlings using TRIzol reagent (Invitrogen, USA), according to the manufacturer’s protocol. All glass and plastic labware including tubes, and a mortar and pestle, were treated overnight with 0.05% diethylpyrocarbonate and autoclaved the next day. Two independent biological replicates were used in separate hybridizations. Each biological replicate was a total RNA sample extracted from the whole tissue of two seedlings. cDNA synthesis, labeling and hybridization to 12 arrays (two arrays for each species sample: T. urartu, Ae. speltoides, Ae. squarrosa, ‘Chinese Spring’, ‘Chaupon’ and 2BS.2RL) were performed at GreenGene Biotech (Republic of Korea) (http://www.ggbio.com). To assess the reproducibility of the microarray analysis, we repeated the experiment twice with independently prepared total RNA. Probe-level summarization by robust multi-chip analysis (RMA) with a median polish algorithm implemented in NimbleScan was used for producing calls. RMA normalized data for each experiment were log10 transformed followed by standardization using Z score transformation equal to (value-average)/standard deviation to generate RMA data merged with Z scores. The Z ratio was used for calculating differences in hybridization values of probes across different samples. A Z ratio of ± 1.96 was deduced as significant (P < 0.05). Further data analysis and graph-plotting were done using Microsoft Excel. Expression data are available at NCBI Gene Expression Omnibus (GEO) under accession number GSE58678.
qRT-PCRPrimers for quantitative real-time reverse transcription polymerase chain reaction (qRT-PCR) were designed to amplify one or more targeted polymorphisms within target contigs (Supplementary Table S1). Total RNA was isolated from unstressed seedlings as described above. RNA samples prepared for qRT-PCR were as follows: T. monococcum (‘A’ genome), Ae. speltoides (‘B’), Ae. squarrosa (‘D’), ‘Coker 797’ (‘ABD’), ‘Hamlet’ (2BS.2RL) and ‘Imperial’ (S. cereale, 2n = 14, ‘R’). First-strand cDNA synthesis was accomplished using a Power cDNA synthesis kit (Intron Biotechnology, Republic of Korea). A control gene (Actin: accession no. AB181991) was used as an endogenous control for all assays. qRT-PCR was performed using Evagreen 2X qPCR MasterMix (Applied Biological Materials, Canada) and the CFX-96 system (Bio-Rad, USA). qRT-PCR products were analyzed using 1% agarose gel electrophoresis to ensure specific amplification of a single product. The ∆∆CT method was used to measure the expression of a gene in the target genome relative to its expression in the control genome species from which the qRT-PCR primers were designed. 95% confidence intervals were calculated to give error bars.
cDNAs from diploid progenitors (‘A’, ‘B’ and ‘D’ genomes) of hexaploid wheat and diploid rye (‘R’) were used to empirically identify probes that distinguish transcripts derived from each genome in a 2BS.2RL wheat-rye translocation (2BS.2RL). In the case of ‘A’ genome sequence-derived probes, ‘A’ genome cDNA rather than cDNAs from other species was expected to hybridize better to these probes. Eighty-five of the 5,518 probes derived from ‘A’ genome sequence (Supplementary Fig. S2A) preferentially hybridized to cDNA from the ‘A’ genome with Z ratios greater than 1.96 in all of the pairwise comparisons with genomes of other species (Supplementary Fig. S2B). These 85 transcripts were grouped into four distinct clusters based on their hybridization values in hexaploid wheat. In cluster one, 42 of the 85 transcripts showed no significant difference (–1.96 ≤ Z ratio ≤ 1.96) in expression between cDNA from the ‘A’ genome and cDNAs from both the hexaploid wheat ‘Chinese Spring’ and 2BS.2RL (Fig. 1A, blue line in Fig. 1B). Cluster two contained 36 transcripts that showed significant differential expression (> 1.96) between transcripts from the ‘A’ genome and transcripts from the hexaploid genomes ‘Chinese Spring’ and 2BS.2RL (Fig. 1A, red line in Fig. 1B). The two transcripts in cluster three showed similar abundance in the ‘A’ genome and ‘Chinese Spring’, but significant variation in expression between the ‘A’ genome and 2BS.2RL. Conversely, the five transcripts in cluster four showed similar expression in the ‘A’ genome and 2BS.2RL but were differentially expressed in ‘Chinese Spring’.
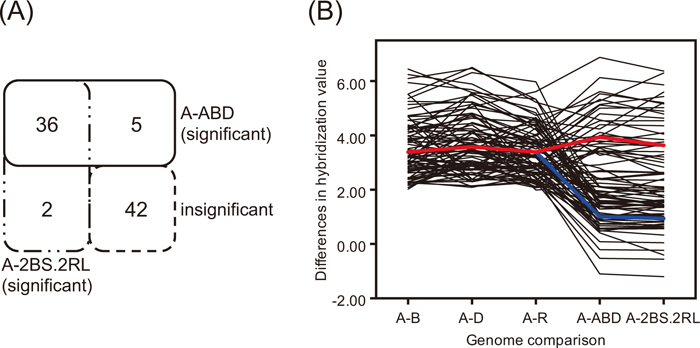
Distinguishing ‘A’ genome-specific transcripts. (A) Eighty-five ‘A’ genome-specific transcripts were identified and grouped into four clusters according to their hybridization values in hexaploid wheat. The diagram represents clusters that show significant and insignificant differences in expression between cDNA from the ‘A’ genome and cDNA from either the ‘Chinese Spring’ or the 2BS.2RL genome. For example, 36 transcripts show significant differences (Z ratio > 1.96) for all of the pairwise comparisons of hybridization between cDNA from the ‘A’ genome and cDNAs from both the ‘Chinese Spring’ and 2BS.2RL genomes (red line in B). A-ABD and A-2BS.2RL represent Z ratios calculated by taking the difference between cDNAs from the two species. (B) Differences in hybridization values of ‘A’ genome-specific transcripts are illustrated. x-axis: comparison between cDNAs from pairs of species. A-B, A-D, A-R, A-ABD and A-2BS.2RL represent Z ratios calculated by taking the difference between cDNAs from each species. y-axis: Z ratio representing differences in hybridization value between samples. Blue and red lines indicate the mean value for probes that show –1.96 ≤ Z ratio ≤ 1.96 (42 transcripts in cluster one), and > 1.96 of Z ratio (36 in cluster two), respectively.
‘B’ and ‘D’ genome-derived probes were analyzed in the same manner as ‘A’ genome-derived probes. Forty-two of the 2,439 probes from the ‘B’ genome diploid progenitor (Supplementary Fig. S3A) showed significantly higher hybridization efficiency (> 1.96) to cDNA from the ‘B’ genome than to that from the ‘A’, ‘D’ and ‘R’ genomes (Supplementary Fig. S3B). These 42 transcripts were grouped into two distinct clusters based on their hybridization values in hexaploid wheat. Cluster one contained 12 transcripts that showed no significant difference (–1.96 ≤ Z ratio ≤ 1.96) in transcript expression between ‘B’ genome and either hexaploid wheat ‘Chinese Spring’ or 2BS.2RL (Supplementary Fig. S3C, upper part of Venn diagram; blue line in Supplementary Fig. S3D). Cluster two contained 30 transcripts that showed significant differences (> 1.96) in gene expression between the ‘B’ genome and the hexaploid genomes of ‘Chinese Spring’ and 2BS.2RL (Supplementary Fig. S3C, lower part of Venn diagram; red line in Supplementary Fig. S3D). Of the 225 probes derived from the ‘D’ genome diploid progenitors (Ae. squarrosa and Ae. tauschii), two were found to preferentially hybridize to transcripts from the ‘D’ genome (Supplementary Fig. S4).
In addition, hexaploid wheat-derived probes whose genomic region is unclear (‘A’, ‘B’ or ‘D’ genome) were examined in hexaploid wheat cDNAs. Of the 39,060 transcripts, 2,116 showed significantly unequal hybridization between ‘Chinese Spring’ and 2BS.2RL (Supplementary Fig. S5).
Differential expression of rye-derived transcriptsTo discover preferential expression of transcripts from rye, 5,347 probes (Supplementary Fig. S6A) were generated in silico from diploid rye sequences. Of these, 278 probes showed preferential hybridization (greater than 1.96 of Z ratio from all of the pairwise comparisons of hybridization between cDNAs from rye and other species) to ‘R’ genome-derived transcripts (Fig. 2A, Supplementary Fig. S6B). In the 2BS.2RL wheat-rye translocation chosen, the long arm of rye chromosome 2 has replaced the long arm of wheat chromosome 2B (Friebe et al., 1990; Lee et al., 2009). Thirteen of the 278 transcripts showed significant differences (> 1.96) in expression between 2BS.2RL (cDNA from the ‘ABD’ genome and genomes of 2RL rather than 2BL) and ‘Chinese Spring’ (cDNA from ‘ABD’ genome), representing 2RL-specific transcripts. Changes in hybridization values based on the Z ratio of these 2RL-specific transcripts across different genomes are illustrated in Fig. 2B. All genome-specific transcripts are summarized in Supplementary Table S2.
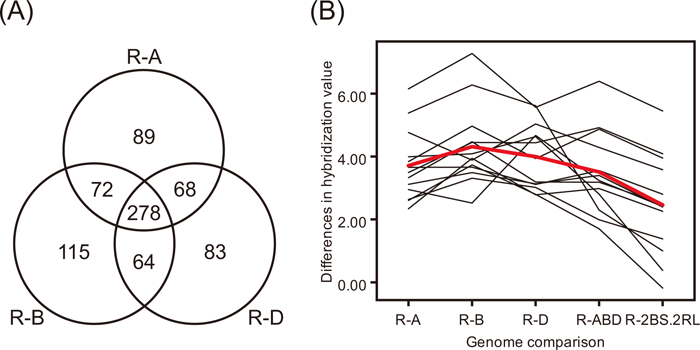
Distinguishing ‘R’ genome-specific transcripts and identification of 2RL-specific transcripts in the 2BS.2RL wheat-rye translocation. (A) Two hundred seventy-eight ‘R’ genome-specific transcripts are identified. The Venn diagram represents numbers of ‘R’ genome-derived probes that show preferential hybridization to rye transcripts. For example, 72 probes show differential expression both between cDNAs from ‘R’ and ‘A’ genomes, and between cDNAs from ‘R’ and ‘B’ genomes. R-A, R-B, and R-D represent Z ratios calculated by taking the difference between cDNAs from pairs of species. (B) Differences in hybridization values of thirteen 2RL-specific transcripts are illustrated. x-axis: comparison between cDNAs from pairs of species. R-A, R-B, R-D, R-ABD, and R-2BS.2RL represent Z ratios calculated by taking the difference between cDNAs from species. y-axis: Z ratio representing differences in hybridization values between samples. Red line indicates the mean value for hybridizations.
A set of five genes was selected to verify the custom array results by qRT-PCR. The transcripts were measured with three biological replicates where each biological replicate was a single seedling. Three technical replicates were performed for each biological replicate sample. The results of these highly replicated qRT-PCR experiments thus allow greater statistical power. Validation results for all five of the genes agreed with the array-based results in the direction of preferential expression (Supplementary Fig. S7).
Identification of the transcriptsA total of 407 transcripts showed differential expression among the homoeologs from the different wheat progenitors and rye genomes. Of these transcripts, 106 (26%) were annotated using blastx and tblastx against non-redundant protein sequences and high-confidence barley gene models (http://webblast.ipk-gatersleben.de/barley), respectively (Table 2). BLAST hits were considered significant only if both of the search criteria, ≥ 70% identity and a minimum of 30 bp coverage, were satisfied.
| Probe identification | Genome-specific | Z ratiosa | Functional annotationb | |||||
|---|---|---|---|---|---|---|---|---|
| A | B | D | R | ABD | 2BS.2RL | |||
| Tmonococcum_0397c | A | 4.2 | 5.5 | 5.0 | 0.9 | 1.4 | glycine-rich RNA-binding protein | |
| Tmonococcum_0485 | A | 3.2 | 2.9 | 4.0 | 1.5 | 1.6 | VEF family protein | |
| Tmonococcum_0790 | A | 4.6 | 4.1 | 4.4 | 5.6 | 5.2 | wall-associated receptor protein kinase family protein | |
| Tmonococcum_1378 | A | 3.4 | 3.4 | 3.4 | 3.7 | 3.6 | peptide-N(4)-(N-acetyl-beta-glucosaminyl) asparagine amidase | |
| Tmonococcum_1456 | A | 2.0 | 3.4 | 2.6 | 2.4 | 2.1 | serine carboxypeptidase-like | |
| Tmonococcum_1674 | A | 2.2 | 2.6 | 2.8 | 0.9 | 1.0 | chain A, β-D-glucan exohydrolase | |
| Tmonococcum_1985 | A | 2.8 | 3.0 | 2.2 | 1.0 | 0.9 | homeobox-leucine zipper protein | |
| Tmonococcum_2230 | A | 2.6 | 2.6 | 2.3 | 1.4 | 1.2 | pre-mRNA-processing factor 17 | |
| Tmonococcum_2343 | A | 3.2 | 3.5 | 2.8 | 0.5 | 0.7 | auxin-responsive protein IAA10 | |
| Tmonococcum_2452 | A | 5.9 | 5.7 | 4.8 | 0.9 | 1.1 | alanyl-tRNA expressed | |
| Tmonococcum_2771 | A | 3.9 | 4.1 | 3.4 | 2.8 | 1.7 | chromatin complex subunit A101 | |
| Tmonococcum_2870 | A | 3.0 | 3.1 | 2.6 | 0.7 | 0.7 | monoglyceride lipase-like | |
| Tmonococcum_2874 | A | 3.2 | 3.2 | 3.0 | 1.4 | 1.4 | nucleolar complex protein 3 homolog | |
| Tmonococcum_2984 | A | 4.7 | 5.0 | 4.6 | 3.3 | 3.7 | LysM domain containing protein | |
| Tmonococcum_3447 | A | 2.2 | 2.1 | 2.3 | 0.1 | 0.0 | serine carboxypeptidase II-2 | |
| Tmonococcum_3475 | A | 3.9 | 3.9 | 3.3 | 5.0 | 5.0 | ADP-ribosylation factor | |
| Tmonococcum_3625 | A | 2.9 | 2.7 | 2.6 | 2.1 | 1.9 | malate dehydrogenase | |
| Tmonococcum_3713 | A | 3.5 | 3.9 | 3.2 | 1.3 | 1.3 | far-red impaired response protein | |
| Tmonococcum_3993 | A | 2.8 | 2.9 | 2.3 | 4.0 | 3.8 | b3 domain-containing protein | |
| Tmonococcum_4207 | A | 2.2 | 3.0 | 2.6 | 3.4 | 3.2 | serine palmitoyltransferase 1 | |
| Tmonococcum_4317 | A | 2.3 | 2.1 | 2.6 | 1.1 | 1.1 | LRR receptor-like serine/threonine-protein kinase RPK2 | |
| Tmonococcum_4379 | A | 5.5 | 3.4 | 3.2 | 0.5 | 0.6 | far-red impaired response protein | |
| Tmonococcum_4590 | A | 3.0 | 3.4 | 4.7 | 1.5 | 1.4 | transcription initiation factor II subunit alpha-like | |
| Tmonococcum_4847 | A | 2.3 | 2.4 | 2.3 | 2.7 | 2.6 | prolyl 4-hydroxylase subunit alpha-1 | |
| Tmonococcum_4883 | A | 2.1 | 3.1 | 2.1 | 2.0 | 1.7 | 3-hydroxybutyryl- dehydrogenase | |
| Tmonococcum_5455 | A | 4.4 | 3.8 | 3.7 | 3.3 | 2.8 | methionine s-methyltransferase | |
| Tmonococcum_5655 | A | 4.3 | 3.6 | 3.6 | 3.8 | 3.6 | probable xyloglucan endotransglucosylase | |
| Tmonococcum_5657 | A | 3.1 | 5.2 | 4.5 | 1.1 | 0.9 | delta-1-pyrroline-5-carboxylate synthetase | |
| Tmonococcum_5780 | A | 3.7 | 3.3 | 3.2 | 1.8 | 1.5 | probable glutamate carboxypeptidase 2-like isoform 1 | |
| Aspeltoides_0109 | B | 4.3 | 2.7 | 2.0 | 3.3 | 3.4 | phosphoenolpyruvate/phosphate translocator 3 | |
| Aspeltoides_0770 | B | 3.2 | 3.7 | 3.0 | 2.6 | 2.5 | PPR protein | |
| Aspeltoides_0927 | B | 3.8 | 2.5 | 4.1 | 3.7 | 4.0 | chromophore lyase 3 | |
| Aspeltoides_1492 | B | 4.6 | 4.3 | 4.1 | 5.0 | 4.7 | kinesin heavy | |
| Aspeltoides_1743 | B | 5.3 | 6.3 | 6.6 | 3.4 | 3.0 | chalcone synthase | |
| Aspeltoides_2291 | B | 3.4 | 3.4 | 2.5 | 3.8 | 3.7 | transcription factor IIA small | |
| Scereale_0093 | R | 2.2 | 2.9 | 2.3 | 2.1 | 3.1 | protein WAX2 | |
| Scereale_0234 | R | 2.2 | 2.6 | 2.1 | 2.1 | 2.2 | auxin-induced protein PCNT115 | |
| Scereale_0385 | R | 3.1 | 3.8 | 3.4 | 3.6 | 3.5 | NADH dehydrogenase | |
| Scereale_0545 | R | 3.0 | 3.1 | 3.1 | 2.8 | 2.7 | chain crystal structure of glutamine synthetase | |
| Scereale_0866 | R | 2.5 | 2.9 | 2.2 | 1.6 | 1.5 | Rop guanine nucleotide exchange factor 1 | |
| Scereale_0933 | R | 2.0 | 2.0 | 2.7 | 2.4 | 2.8 | galactosyltransferase | |
| Scereale_1150 | R | 5.5 | 2.5 | 5.4 | 6.0 | 5.4 | Ras-related protein Rab-2-A | |
| Scereale_1159 | R | 2.2 | 2.3 | 2.3 | 1.3 | 1.4 | actin | |
| Scereale_1213 | R | 4.2 | 3.7 | 3.2 | 3.9 | 3.6 | GNAT family expressed | |
| Scereale_1316c | R | 4.1 | 3.7 | 3.9 | 4.3 | 3.9 | serine/threonine protein kinase | |
| Scereale_1384 | R | 3.5 | 2.3 | 2.0 | 2.3 | 2.1 | ubiquitin-conjugating enzyme | |
| Scereale_1749 | R | 2.4 | 2.5 | 2.5 | 2.0 | 1.8 | 6-phosphogluconate dehydrogenase | |
| Scereale_1804 | R | 2.8 | 2.8 | 3.1 | 2.4 | 2.9 | J-domain protein | |
| Scereale_1835 | R | 4.5 | 4.7 | 4.8 | 1.5 | 4.2 | (3R)-hydroxymyristoyl-[acyl-carrier-protein] dehydratase | |
| Scereale_1859 | R | 5.9 | 6.5 | 5.3 | 6.0 | 5.8 | COP9 signalosome complex subunit 4 | |
| Scereale_1860 | R | 3.7 | 4.7 | 4.0 | 4.4 | 3.9 | calvin cycle protein cp12 | |
| Scereale_1861 | R | 2.3 | 2.7 | 2.2 | 2.3 | 2.2 | 40S ribosomal protein S3a | |
| Scereale_1953 | R | 2.4 | 2.0 | 2.4 | 2.9 | 2.9 | HIPL1 protein | |
| Scereale_1955 | R | 2.4 | 3.8 | 2.7 | 2.4 | 2.3 | cyclophilin B-B | |
| Scereale_1965 | R | 3.1 | 3.6 | 2.0 | 1.1 | 2.8 | nudix hydrolase 8 | |
| Scereale_1999 | R | 3.2 | 4.3 | 4.4 | 1.5 | 4.6 | dolichyl-diphosphooligosaccharide protein | |
| Scereale_2076 | R | 3.9 | 4.6 | 3.1 | 1.2 | 4.1 | 6-phosphofructokinase 2 | |
| Scereale_2089 | R | 2.3 | 3.3 | 2.9 | 3.3 | 3.1 | omega-6 fatty acid endoplasmic reticulum | |
| Scereale_2124 | R | 5.1 | 5.7 | 5.1 | 5.3 | 5.5 | cytochrome b5 reductase 4 | |
| Scereale_2133 | R | 3.8 | 5.0 | 5.0 | 5.0 | 5.0 | protein chloroplastic | |
| Scereale_2196 | R | 2.9 | 3.1 | 2.3 | 2.2 | 2.5 | calcium-dependent protein kinase | |
| Scereale_2218 | R | 2.1 | 2.8 | 2.1 | 2.4 | 2.2 | long-chain-fatty-acid-CoA ligase 4 | |
| Scereale_2358 | R | 4.1 | 2.6 | 3.3 | 3.3 | 2.8 | PER1A protein | |
| Scereale_2360 | R | 3.5 | 4.3 | 3.3 | 4.1 | 4.1 | AP-1 complex subunit mu-1-I | |
| Scereale_2366 | R | 2.2 | 2.8 | 2.2 | 2.5 | 2.5 | GDSL-motif lipase hydrolase family protein | |
| Scereale_2376 | R | 5.6 | 2.4 | 4.5 | 2.4 | 2.2 | plasma membrane atpase 1 | |
| Scereale_2813 | R | 2.5 | 3.7 | 2.5 | 2.0 | 2.5 | ice recrystallization inhibition protein 1 precursor | |
| Scereale_2862 | R | 5.4 | 5.7 | 5.3 | 5.9 | 5.5 | isco activase small isoform precursor | |
| Scereale_3449 | R | 2.5 | 2.7 | 2.7 | 0.7 | 0.8 | protease do-like 14 | |
| Scereale_3458 | 2RL | 2.9 | 2.5 | 4.7 | 3.2 | 2.4 | SNI1 | |
| Scereale_3743 | R | 2.4 | 2.3 | 2.6 | 2.0 | 2.4 | RNA recognition motif-containing protein | |
| Scereale_3859 | R | 5.3 | 5.6 | 5.6 | 5.3 | 5.0 | BURP domain-containing protein 10 | |
| Scereale_3897 | R | 2.8 | 3.9 | 2.4 | 3.0 | 3.2 | disease resistance rpp13-like protein | |
| Scereale_3924 | R | 2.2 | 2.8 | 2.4 | 2.9 | 2.6 | vesicle 2-related | |
| Scereale_4039 | R | 2.8 | 3.2 | 3.1 | 2.9 | 3.0 | protein FAR1-related sequence 5 | |
| Scereale_4130 | R | 3.2 | 2.6 | 4.0 | 0.3 | 0.2 | disease resistance protein RDL5/RF45 | |
| Scereale_4176 | R | 3.1 | 3.4 | 3.0 | 3.3 | 3.2 | ferredoxin-NADP(+) reductase | |
| Scereale_4228c | R | 2.2 | 2.4 | 2.0 | 2.0 | 2.1 | sucrose:fructan 6-fructosyltransferase | |
| Scereale_4260 | R | 2.6 | 2.9 | 2.3 | 2.1 | 2.1 | lipid binding protein precursor | |
| Scereale_4371 | R | 4.1 | 4.1 | 3.9 | 4.5 | 4.4 | senescence-associated protein | |
| Scereale_4386 | R | 4.8 | 6.3 | 5.3 | 4.6 | 4.3 | phosphoprotein phosphatase inhibitor | |
| Scereale_4394 | R | 4.2 | 6.1 | 5.2 | 4.9 | 4.6 | mate efflux family protein 9 | |
| Scereale_4406 | R | 3.3 | 3.6 | 3.9 | 1.5 | 3.4 | mitochondrion protein | |
| Scereale_4547 | 2RL | 2.6 | 3.3 | 3.0 | 2.0 | 1.4 | UDP-glucose 4-epimerase GEPI48 | |
| Scereale_4874 | R | 3.3 | 3.1 | 3.4 | 3.7 | 3.4 | peroxidase 2 | |
| Scereale_4932 | R | 2.4 | 2.3 | 2.2 | 3.5 | 3.5 | antimicrobial peptide MBP-1 | |
| Scereale_4954 | R | 3.0 | 5.2 | 4.9 | 3.4 | 3.3 | carotenoid cleavage dioxygenase | |
| Scereale_5042 | R | 2.4 | 2.4 | 2.1 | 2.6 | 2.7 | CASP-like protein sb05g025800 | |
| Scereale_5113 | R | 4.5 | 5.1 | 2.5 | 2.0 | 2.6 | histone deacetylase hd2 | |
| Scereale_5143 | R | 2.6 | 3.6 | 2.9 | 2.7 | 2.3 | protein auxin response 4 | |
| Scereale_5181 | R | 4.5 | 5.6 | 3.1 | 5.1 | 5.5 | protein transparent testa 12 | |
| Scereale_5189 | R | 2.1 | 2.3 | 2.2 | 1.8 | 1.6 | bZIP transcription factor superfamily | |
| Scereale_5241 | R | 3.7 | 3.7 | 3.6 | 3.8 | 3.7 | low temprature induced-like protein | |
| Scereale_5293 | R | 3.6 | 4.4 | 4.2 | 4.5 | 4.5 | 5 -adenylylsulfate reductase | |
| Scereale_5316 | R | 4.4 | 6.0 | 5.3 | 5.4 | 5.3 | HGA6 | |
| Scereale_5324 | R | 2.3 | 2.8 | 3.9 | 3.7 | 3.3 | histone-lysine N-methyltransferase ashr3 | |
| Scereale_5368 | R | 3.8 | 3.5 | 4.0 | 4.0 | 3.8 | glutamyl-tRNA amidotransferase subunit | |
| Scereale_5431 | R | 2.8 | 3.6 | 2.5 | 1.5 | 1.3 | multidomain cystatin | |
| Scereale_5448 | R | 3.9 | 2.8 | 2.3 | 2.6 | 2.4 | dead-box atp-dependent RNA helicase 27 | |
| Scereale_5524 | R | 5.5 | 5.2 | 4.6 | 4.8 | 4.9 | long chain acyl-synthetase 4 | |
| Scereale_5539 | R | 2.8 | 3.0 | 2.6 | 2.8 | 2.9 | WRKY DNA-binding domain superfamily | |
| Scereale_5578 | R | 5.3 | 3.3 | 5.2 | 0.9 | 3.2 | f-box protein pp2-a13 | |
| Scereale_5641 | R | 4.7 | 3.8 | 3.7 | 3.1 | 3.2 | ankyrin-1 | |
| Scereale_5672 | R | 3.2 | 2.9 | 2.9 | 3.1 | 3.0 | bZIP protein | |
| Scereale_5850 | R | 2.5 | 2.6 | 3.4 | 3.1 | 3.0 | sucrose synthase 1 | |
| Scereale_5919 | R | 3.5 | 2.6 | 2.7 | 3.0 | 2.6 | polyadenylate-binding protein 2 | |
A higher percentage (5.0%) of rye sequence-derived probes were identified as rye-specific transcripts when compared to genome-specific transcripts from diploid progenitors (0.9–1.7%). Higher nucleotide sequence similarity among diploid progenitors than between wheat and rye orthologs may have affected the identification rate of diploid genome-specific transcripts.
Among genome-specific differentially expressed transcripts, several interesting genes were identified. Serine carboxypeptidase-like protein encoding genes detected by the ‘A’ genome-specific probes (Tmonococcum_1456 & 3447) have been shown to be involved in plant growth and development via brassinosteroid signaling (Li et al., 2001) and disease resistance (Dixon, 2001; Mugford et al., 2009). Potential roles in secondary metabolism and resistance have been described for a serine carboxypeptidase-like acyltransferase in oat, a close relative of wheat and rye in the Pooideae (Mugford et al., 2009). These genes are potential candidates for characterizing resistance traits of the 2BS.2RL wheat-rye translocation. Another ‘A’ genome-specific gene was that encoding β-D-glucan exohydrolase, which is involved in the degradation and reorganization of cell wall polysaccharides (Minic and Jouanin, 2006). Diverse functions have been suggested for β-glucosidase during plant development because of its broad specificity for glycosyl residues (Hrmova et al., 2002). β-glucosidase is one of the proteins detected by two-dimensional gel electrophoresis whose intensity varied significantly between Hessian fly-infested and non-infested 2BS.2RL wheat-rye translocations (Lee et al., 2011). It is also possible that β-D-glucan exohydrolase (chain A) detected in this study (Tmonococcum_1674) may function in various ways. LRR receptor-like serine/threonine-protein kinase RPK2-like (also called receptor-like protein kinase 2) is a key regulator of anther development in plants (Mizuno et al., 2007; Nodine and Tax, 2008). A transcript (Tmonococcum_4317) differentially expressed in the ‘A’ genome was identified as encoding the RPK2-like protein.
Two 2RL-specific transcripts, Scereale_3458 and Scereale_4547, are annotated under given BLAST criteria. One of them is SNI1, suppressor of npr1-1, inducible, which functions as a negative regulator of systemic acquired resistance in plant basal defense (Durrant et al., 2007; Kim et al., 2012). The other gene is annotated as UDP-glucose 4-epimerase GEPI48-like but its function has not yet been well studied. Several interesting rye genome-specific transcripts were detected in this study. These rye-specific probes may be applicable to other wheat-rye translocations such as 1BL.1RS. Another annotated gene (Scereale_1316) is classified as a serine/threonine kinase gene, a key member of powdery mildew resistance to wheat (Cao et al., 2011). Wheat-rye translocation in the form of 2BS.2RL shows powdery mildew resistance (Lee et al., 2009). Rye is more tolerant to frost and drought than is wheat (http://www.gramene.org/species/secale/rye_intro.html). A transcript detected by the probe Scereale_2813 matched the ice recrystallization inhibition protein (IRIP) 1. Transgenic Arabidopsis harboring Deschampsia antarctica E. Desv. IRIP showed an elevated recrystallization inhibition activity (John et al., 2009). Scereale_0093 was identified as a WAX2 encoding gene from Brachypodium distachyon. The Arabidopsis mutant wax2 showed alterations in both cuticle membrane and cuticular waxes (Chen et al., 2003). Cuticle forms a protective covering over the outermost surface of the plant and thus functions as a barrier to water loss under dehydration and drought (Goodwin and Jenks, 2005). Both of the transcripts Scereale_2813 and Scereale_0093 showed significant ‘R’ genome preferential expression in diploid and hexaploid genomes. These genes may have an impact on functionally important rye-derived traits including cold and drought tolerance levels and are potentially valuable resources for further studies. A disease resistance protein, RDL5/RF45, that is specified by Scereale_4130 is not functionally well characterized. Since disease resistance traits are desirable targets that could be selected and transferred to wheat in the form of wheat-rye chromosomal translocations, this gene is also a suitable candidate for further research.
When homoeolog-specific probes were applied to cDNAs from the hexaploid wheat ‘Chinese Spring’ and the 2BS.2RL wheat-rye translocation, the expression of some of the transcripts was found to be significantly higher or lower in the hexaploid wheat than in the diploid progenitor. Unequal expression of homoeologous genes and changes in homoeolog bias have been observed in polyploid species (Nomura et al., 2005; Hovav et al., 2008). We can speculate that some specific genome preferential transcripts exhibit expression changes in hexaploid wheat including chromosome translocation lines.
The target genomic region for over two thousand transcripts that were identified as preferentially hybridizing either ‘Chinese Spring’ or 2BS.2RL remains unknown. Elucidation of the genome sequences of common wheat (Brenchley et al., 2012; International Wheat Genome Sequencing Consortium, 2014) and its progenitors (Jia et al., 2013; Ling et al., 2013; Luo et al., 2013), along with identification and mapping of genic regions will be necessary to verify accurately the genomic source of these transcripts.
We have developed an array platform for detecting genome-specific transcripts using hybridization-based probes. This platform provides no easily flexible probes that are barcoded on the array. However, rapid probing of differentially expressed genes gives a clear picture of overall transcript compositions. It can provide a substantial amount of information as a preliminary step to characterize uncharacterized transcripts in target plant samples such as wheat-rye translocations. Our results also give valuable information including sequence polymorphisms that could be added to increased next-generation sequencing data and individual genome structure, and thus represent useful resources to understand the complex hexaploid genome.
The authors are grateful to Kankshita Swaminathan for critical reading of the manuscript. This work was supported by a Korea University Grant (T.G.L.), the Next-Generation BioGreen 21 Program (Plant Molecular Breeding Center No. PJ008031), Rural Development Administration, Republic of Korea (Y.W.S.), and the National Research Foundation of Korea (NRF) grant funded by the Korea government (MSIP) (No. 2012M2A2A60-35566) (Y.W.S.).