ABSTRACT
We dissected barley chromosomes 1H and 6H added to common wheat by the gametocidal system and identified structural changes of the chromosomes by fluorescence in situ hybridization and genomic in situ hybridization. We found five aberrations of chromosome 1H, all of which lacked the long arm: one small fragment with the subtelomeric HvT01 sequence, one terminal deletion, and three telocentric chromosomes of the short arm. We established 33 dissection lines carrying single aberrant 6H chromosomes, of which 15 were deletions, 16 were translocations and two were isochromosomes. We conducted PCR analysis of the aberrant barley chromosomes using 75 and 81 EST markers specific to chromosomes 1H and 6H, respectively. This enabled us to construct a cytological map of chromosome 6H and to compare it to the previously reported genetic map and also to the physical map, which were released by the International Barley Genome Sequencing Consortium. The marker orders on the three maps were largely in agreement. The cytological map had better resolution in the proximal region of chromosome 6H than the corresponding genetic map. We discuss some of the discrepancies in marker order between the three maps that might be due to intraspecific polymorphism and gene duplication, as well as to technical problems inherent in the physical mapping process.
INTRODUCTION
Barley (Hordeum vulgare; 2n = 2x = 14, genome formula HH) is a major crop cultivated in temperate zones. Because of its diploid and self-fertile nature, barley has also been an important model in genetic and genomic studies of the tribe Triticeae that includes other agronomically important crops such as wheat and rye. Barley has a lower DNA content (5.1 Gbp/haploid genome, 1C) than hexaploid wheat (common wheat or bread wheat, Triticum aestivum; 2n = 6x = 42, genome formula AABBDD, with ca. 17 Gbp/1C) (Bennet and Leitch, 1995). Great progress has been made in barley genomics during the last decade: a set of BAC-based physical contigs has been constructed for the genome and the location of genic sequences has been determined in the genomic context (the International Barley Genome Sequencing Consortium (IBGSC), Mayer et al., 2012). The task remaining is the sequencing of minimum-tiling-path BACs, on which the consortium has actively been working. The physical map currently available has been constructed by high-information-content fingerprinting of BACs with the algorithm FPC v9.2. Although it is based on a high-redundancy BAC library (approximately 14-fold genome coverage), the physical map may still have errors due to the repetitive nature of cereal genomes. For the determination of physical positions of the contigs, deletion lines (Endo and Gill, 1996) have been successfully utilized in wheat genomics (Paux et al., 2008; Breen et al., 2013; Lucas et al., 2013; Philippe et al., 2013; Raats et al., 2013; Choulet et al., 2014).
Improvement of crops has been practiced for a long time by introducing alien genes from distantly related species (for review, see Jiang et al., 1994). Barley can be a good genetic resource for wheat improvement because the barley genome has high similarity to wheat genomes (Linde-Laursen et al., 1997; Hori et al., 2007; Mayer et al., 2011). By crossing Chinese Spring wheat and Betzes barley, Islam et al. (1981) produced six wheat-barley disomic addition lines of common wheat for barley chromosomes 2H to 7H. Islam and Shepherd (2000) also produced a seventh addition line of common wheat carrying one intact and the short arm of chromosome 1H together with a pair of 6H chromosomes; only this chromosomal constitution allows the fertile addition of chromosome 1H to common wheat.
Alien chromosomes named gametocidal (Gc) chromosomes induce chromosomal rearrangements in gametes lacking the Gc chromosome in the monosomic addition of the Gc chromosome, and therefore the Gc chromosome acts like a biological mutagen in common wheat (Endo, 1988, 1990, 2007). Using the Gc system, Endo and his colleagues have dissected the barley chromosomes in the addition lines of common wheat (Shi and Endo, 1997, 1999, 2000), and constructed cytological maps for five barley chromosomes using various DNA markers: 2H with ESTs (Joshi et al., 2011), 3H with ESTs (Sakai et al., 2009), 4H with ESTs (Sakata et al., 2010), 5H with ESTs (Ashida et al., 2007), 7H with AFLPs and STSs (Serizawa et al., 2001), 7H with AFLPs and SSR (Masoudi-Nejad et al., 2005), and 7H with ESTs (Nasuda et al., 2005).
In this study, we used wheat-barley addition lines to induce structural changes in chromosomes 1H and 6H by the Gc system, and obtained five and 33 structural rearrangements for chromosomes 1H and 6H, respectively. We conducted PCR analysis of the aberrant barley chromosomes, using EST markers, and constructed a cytological map of chromosome 6H. The obtained data were used to compare three different maps of chromosome 6H: the cytological map constructed in this study, the genetic map (Sato et al., 2009) and the BAC-based physical map (Mayer et al., 2012).
MATERIALS AND METHODS
Plant material
Shi and Endo (1997) produced a double alien addition line of the common wheat cultivar Chinese Spring (T. aestivum L., 2n = 42, 21”) that is disomic for Betzes barley chromosome 6H and monosomic for gametocidal chromosome 2C (described hereafter as the 6H/2C line), and Shi and Endo (1999) identified 15 plants carrying structural changes of the 6H chromosome. In the present study we used the progeny of those plants and the parental 6H/2C line that had been stored at the Laboratory of Plant Genetics, Graduate School of Agriculture, Kyoto University. We also developed another double alien addition line of Chinese Spring (6H/3CSAT) carrying a pair of 6H chromosomes and one gametocidal chromosome 3CSAT, which is known to induce structural changes in common wheat (Endo, 2007), and used the progeny of this line to obtain structurally changed 6H chromosomes.
The addition of entire chromosome 1H to Chinese Spring wheat causes sterility, whereas the coexistence of chromosome 6H mitigates the sterility (Islam, 1983). Islam and Shepherd (2000) developed a semi-fertile disomic-monotelodisomic addition line carrying a pair of chromosomes 6H and a heteromorphic pair of the whole chromosome and the short arm of chromosome 1H (2n = 46, 21” + 1t” 1H/1HS + 1” 6H). From the backcrossed and self-pollinated progeny of this line, we obtained monosomic 1H addition plants (2n = 43, 21” + 1’ 1H), a double disomic addition plant (2n = 46, 21” + 1” 1H + 1” 6H), which was completely male sterile, disomic-ditelosomic plants carrying a pair of the 1H long arm along with a pair of the 6H chromosomes (2n = 46, 21” + t” 1HL + 1” 6H), and ditelosomic 1HS plants (2n = 44, 21” + t” 1HS). We could not produce a plant carrying pairs of chromosomes 1H and 6H and one 2C chromosome because a hybrid (21” + 1” 6H + 1’ 1H + 1’ 2C) between the double disomic addition plant and the 6H/2C line was male sterile. Therefore, we used the backcrossed progeny of the hybrid to induce structural changes in chromosome 1H. In addition, we used as controls three aneuploid lines of Chinese Spring which had been developed by Islam et al. (1981) and Islam (1983): a disomic 6H addition line (2n = 44, 21” + 1” 6H), a ditelosomic 6HL addition line (2n = 44, 21” + t” 6HL) and a ditelosomic 6HS addition line (2n = 44, 21” + t” 6HS). We obtained these control lines from the National BioResource Project-Wheat, Japan (http://www.shigen.nig.ac.jp/wheat/komugi/strains/aboutNbrpLgku.jsp).
DNA markers
We used 75 1H-specific and 81 6H-specific EST markers reported by Nasuda et al. (2005) to characterize dissection lines established in this study (Supplementary Table S1). To assign the EST markers to physical positions, we performed BLAST searches against the barley high-confidence genic sequences (Mayer et al., 2012), with an E-value threshold of 10–5.
Cytological screening
We identified structural changes of barley chromosomes 1H and 6H by fluorescence in situ hybridization (FISH) and genomic in situ hybridization (GISH). Probes for FISH were prepared using one of the barley subtelomeric repetitive sequences, HvT01 (Belostotsky and Ananiev, 1990), and 45S rDNA (from a DNA clone reported by Gerlach and Bedbrook, 1979), while the probe for GISH was prepared using barley genomic DNA. We followed the procedures described by Sakai et al. (2009) for probe preparation and simultaneous FISH/GISH analysis. We also conducted sequential C-banding and FISH/GISH as described by Masoudi-Nejad et al. (2002) to identify the breakpoints of rearranged 1H chromosomes.
PCR analysis
We extracted DNA from leaves by the CTAB method (Saghai-Maroof et al., 1984). As a template, 1 μl of DNA solution (ca. 30 ng/μl) was added to a PCR mixture consisting of 4 μl of 5 x PCR buffer, 0.4 μl of dNTP (10 mM each), 1.5 μl of MgCl2 (25 mM), 1 μl of primers (10 pmol/μl), 0.1 μl of KAPATaq Extra DNA Polymerase (5 U/μl; Kapa Biosystems), and 12 μl of dH2O. As a positive control of PCR, primers to amplify wheat chloroplast ATP synthase CF-1 gene, alpha subunit gene (GenBank accession number M16842.1; Howe et al., 1985) was added to the reaction. Thermal cycling with an iCycler (BioRad) was conducted as follows: 94℃ for 2 min; 5 cycles of 94℃ for 30 sec, 65℃ for 30 sec (with the temperature subsequently decreased 1℃ per cycle) and 72℃ for 1 min; 35 cycles of 94℃ for 30 sec, 60℃ for 30 sec and 72℃ for 1 min; and 72℃ for 7 min. PCR products were checked by agarose (1.5% Agarose S, Nippon Gene) gel electrophoresis (100 V, 40 min) in 1x TAE buffer.
RESULTS AND DISCUSSION
Induction of structural changes in chromosome 1H
We screened 337 progeny of the 46-chromosome plant (21” + 1” 6H + 1’ 1H + 1’ 2C) and found five deletions of chromosome 1H (Table 1, Fig. 1A). This low frequency of the occurrence of aberrant 1H chromosomes was attributable to the monosomic status of chromosome 1H in the parental plant. Chromosome 1H-1 was a small fragment with the HvT01 sequence and a functional centromere because its transmission through mitosis and meiosis was normal (of 10 plants from self-pollination of the monosomic 1H-1 plant, one was disomic, three were monosomic and six were nullisomic for 1H-1). This suggested the occurrence of a large interstitial deletion in chromosome 1H-1. Chromosome 1H-2 was a telocentric chromosome with a terminal deletion involving the entire HvT01 sequence. The remaining three aberrant 1H chromosomes were telocentric chromosomes with the HvT01 sequence. The PCR analysis described below revealed that all 1H chromosomal aberrations involved the short arm of chromosome 1H.
Table 1. Alien addition and dissection lines of Chinese Spring wheat for chromosomes 1H and 6H
| Plant/line | Type of aberration | Disomic/monosomic | Breakpoint1) |
|---|
| 1H | normal | monosomic | none |
| 1HS | telosome | disomic | cent |
| 1HL2) | telosome | disomic | cent |
| 1H-1 | deletion | monosomic | cen & short |
| 1H-2 | deletion | monosomic | cen & short |
| 1H-3 | deletion | monosomic | cent |
| 1H-42) | deletion | disomic | cent |
| 1H-5 | deletion | monosomic | cent |
| 6H | normal | disomic | none |
| 6HS | telosome | disomic | cen |
| 6HL | telosome | disomic | cen |
| 6H-1 | translocation | disomic | long |
| 6H-2 | translocation | disomic | long |
| 6H-3 | deletion | monosomic | long & sat |
| 6H-4 | translocation | monosomic | cen |
| 6H-5 | translocation | disomic | cen |
| 6H-6 | deletion | monosomic | cen & sat |
| 6H-7 | deletion | disomic | long |
| 6H-8 | translocation | disomic | long |
| 6H-9 | deletion | monosomic | NOR |
| 6H-10 | translocation | disomic | sat |
| 6H-11 | deletion | disomic | long |
| 6H-12 | translocation | disomic | sat |
| 6H-13 | translocation | disomic | cen |
| 6H-14 | translocation | monosomic | long |
| 6H-15 | translocation | disomic | short |
| 6H-16 | deletion | monosomic | short |
| 6H-17 | translocation | monosomic | sat |
| 6H-18 | deletion | disomic | short |
| 6H-19 | translocation | monosomic | long |
| 6H-20 | deletion | monosomic | NOR |
| 6H-21 | isochromosome | monosomic | long |
| 6H-22 | deletion | disomic | cen |
| 6H-23 | deletion | monosomic | long |
| 6H-24 | isochromosome | monosomic | long |
| 6H-25 | translocation | disomic | short |
| 6H-26 | deletion | monosomic | short |
| 6H-27 | deletion | disomic | cen |
| 6H-28 | deletion | disomic | long |
| 6H-29 | deletion | disomic | short |
| 6H-30 | deletion | monosomic | long |
| 6H-31 | translocation | monosomic | long & long |
| 6H-32 | translocation | disomic | NOR |
| 6H-33 | translocation | disomic | NOR |
1) “none”, “short”, “long”, “cen”, “sat” and “NOR” stand for no breakpoint, the short arm, the long arm, the centromeric region, the satellite and the nucleolus organizer region, respectively. Some of the breakpoints were determined by PCR analysis.
2) These plants carried a pair of chromosomes 6H.
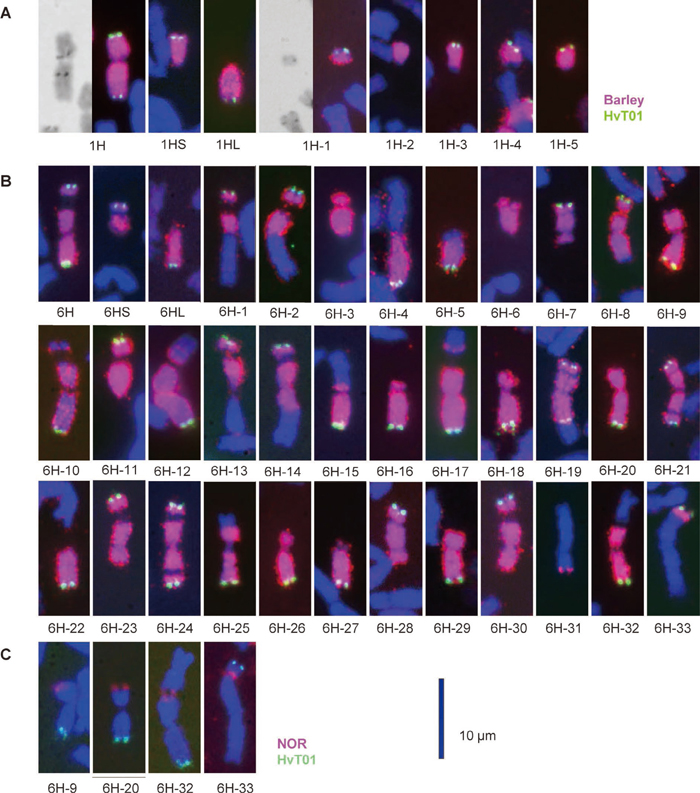
We screened the progeny of plants carrying aberrant 6H chromosomes that had been identified by Shi and Endo (1999), and also the progeny of the 6H/2C and 6H/3CSAT lines. We repeated cytological screening to establish 33 dissection lines of Chinese Spring wheat carrying single aberrant 6H chromosomes in either the monosomic (15 lines) or the disomic (17 lines) condition (Table 1). Of these aberrant 6H chromosomes, 15 were terminal deletions, 16 were translocations involving wheat chromosome segments, and two were 6HS isochromosomes. Two of the deletions and one of the translocations had double breakpoints (Fig. 1B), and therefore the 33 aberrant 6H chromosomes had 36 breakpoints. Two of the deletions and two of the translocations had a breakpoint in the nucleolus organizer region (NOR), which was visualized by the 45S rDNA probe (Fig. 1C). These breakpoints were used to flank parts, or bins, of chromosome 6H in the following PCR analysis.
PCR analysis of chromosome 1H
Nasuda et al. (2005) assigned 75 EST markers to chromosome 1H and its arms by PCR using 6H disomic-1H monosomic addition and 6H disomic-1HS ditelosomic addition plants. Using the 1H monosomic addition, 1HS ditelosomic addition and 6H disomic-1HL ditelosomic addition plants that were obtained in this study, we successfully reassigned 63 of the 75 markers to either the short arm (15 markers) or the long arm (48 markers) as previously reported (Nasuda et al., 2005); the remaining 12 markers showed ambiguous PCR results and therefore were not considered in this study. Using the 63 markers, we conducted PCR analysis of the five plants carrying aberrant 1H chromosomes. The PCR analysis showed that four 1H aberrations had all the 1HS markers and that chromosome 1H-1 had only one marker, k00647 (Table 2).
Table 2. PCR analysis of five 1H dissection and four control lines using 63 EST markers
1) “1” and “0” represent the presence and absence of PCR amplification of markers.
2) Map distances taken from Sato et al. (2009) are incremental from the most distal marker on the short arm. “unmapped” indicates that the EST marker was not mapped by Sato et al. (2009).
Six of the 1HS markers, including k00647, were mapped onto a high-density genetic map of chromosome 1H constructed by Sato et al. (2009) using a mapping population of ‘Haruna Nijo’ (a barley variety) and ‘H602’ (an accession of H. vulgare ssp. spontaneum). On the genetic map, marker k00647 mapped at 88.6 cM from the most distal marker on the 1HS arm. Of the six 1HS markers, two had smaller cM values and three had larger cM values. Supposing the chromosome structure of the 1HS arm to be the same in Betzes and Haruna Nijo, chromosome 1H-1 should have had two interstitial deletions within the short arm, leaving the chromatin containing k00647 together with the terminal segment including the HvT01 sequence and the pericentromeric region with a functional centromere. One of the breakpoints of chromosome1H-1 was probably within the pericentromeric C-band because the C-band of chromosome 1H-1 was much smaller than that in the normal short arm. Also, the PCR analysis indicated the centromere position between markers k00681 and k00654, although the order of these two markers was reversed on the genetic map.
PCR analysis and construction of a cytological map of chromosome 6H
We allocated 74 of the 81 markers to chromosome 6H as reported by Nasuda et al. (2005), but the remaining seven markers showed ambiguous PCR amplification results. Using the reconfirmed 74 markers, we conducted PCR analysis of the 33 dissection lines of chromosome 6H and four control lines (Table 3). PCR analysis clarified chromosomal locations of breakpoints that were unclear in the FISH/GISH analysis (Fig. 1B). For example, the two chromosomes 6HS-3 and 6H-6 with double breakpoints had similar FISH/GISH labeling patterns, but 6H-3 had breakpoints in both arms while those in 6H-6 were in the centromere and short arm. Chromosome 6H-31 carrying a small 6H fragment had two breakpoints in the long arm because it had three consecutive markers on the long arm. Five chromosomes, 6H-1, 6H-2, 6H-11, 6H-21 and 6H-24, appeared to have breakpoints in the centromere according to FISH/GISH, but their breakpoints were in the long arm as revealed by PCR. Conversely, FISH/GISH analysis differentiated the indistinguishable breakpoints of five chromosomes, 6H-9, 6H-20, 6H-25, 6H-29 and 6H-32, which were located between the two consecutive markers k03139 and k00066. Chromosomes 6H-9, 6H-20 and 6H-32 displayed 45S rDNA signals, but chromosomes 6H-25 and 6H-29 did not. Therefore, the NOR of chromosome 6H was located between the two markers. A noteworthy finding of the PCR analysis is that seven EST markers were present in the terminal region of the 6HL arm distal to the HvT01 sequence (see 6H-19 in Fig. 1B). This indicated that the chromosome ends are gene-rich regions. In summary, the PCR analysis confirmed the positions of 36 breakpoints in the 33 aberrant 6H chromosomes: five in the satellite, four in the NOR, six in the short arm excluding the satellite and NOR, six in the centromere, and 15 in the long arm.
Table 3. PCR analysis of 33 6H dissection and four control lines using 81 EST markers
Note) “1” and “0” represent the presence and absence of PCR amplification of the markers. Markers and dissection lines are arranged so that breakpoints are presented in a stepwise shape.
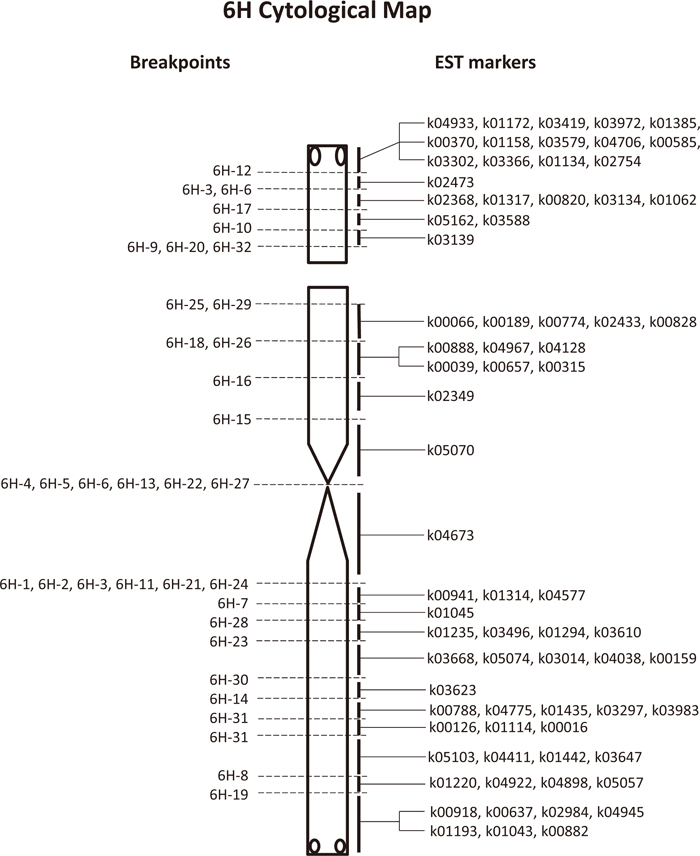
This work resulted in the construction of a cytological map of chromosome 6H as shown in Fig. 2, allocating 36 EST markers to nine regions in the short arm and 38 markers to 13 regions in the long arm. These regions were divided by the 36 breakpoints of the rearranged 6H chromosomes. Each of the regions contained one to 14 markers.
Comparison between the cytological and genetic maps of chromosome 6H
Sato et al. (2009) produced a high-density genetic map of chromosome 6H using 327 EST markers and a mapping population of ‘Haruna Nijo’ and ‘H602’. To compare the cytological and genetic maps, we employed 28 markers that were common to both mapping experiments. The 28 markers were mapped at 22 genetic distance (cM) positions, being distributed more or less evenly along the 6H chromosome of 207.3 cM, and the centromere was placed between k05070 at 102.3 cM and k03610 at 103.4 cM (Fig. 3). The breakpoints of the aberrant 6H chromosomes separated two markers, k03588 and k00066, at 93.6 cM on the genetic map, the former on the satellite and the latter on the short arm, and therefore the NOR was placed between the two markers or at around 93.6 cM. Moreover, the two markers k00189 and k05070 at 102.3 cM on the short arm were separated on the cytological map.
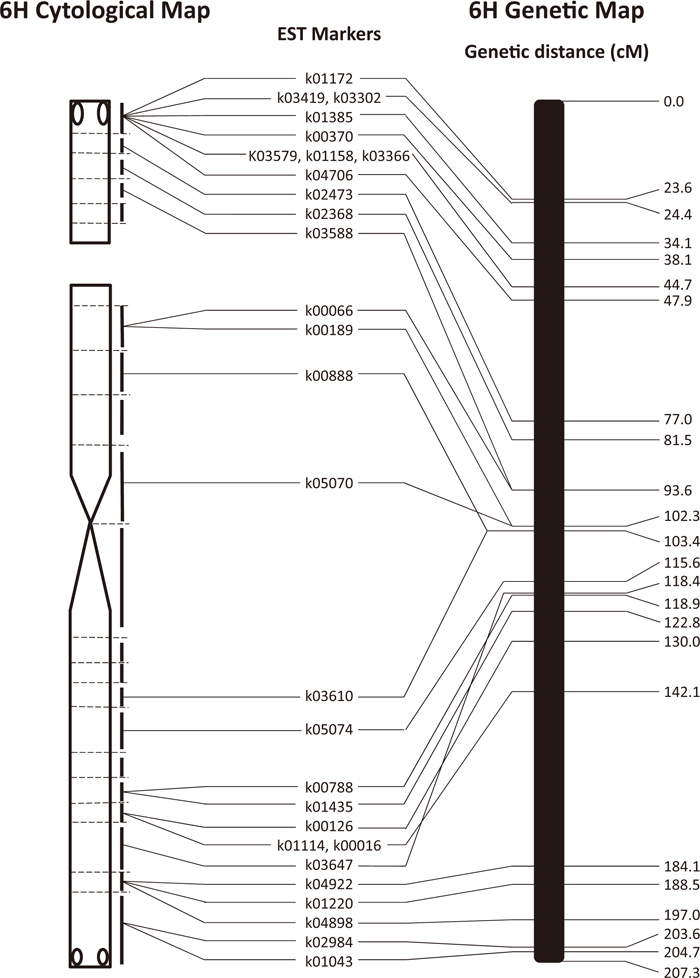
In general, the genetic and cytological maps corresponded well in terms of marker order, but there were two cases of inconsistency between the two maps. The order of markers k05070 and k00888 on the short arm was inverted on the two maps; marker k03647 on the long arm was placed distal to a group of five markers (k00788, k01435, k00126, k01114 and k00016) on the cytological map but proximal to this group on the genetic map. In the former case, the difference in genetic distance between the inverted markers was minor and could be attributed to a statistical error in linkage mapping. In the latter case, however, the difference of greater than 23.7 cM between k03647 and k01114 or k00016 might reflect structural variation of chromosome 6H between two barley cultivars, Haruna Nijo and Betzes. However, even in this case we cannot exclude some error in the genetic map. That the position of markers on genetic maps may not always reflect their physical position is well documented in barley, e.g., by Muñoz-Amatriaín et al. (2011), who mapped SNP markers to flow-sorted chromosomes and chromosome arms, and by Karafiátová et al. (2013), who localized a set of full-length cDNA clones to barley chromosome 7H by FISH.
Comparison between the cytological and physical maps of chromosome 6H
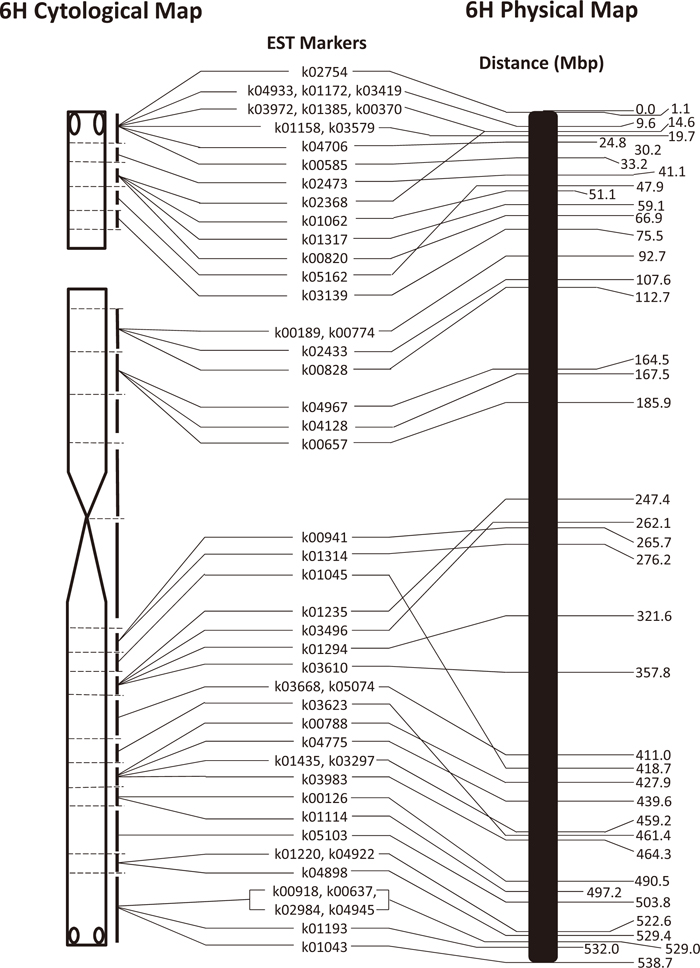
The IBGSC (Mayer et al., 2012) presented an integrated and ordered physical, genetic and functional sequence resource that describes the barley gene-space in a structured whole-genome context. Searching their sequence data of the barley cultivar Morex, we found the corresponding sequences of 51 EST markers used in this study, with which we compared the cytological and physical maps of chromosome 6H. The 51 markers were mapped at 40 physical positions ranging from 1.1 Mbp to 532.0 Mbp, being evenly distributed along the 6H chromosome of 538.7 Mbp, and the order of markers was mostly consistent on the cytological and physical maps (Fig. 4). However, there were six cases of discrepancy in marker order between the two maps, none of which involved markers located on different arms, namely 6HS and 6HL. The positions of two pairs of markers, k00941/k01314 and k01235/k03496, on the long arm are inverted on the physical map. Two more discrepancies on the long arm involved markers k01045 and k03623, and two on the satellite of the short arm involved markers k02368 and k05162. The biggest discrepancy was that marker k01045 mapped at 418.7 Mbp on the Morex physical map but was placed between the two markers k01314 at 276.2 Mbp and k01235 at 247.4 Mbp on the cytological map. On the other hand, the marker k01045 is genetically mapped at 55.0 cM in cultivar Barke, which corresponds to 257.4 Mbp on the physical map of Morex presented by the IBGSC. Mayer et al. (2012) reported the presence of intraspecific variation of gene loci in the barley genome. Our results indicate either the presence of intraspecific structural variation of chromosome 6H between the barley cultivars Barke and Betzes, or incorrect ordering of contigs in the physical map.
This study revealed differences in the order of markers on chromosome 6H between the cytological, genetic and physical maps, although the order was generally consistent between them. The 6H chromosomes of these three maps were derived from different cultivars, and the marker order difference may therefore partly reflect actual intra-chromosomal structural changes in chromosome 6H between different cultivars. However, we cannot exclude the possibility that the order of markers in genetic maps and/or the order of BAC contigs on the barley physical map are not correct in some chromosome regions. Indeed, the discrepancies in the location of markers k05162 and k02368 on the satellite between the cytological and physical maps cannot be due to cultivar variation because these markers in Morex, Barke and Bowman shared the same locations on the physical map (Mayer et al., 2012). The discrepancies may be attributable to mis-localization of contigs during the physical mapping. Thus, our results suggest that dissection lines of barley chromosomes such as those developed in this study will be useful to verify the chromosomal positions of contigs in physical maps of barley chromosomes. This should contribute to the production of a high-quality reference sequence of the barley genome.
ACKNOWLEDGMENTS
We thank Dr. Kazuhiro Sato, Institute of Plant Science and Resources, Okayama University for his generous sharing of the sequences of the ‘Haruna Nijo’ ESTs. This study is in part supported by the National BioResource Project, the Ministry of Education, Culture, Sports, Science and Technology, Japan. T. R. E. was supported by the Operational Program Education for Competitiveness - European Social Fund (project CZ.1.07/2.3.00/20.0165). Contribution number 613 from the Laboratory of Plant Genetics, Graduate School of Agriculture, Kyoto University.
REFERENCES
- Ashida, T., Nasuda, S., Sato, K., and Endo, T. R. (2007) Dissection of barley chromosome 5H in common wheat. Genes Genet. Syst. 82, 123–133.
- Belostotsky, D. A., and Ananiev, E. V. (1990) Characterization of relic DNA from barley genome. Theor. Appl. Genet. 80, 374–380.
- Bennett, M. D., and Leitch, I. J. (1995) Nuclear DNA amounts in angiosperms. Ann. Bot. 76, 113–176.
- Breen, J., Wicker, T., Shatalina, M., Frenkel, Z., Bertin, I., Phillippe, R., Spielmeyer, W., Doležel, J., Šimková, H., Scalabrin, S., et al. (2013) A physical map of the short arm of wheat chromosome 1A. PLoS One 8, e80272.
- Choulet, F., Alberti, A., Theil, S., Glover, N., Barbe, V., Daron, J., Pingault, L., Sourdille, P., Couloux, A., Paux, E., et al. (2014) Structural and functional partitioning of bread wheat chromosome 3B. Science 345, DOI: 10.1126/science.1249721
- Endo, T. R. (1988) Introduction of chromosomal structural changes by a chromosome of Aegilops cylindrica L. in common wheat. J. Hered. 79, 366–370.
- Endo, T. R. (1990) Gametocidal chromosomes and their induction of chromosome mutations in wheat. Jpn. J. Genet. 65, 135–152.
- Endo, T. R. (2007) The gametocidal chromosome as a tool for chromosome manipulation in wheat. Chromosome Res. 15, 67–75.
- Endo, T. R., and Gill, B. S. (1996) The deletion stocks of common wheat. J. Hered. 87, 295–307.
- Gerlach, W. L., and Bedbrook, J. R. (1979) Cloning and characterization of ribosomal RNA genes from wheat and barley. Nucl. Acids Res. 7, 1869–1885.
- Hori, K., Takehara, S., Nankaku, N., Sato, K., Sasakuma, T., and Takeda, K. (2007) Barley EST markers enhance map saturation and QTL mapping in diploid wheat. Breeding Sci. 57, 39–45.
- Howe, C. J., Fearnley, I. M., Walker, J. E., Dyer, T. A., and Gray, J. C. (1985) Nucleotide sequences of the genes for the alpha, beta and epsilon subunits of wheat chloroplast ATP synthase. Plant Mol. Biol. 4, 333–345.
- Islam, A. K. M. R. (1983) Ditelosomic additions of barley chromosomes to wheat. In: Proc. 6th Intl. Wheat Genet. Symp. (ed.: Sakamoto, S.), pp. 233–238. Plant Germplasm Institute, Kyoto Univ., Kyoto, Japan.
- Islam, A. K. M. R., and Shepherd, K. W. (2000) Isolation of a fertile wheat-barley addition line carrying the entire barley chromosome 1H. Euphytica 111, 145–149.
- Islam, A. K. M. R., Shepherd, K. W., and Sparrow, D. H. B. (1981) Isolation and characterization of euplasmic wheat-barley chromosome addition lines. Heredity 46, 161–174.
- Jiang, J., Friebe, B., and Gill, B. S. (1994) Recent advances in alien gene transfer in wheat. Euphytica 73, 199–212.
- Joshi, G. P., Nasuda, S., and Endo, T. R. (2011) Dissection and cytological mapping of barley chromosome 2H in the genetic background of common wheat. Genes Genet. Syst. 86, 231–248.
- Karafiátová, M., Bartoš, J., Kopecký, D., Ma, L., Sato, K., Houben, A., Stein, N., and Doležel, J. (2013) Mapping nonrecombining regions in barley using multicolor FISH. Chromosome Res. 21, 739–751.
- Linde-Laursen, I., Heslop-Harrison, J. S., Shepherd, K. W., and Taketa, S. (1997) The barley genome and its relationship with the wheat genomes. A survey with an internationally agreed recommendation for barley chromosome nomenclature. Hereditas 126, 1–16.
- Lucas, S. J., Akpınar, B. A., Kantar, M., Weinstein, Z., Aydınoğlu, F., Šafář, J., Šimková, H., Frenkel, Z., Korol, A., Magni, F., et al. (2013) Physical mapping integrated with syntenic analysis to characterize the gene space of the long arm of wheat chromosome 1A. PLoS One 8, e59542.
- Masoudi-Nejad, A., Nasuda, S., McIntosh, R. A., and Endo, T. R. (2002) Transfer of rye chromosome segments to wheat by a gametocidal system. Chromosome Res. 10, 349–357.
- Masoudi-Nejad, A., Nasuda, S., Bihoreau, M.-T., and Endo, T. R. (2005) An alternative to radiation hybrid mapping for large-scale genome analysis in barley. Mol. Genet. Genomics. 274, 589–594.
- Mayer, K. F. X., Martis, M., Hedley, P. E., Šimková, H., Liu, H., Morris, J. A., Steuernagel, B., Taudien, S., Roessner, S., Gundlach, H., et al. (2011) Unlocking the barley genome by chromosomal and comparative genomics. Plant Cell 23, 1249–1263.
- Mayer, K. F. X., Waugh, R., Brown, J. W. S., Schulman, A., Langridge, P., Platzer, M., Fincher, G. B., Muehlbauer, G. J., Sato, K., Close, T. J., et al. (2012) A physical, genetic and functional sequence assembly of the barley genome. Nature 491, 711–716.
- Muñoz-Amatriaín, M., Moscou, M. J., Bhat, P. R., Svensson, J. T., Bartoš, J., Suchánková, P., Šimková, H., Endo, T. R., Fenton, R. D., Lonardi, S., et al. (2011) An improved consensus linkage map of barley based on flow-sorted chromosomes and single nucleotide polymorphism markers. Plant Genome 4, 238–249.
- Nasuda, S., Kikkawa, Y., Ashida, T., Islam, A. K. M. R., Sato, K., and Endo, T. R. (2005) Chromosomal assignment and deletion mapping of barley EST markers. Genes Genet. Syst. 80, 357–366.
- Paux, E., Sourdille, P., Salse, J., Saintenac, C., Choulet, F., Leroy, P., Korol, A., Michalak, M., Kianian, S., Spielmeyer, W., et al. (2008) A physical map of the 1-gigabase bread wheat chromosome 3B. Science 322, 101–104.
- Philippe, R., Paux, E., Bertin, I., Sourdille, P., Choulet, F., Laugier, C., Šimková, H., Šafář, J., Bellec, A., Vautrin, S., et al. (2013) A high density physical map of chromosome 1BL supports evolutionary studies, map-based cloning and sequencing in wheat. Genome Biol. 14, R64.
- Raats, D., Frenkel, Z., Krugman, T., Dodek, I., Sela, H., Šimková, H., Magni, F., Cattonaro, F., Vautrin, S., Bergès, H., et al. (2013) The physical map of wheat chromosome 1BS provides insights into its gene space organization and evolution. Genome Biol. 14, R138.
- Saghai-Maroof, M. A., Soilman, K. M., Jorgensen, R. A., and Allard, R. W. (1984) Ribosomal DNA spacer-length polymorphism in barley: Mendelian inheritance, chromosomal location, and population dynamics. Proc. Natl. Acad. Sci. USA 81, 8014–8018.
- Sakai, K., Nasuda, S., Sato, K., and Endo, T. R. (2009) Dissection of barley chromosome 3H in common wheat and comparison of 3H physical and genetic maps. Genes Genet. Syst. 84, 25–34.
- Sakata, M., Nasuda, S., and Endo, T. R. (2010) Dissection of barley chromosome 4H in common wheat by the gametocidal system and cytological mapping of chromosome 4H with EST markers. Genes Genet. Syst. 85, 19–29.
- Sato, K., Nankaku, N., and Takeda, K. (2009) A high-density transcript linkage map of barley derived from a single population. Heredity 103, 110–117.
- Serizawa, N., Nasuda, S., Shi, F., Endo, T. R., Prodanovic, S., Schubert, I., and Künzel, G. (2001) Deletion-based physical mapping of barley chromosome 7H. Theor. Appl. Genet. 103, 827–834.
- Shi, F., and Endo, T. R. (1997) Production of wheat-barley disomic addition lines possessing an Aegilops cylindrica gametocidal chromosome. Genes Genet. Syst. 72, 243–248.
- Shi, F., and Endo, T. R. (1999) Genetic induction of structural changes in barley chromosomes added to common wheat by a gametocidal chromosome derived from Aegilops cylindrica. Genes Genet. Syst. 74, 49–54.
- Shi, F., and Endo, T. R. (2000) Genetic induction of chromosomal rearrangements in barley chromosome 7H added to common wheat. Chromosoma 109, 358–363.
;%0A%09%09%09newWindow.document.open();%0A%09%09%09newWindow.document.write('<img src=%22./Graphics/89_203_tbl_2.jpg%22>');%0A%09%09%09newWindow.document.close();%0A%09%09)
;%0A%09%09%09newWindow.document.open();%0A%09%09%09newWindow.document.write('<img src=%22./Graphics/89_203_tbl_3.jpg%22>');%0A%09%09%09newWindow.document.close();%0A%09%09)