ABSTRACT
The long-tailed goral, Naemorhedus caudatus, is an internationally endangered species. This species is distributed throughout Northeastern Asia including Northeastern China, the Russian Far East and the Korean peninsula. The population size of long-tailed gorals is currently decreasing in South Korea, and thus effective conservation of the animal is urgently needed. Although the evolution and phylogeny of this animal have been studied, population genetic studies are needed to design effective conservation and management strategies. To evaluate the present status of genetic diversity and genetic structure of long-tailed gorals in South Korea, we investigated genetic variability among 68 goral individuals from different regions, including 11 captive zoo animals, at 12 microsatellite loci. The level of genetic diversity was moderate in wild goral populations, but lower in the captive group. The goral population from the lower northeast region of South Korea was distinct from the upper northeast population, probably due to the natural climatic and geographic conditions. The genetic characteristics of the captive group were more similar to those of the upper northeast population than the lower northeast, confirming that the zoo animals originated in the Seorak Mountain range. Direct translocations between the upper and lower northeast populations are not currently recommended considering the natural population structure and the moderate levels of genetic diversity in the two populations. This study highlights the importance of genetic information in designing effective conservation strategies and translocations of endangered animals, including the Korean goral.
INTRODUCTION
The long-tailed goral, Naemorhedus caudatus, is distributed throughout Northeastern Asia, across the Russian Far East (Primorsky and Khabarovsk Territories), Northeastern China and the Korean peninsula (Wilson and Reeder, 2005). Recent taxonomic inference has led to the proposal that the Caprinae subfamily includes 35 species, which can be grouped into 14 genera (Ropiquet and Hassanin, 2005a, 2005b; Wilson and Reeder, 2005). However, their phylogenetic relationships and systematics have been controversial for many years (Mucci et al., 1998), due in part to the limitation of sampling in mountainous habitats. Extreme climate and difficult terrain have led to a poor fossil record, and paleontological evidence has therefore been of little help in phylogenetic reconstructions of this group (Groves and Shields, 1996; Hassanin et al., 1998a).
Currently, Caprinae is subdivided into three tribes, Rupicaprini, Ovibovini and Caprini (Geist, 1987; Gentry, 1992). The long-tailed goral, N. caudatus, belongs to Rupicaprini along with three other genera: Rupicapra, Capricornis and Oreamnos (Nowak, 1991; Hassanin et al., 1998b). Four species are currently recognized in the genus Naemorhedus (Duckworth et al., 2008). Molecular evolutionary studies have revealed that Naemorhedus (gorals) and Capricornis (serows) represent a basal evolutionary lineage among the Caprinae (Mucci et al., 1998). Hence, phylogenetic analysis of either of these two genera would significantly improve our understanding of the Caprinae subfamily.
Internationally, the long-tailed goral is categorized as a vulnerable species by IUCN (2008) and is listed in Appendix I of CITES, which prohibits commercial trade of this species (Hutton and Dickson, 2000; Duckworth et al., 2008). Numerous ecological and molecular studies have been conducted on long-tailed gorals from Russia and South Korea. Bromley (1977) estimated the total number of gorals in the Russian populations to be between 600 and 750 individuals. Myslenkov and Voloshina (1989) later concluded that there had been no decline in the number of individuals or known populations. However, due to persistent overexploitation, the Russian goral has been listed as a Category I species in the Russian Red Data Book (Borodin, 1984).
In South Korea, goral populations have drastically diminished due to human activities including habitat destruction and poaching, as well as weather events such as heavy snowfall. Of 21 reported goral habitats, inhabited by 690–784 individuals, only four maintain more than 100 individuals (Ministry of Environment of Korea, 2002). Thus, the long-tailed goral is designated as an endangered species by the South Korean government (Ministry of Environment of Korea, 2004), and as a natural monument (No. 217; Cultural Properties Administration).
Since the genetic diversity of Korean goral populations is decreasing (Kim et al., 2004a), there is an urgent need to develop conservation projects to promote the recovery of both population size and distribution. Knowledge of the species’ taxonomic status and population genetic structure is fundamental to developing effective strategies to this end (Lorenzini et al., 2004). Inter- and intraspecific phylogenetic knowledge also would help clarify the species’ biology, and would resolve appropriate conservation and management units for this species (An, 2006). During the past decade, molecular analyses of N. caudatus have been reported. Min et al. (2004) confirmed the phylogenetic relationship between long-tailed gorals and Japanese serows using partial mitochondrial DNA sequence, and also revealed that a Korean goral population is genetically closer to Russian than to Chinese populations. Kim et al. (2004a) screened 34 Bovidae microsatellite markers through cross-species amplification of N. caudatus, and noted that the Korean goral population has the lowest level of heterozygosity among the Caprinae subfamily including goats, Alpine ibex and Spanish ibex. Additionally, An et al. (2005) characterized 15 goral-specific microsatellite loci, and Kim et al. (2008) reported molecular methods for species identification and sex determination for ungulate species of Korea. Recently, the complete mitochondrial genome (16,519 bp) of long-tailed goral was sequenced (Jang and Hwang, 2010) and eight additional novel microsatellite loci were developed (An et al., 2010). However, no population genetic study among geographic populations of long-tailed goral in Korea has yet been conducted.
This study aimed to investigate the extant level of genetic diversity and population structure of the endangered long-tailed goral, N. caudatus, in South Korea using 12 previously developed microsatellite markers. Knowledge of geographic patterns and the effects of natural processes on the present status of genetic variation and genetic structure of long-tailed goral in South Korea will provide important scientific grounds for establishing effective conservation and management strategies for this endangered species in South Korea.
MATERIALS AND METHODS
Sample collection and microsatellite genotyping
A total of 68 samples of long-tailed goral, mostly tissue, blood and skeleton samples, were collected in this study. This experimental work was conducted with the permission of the Conservation Genome Resource Bank for Korean Wildlife (CGRB), which provided goral samples for this study. All samples were legally collected and deposited into CGRB. The procedures involving animal samples followed the guidelines of the Seoul National University Institutional Animal Care and Use Committee. Samples were collected from mountain habitats of the species along the east coast of the South Korean peninsula (Fig. 1 and Supplementary Table S1). There are four main habitats where more than 100 individuals are resident, namely the Demilitarized Zone in the northeast part of Gangwon Province, the Yanggu-Hwachen region, Seorak Mountain, and the Uljin-Samcheok-Bongwha region (Yang, 2002). Three of these are located in the Seorak Mountain range in the upper northeast region (designated KNE_A wild, n = 30), including Goseong, Hwacheon, Yanggu, Inje and Yangyang. The fourth is located outside the Seorak Mountain range in the lower northeast region (designated KNE_B, n = 23), including Samcheok and Uljin. The source area of four sample specimens was not reported (ND), and 11 samples were collected from captive animals in the Everland zoo in Yongin (KNE_A captive); their original provenance is believed to be Seorak Mountain, from where these individuals were rescued (Table 1).
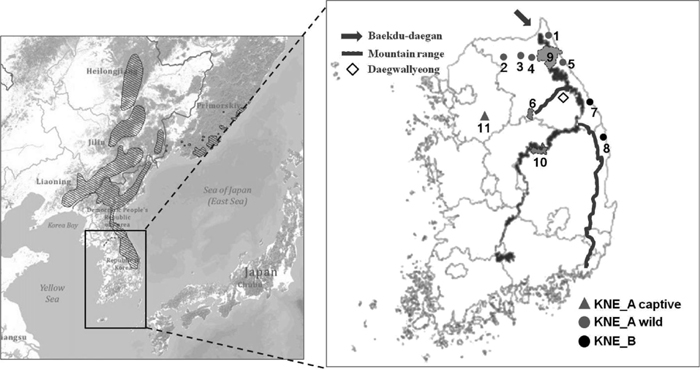
Table 1. Genetic diversity estimates for long-tailed gorals from South Korea
| Location | N | Allelic diversity (Ad) | Allelic richness (Ar) | HE | HO | FIS |
|---|
| Everland zoo (KNE_A captive) | 11 | 3.17 | 3.11 | 0.554 | 0.676 | –0.235 NS |
| Upper northeast region (KNE_A wild) | 30 | 5.08 | 4.23 | 0.697 | 0.603 | 0.137* |
| Lower northeast region (KNE_B) | 23 | 4.17 | 3.72 | 0.630 | 0.640 | –0.017 NS |
| Not determined (ND) | 4 | | | | | |
N, number of samples; Ad, mean number of alleles; HE, expected heterozygosity; HO, observed heterozygosity; FIS, inbreeding coefficients. *Significant, NSnot significant, after Bonferroni correction to adjusted nominal level (5%), P = 0.00139.
All samples were stored at –70 ℃ until DNA extraction. Genomic DNA was isolated using the DNeasy Blood and Tissue Kit or Gentra Puregene Tissue Kit (QIAGEN) according to the manufacturer’s instructions. In this study, we tested 13 polymorphic microsatellite markers developed for N. caudatus (An et al., 2005, 2010), of which 12 were selected based on good readability and low frequency of null alleles as indicated by Micro-Checker 2.2.3 (Van Oosterhout et al., 2004). One marker showed a significant level of null alleles for two wild populations (KNE_A wild and KNE_B), and was therefore excluded from further analyses. Although another marker, SY112, exhibited null alleles in the KNE_A wild population, this also could be caused by population subdivision in the region. Genetic characteristics of individual markers for long-tailed gorals for each of the sampling regions are shown in Supplementary Table S2. The microsatellite loci were amplified by a touchdown PCR strategy using the Multiplex PCR Kit (QIAGEN). Individuals were genotyped using a DNA Sequencer (ABI Prism 3730 XL DNA Analyzer, Applied Biosystems).
Data analysis
Genetic diversity measures were calculated using the Microsatellite Tool Kit (Park, 2001), including mean number of alleles (Ad) per locus, observed heterozygosity (HO), and expected heterozygosity (HE) under Hardy-Weinberg assumptions. Allelic richness (Ar), based on a rarefaction approach, and mean inbreeding coefficient (FIS) across all loci for each population were computed using FSTAT v.2.9.3 (Goudet, 1995). The level of genetic differentiation, FST, between each pair of populations and its significance based on a permutation approach were calculated by FSTAT v.2.9.3. The sequential Bonferroni correction was applied when testing significance in multiple comparisons. Indirect estimates of gene flow (Nm, effective number of migrants per generation) among populations were calculated from FST using the equation of Wright (1943). Principal coordinates analysis (PCA), based on genotypic distance, and frequency-based assignment tests were used to visualize genetic relationships among groups using GenAlex v.6.0 (Peakall and Smouse, 2006). STRUCTURE 2.3.3 software (Pritchard et al., 2000) was employed to demonstrate the existence of population structure. The number of MCMC (Markov chain Monte Carlo) steps was set to 200,000 after a burn-in period of 100,000 using the default parameters of an admixture model. Ten iterations were carried out for each K, from 1 to 5, to quantify the amount of variation in the likelihood value. The number of inferred clusters was estimated based on the method of Evanno et al. (2005).
Direct assignment and exclusion tests were conducted to identify probable immigrants and their origins, as well as source localities for samples of unknown provenance, using the program GeneClass 2 (Piry et al., 2004). A direct assignment approach, and the exclusion method using a simulation approach based on allele frequencies of each reference population (Cornuet et al., 1999), were carried out at a threshold of 0.05 using the Bayesian statistical method (Rannala and Mountain, 1997).
Pairwise relatedness (r) was estimated based on methods of Lynch and Ritland (1999) and Queller and Goodnight (1989) using GenAlex v.6.0 (Peakall and Smouse, 2006) to detect kinship within and between goral populations. For the Lynch and Ritland (1999) method (LRM), an r value close to 0.5 indicates an identical twin, a value close to 0.25 indicates a full sibling relationship (parents and offspring, or siblings that share the same parents), and a value of 0.125 indicates a half sibling (one shared parent). In the Queller and Goodnight (1989) method (QGM), r values around 1, 0.5 and 0.25 correspond to identical, full and half siblings, respectively. However, caution must be exercised when interpreting genetic relatedness, because the LRM and QGM methods using microsatellite data are based on genotypic similarity that can vary according to allele frequencies of a population. However, these genetic relatedness data are still informative in estimating relative kinship among individuals.
Evidence of a recent reduction in effective population size (Ne) was explored using three different approaches. Individuals from the zoo (KNE_A captive) were excluded from bottleneck tests due to the small sample size, as well as their being from a captive population. The Wilcoxon sign-rank test was conducted to determine whether a population exhibits significant heterozygosity excess relative to expected heterozygosity at mutation-drift equilibrium, using BOTTLENECK 1.2 (Cornuet and Luikart, 1996; Piry et al., 1999). Under the Wilcoxon sign-rank test, a stepwise mutation model (SMM) and a two-phase model (TPM) that employs 90% probability for the SMM and 10% for variance among mutation lengths were applied using 1,000 iterations (Di Rienzo et al., 1994). A mode-shift in allele frequency distribution was used as a qualitative indicator for detecting a recent bottleneck event (Luikart et al., 1998). Finally, Garza and Williamson’s M ratio and its variance across loci were calculated using the program AGARst (Harley, 2001) to detect evidence of a reduction in population size many more generations in the past than tested by the two methods mentioned above (Garza and Williamson, 2001).
RESULTS
A total of 67 alleles were found across the 12 microsatellite loci for 68 N. caudatus individuals from South Korea. Fifteen alleles from wild populations (11 for KNE_A wild and four for KNE_B) and two alleles from captive zoo individuals (KNE_A captive) turned out to be private alleles. Long-tailed gorals from the upper northeast region (KNE_A wild) in South Korea showed a higher level of genetic diversity (Ad = 5.08, Ar = 4.23, HE = 0.697) than the other groups (Table 1). Zoo individuals (KNE_A captive) had the lowest genetic diversity (Ad = 3.17, Ar = 3.11, HE = 0.554), with 21% lower expected heterozygosity (HE) than KNE_A wild. However, the highest observed heterozygosity (HO) was present (HO = 0.676) among KNE_A captive individuals. The lower northeast region (KNE_B) showed an intermediate level of genetic diversity. A significant inbreeding coefficient (FIS = 0.137) was detected only in the KNE_A wild population (Table 1).
Genetic differentiation (FST) was significant among all pairs of long-tailed goral populations (Table 2). The FST value between KNE_A wild and KNE_B is comparable to that between KNE_A captive and KNE_A wild, but was relatively high between KNE_B and KNE_A captive. Indirect estimates of gene flow (Nm) between populations ranged from 1.291 in KNE_B vs. KNE_A captive to 2.955 in KNE_A wild vs. KNE_A captive.
Table 2. Genetic differentiation (pairwise
FST, below diagonal) and gene flow estimates (
Nm, above diagonal) among geographic populations of long-tailed gorals from South Korea
| KNE_A captive | KNE_A wild | KNE_B |
|---|
| Korea Everland zoo (KNE_A captive) | | 2.955 | 1.291 |
| Korea northeast _A (KNE_A wild) | 0.078* | | 2.712 |
| Korea northeast _B (KNE_B) | 0.162* | 0.084* | |
* Significant after Bonferroni correction (
P < 0.05). Indirect indicator of gene flow (
Nm) was calculated among geographic populations using the equation,
Nm = 1/4{(1–
FST)/
FST} (
Wright, 1943).
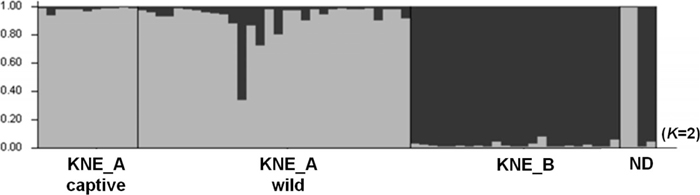
Model-based genetic cluster analyses inferred two genetic clusters from long-tailed gorals in South Korea (Fig. 2). The two major genetic clusters correspond to the following genetic populations: 1) KNE_A wild together with KNE_A captive, and 2) KNE_B. These populations showed distinct genetic compositions, although a few individuals from KNE_A wild shared some similarity with the major cluster of the KNE_B population (Fig. 2). Two of four unknown samples (ND) were allocated to each of the two genetic clusters.
Two principal components from the PCA analysis based on genotypic distance accounted for 43.34% of the total genetic variance (Fig. 3). Although the scattergram did not clearly differentiate all populations, PC1 (x-axis = 23.36%) separated the KNE_A wild and KNE_A captive from KNE_B. PC2 (y-axis = 19.98%) weakly differentiated KNE_A captive from KNE_A wild individuals (Fig. 3). Two of the four unknown samples belonged to KNE_A wild and two to KNE_B.

The pairwise assignment of individuals between goral groups also showed individuals belonging to their respective collection area (Supplementary Fig. S1). Most individuals were assigned to their collected populations. However, one individual from KNE_A captive was assigned to KNE_A wild (61.9%), and three individuals from KNE_A wild were assigned to KNE_A captive (81.8, 85.1 and 99.9% each). The assignment test identified probable source populations for the four individuals of unknown provenance. Two individuals each were assigned to the KNE_A wild population (83 and 98%) and KNE_B population (both 100%) (data not shown). However, the exclusion method indicated that the two individuals allocated to KNE_A wild by the assignment method did not belong to either KNE_A wild or KNE_B.
Pairwise relatedness (r), or kinship, among each pair of individual gorals showed similar trends based on two methods, LRM and QGM (Table 3). Of 2,278 total pairwise comparisons, 7.55% in LRM and 11.15% in QGM appeared to share possible kinship. The highest proportion of kinship was observed within KNE_A captive (63.6% in LRM; 78.2% in QGM), whereas the proportion of kinship between KNE_A wild and KNE_B was relatively low (0.43% in LRM; 3.48% in QGM). The kinship among individuals within KNE_A wild was less than 10% according to both methods, and was comparable to the level of kinship between KNE_A captive and KNE_A wild. Two of the four unknown samples were genetically more closely related to KNE_B than to KNE_A wild.
Table 3. Genetic relatedness (
r) among long-tailed gorals from South Korea according to the
Lynch and Ritland (1999) method (LRM) and the
Queller and Goodnight (1989) method (QGM)
| Population | | No. of comparisons | LRM (%) | QGM (%) |
|---|
| r = 0.5 | 0.25 ≤
r < 0.5 | 0.125 ≤
r < 0.25 | Total | r = 1 | 0.5 ≤
r < 1 | 0.25 ≤
r < 0.5 | Total |
|---|
| All individuals | | 2278 | 0.26 | 1.27 | 6.01 | 7.55 | 0.26 | 1.80 | 9.09 | 11.15 |
| Within population | KNE_A(C) | | 55 | 5.45 | 23.64 | 34.55 | 63.64 | 5.45 | 21.82 | 50.91 | 78.18 |
| KNE_A(W) | | 435 | 0.23 | 1.61 | 5.98 | 7.82 | 0.23 | 1.15 | 8.51 | 9.89 |
| KNE_B | | 253 | 0.40 | 2.37 | 20.55 | 23.32 | 0.40 | 4.74 | 23.72 | 28.85 |
| NA | | 6 | 0.00 | 0.00 | 16.67 | 16.67 | 0.00 | 16.67 | 0.00 | 16.67 |
| Between populations | KNE_A(C) | KNE_A(W) | 330 | 0.30 | 0.61 | 8.18 | 9.09 | 0.30 | 2.73 | 9.70 | 12.73 |
| KNE_A(C) | KNE_B | 253 | 0.00 | 0.00 | 0.00 | 0.00 | 0.00 | 0.00 | 3.16 | 3.16 |
| KNE_A(C) | NA | 44 | 0.00 | 0.00 | 2.27 | 2.27 | 0.00 | 0.00 | 0.00 | 0.00 |
| KNE_A(W) | KNE_B | 690 | 0.00 | 0.00 | 0.43 | 0.43 | 0.00 | 0.14 | 3.33 | 3.48 |
| KNE_A(W) | NA | 120 | 0.00 | 0.00 | 0.00 | 0.00 | 0.00 | 0.00 | 0.83 | 0.83 |
| KNE_B | NA | 92 | 0.00 | 1.09 | 8.70 | 9.78 | 0.00 | 1.09 | 19.57 | 20.65 |
KNE_A (C), KNE_A captive; KNE_A (W), KNE_A wild.
A signature of a recent bottleneck was detected for both wild populations under the TPM model (< 0.05) (Table 4). However, the distribution of allele frequencies for all populations does not deviate from the L-shape mode indicative of a stable population. Garza and Williamson’s M values ranged from 0.635 to 0.713, displaying evidence of a bottleneck (i.e., M < 0.68) in the KNE_B population sometime many generations in the past. Population KNE_A wild showed a marginal value of M around 0.68, perhaps a lingering signature of a population bottleneck long ago (Table 4).
Table 4. Tests to detect a population bottleneck event within long-tailed goral populations from South Korea
Location
(Abbr.) | Wilcoxon sign-rank testsa | Mode shift | Mb |
|---|
| SMM | TPM |
|---|
| KNE_A wild | 0.032 | 0.001 | Normal | 0.713 (0.059) |
| KNE_B | 0.190 | 0.005 | Normal | 0.635 (0.068) |
a One-tail probability that excess of observed heterozygosity relative to the expected equilibrium heterozygosity is due to chance, computed from the observed number of alleles under mutation-drift equilibrium. SMM, stepwise mutation model; TPM, two-phased model of mutation.
b M = mean ratio of the number of alleles to the range of allele size (Garza and Williamson, 2001); variance in parentheses.
DISCUSSION
Genetic diversity
The main objectives of this study were to determine the level of genetic variability and to elucidate genetic structure of long-tailed gorals, N. caudatus, in South Korea, which will help to clarify the level of genetic connectivity and genetic relatedness across geographical regions.
Wild populations of long-tailed gorals (KNE_A wild, KNE_B) showed moderate levels of genetic diversity (HE = 0.697 and 0.630; HO = 0.603 and 0.640, respectively), compared to the Japanese serow (Capricornis crispus), which belongs to the same tribe Rupicaprini in Caprinae. The subset of microsatellite markers used in this study indicated a relatively low level of genetic diversity in two Japanese serow populations (HE = 0.602 and 0.456; HO = 0.4 and 0.28, respectively) (unpublished data). Alpine chamois (Rupicapra rupicapra rupicapra) and Tatra chamois (R. r. tatrica), also in the tribe Rupicaprini, showed much lower genetic diversity (HE = 0.383 and 0.227; HO = 0.396 and 0.223, respectively) than N. caudatus and C. crispus (An et al., 2010; J. An, personal communication). Zoo animals (KNE_A captive), which were rescued from Seorak Mountain and its vicinity (the same area as the KNE_A wild population) and subsequently bred in captivity, showed the lowest level of genetic diversity among Korean gorals (Table 1). However, the observed heterozygosity was higher than expected in the KNE_A captive population. This could be due to an isolation-breaking effect such as the mixing and interbreeding of individuals from two previously isolated populations, although sampling error owing to a small sample size of heterozygous gorals cannot be ruled out.
The inbreeding coefficient (FIS) was significant in the population KNE_A wild. This may be due to a Wahlund effect, the reduction of observed heterozygotes caused by admixture of subpopulations with different genetic constitutions, as suggested by irregular genetic compositions in the structure analysis (Fig. 2 and Supplementary Fig. S3).
Population structure and origin of captive individuals
The degree of genetic differentiation (FST) between two wild populations (KNE_A wild and KNE_B) was not strong but was significant (FST = 0.084; Table 2). Similar patterns of low but significant genetic differentiation (FST) between wild animal populations have been observed in other Rupicaprini species such as Japanese serow, with limited gene flow at a regional scale. Although two wild populations of Japanese serow showed a higher level of genetic differentiation from each other (FST = 0.255), the distance between the populations was about 360 km (unpublished data), whereas the distance between KNE_A wild and KNE_B long-tailed goral populations ranged from 84 to 174 km. These comparisons demonstrate the level of genetic differentiation among populations of Rupicaprini species in mountainous habitats that might be common at a regional scale. The moderate FST value indicates a certain amount of gene flow between KNE_A wild and KNE_B populations. Together with the relatively lower genetic diversity in the KNE_B region, this implies that the gorals in the lower northeast region (KNE_B) represent a colonizing population from the source population KNE_A wild. Migration and subsequent colonization from the upper to the lower northeast region is a reasonable scenario, because the KNE_B region is regarded as one of the southernmost distribution boundaries of N. caudatus (Yang, 2002), and thus lower genetic diversity in the KNE_B region is expected as an example of peripheral isolation. Although gorals in the KNE_B region could have colonized/migrated from the potential source population KNE_A wild, a rigorous genetic study using more samples from a wide range of geographic locations is required to address this question.
Genetic differentiation and population structure analyses showed that individuals of the KNE_A captive population originated from local areas within the upper northeast region harboring the KNE_A wild population (Tables 2 and 3, Fig. 2, Supplementary Fig. S3). The geometric patterns of genetic variance visualized by PCA likewise indicate that KNE_A captive is genetically closer to the KNE_A wild population than to KNE_B (Fig. 3). This is consistent with the results of the structure analysis showing a similar genetic cluster containing KNE_A captive and KNE_A wild individuals. Nevertheless, the FST between KNE_A captive and KNE_A wild was comparable to that between two wild populations, KNE_A wild and KNE_B (Table 2 and Fig. 3). It is probable that the zoo gorals (KNE_A captive) have been completely isolated genetically from wild populations during their captivity. The existence of a subset of KNE_A wild genetic composition in KNE_A captive when K = 3 in the structure analysis supports the genetic isolation of KNE_A captive (Supplementary Fig. S3).
Unfortunately, detailed information on the founders, breeding and pedigree of the captive population is not available, but it is known that the population originated from a small number of individuals rescued from areas around Seorak Mountain in the 1980s. The current study confirms the geographic origin of the captive population by showing the close association of the KNE_A captive and KNE_A wild populations. In addition, the assignment test reveals the possible origin of four goral samples for which no information was previously available. One of the samples of unknown origin was a carcass found beside the Yeongdong Expressway near Yongin in 2010. The sample was assigned to the KNE_B wild population, implying that the animal might have been poached from the KNE_B wild habitat and abandoned for some reason near Yongin.
The relatedness (r) analysis revealed different levels of genetic relatedness within KNE_A wild and KNE_B, indicating a difference in genetic connectivity and habitat range for each population. Closely related kin within KNE_B suggest relatively smaller habitat ranges and smaller population size than within the KNE_A region. The observed low level of relatedness between KNE_A wild and KNE_B also indicates that these populations are genetically distinct with restricted gene flow between them. However, interpreting results of relatedness analysis among populations must be done with caution, because sampling error caused by small sample size can lead to biased estimates of population allele frequencies (Wang, 2002; Blouin, 2003). In addition to breeding among captive individuals, a potential explanation for the high level of kinship within KNE_A captive is that a goral kinship group was rescued by chance.
Population differentiation
Geographically, the goral habitats in South Korea are connected through the Baekdu-daegan mountain range, which runs most of the length of the eastern peninsula, from Baekdu Mountain in the north to Jiri Mountain in the south. The habitats of KNE_A wild and KNE_B are also directly connected through the Baekdu-daegan mountain range as well as the other mountainous goral habitats (Kim et al., 2004b). Nevertheless, the genetic data in this study indicate that two genetically structured populations, KNE_A wild and KNE_B, exist in major habitats of long-tailed goral in South Korea.
Two possibilities could explain the population differentiation between KNE_A wild and KNE_B: 1) human-made barriers and environmental changes that occurred in relatively recent years; and 2) natural environmental conditions that have existed for hundreds or thousands of years.
Artificial barriers such as the Yeongdong Expressway, tourist facilities and highland agriculture in Daegwallyeong could be factors in maintaining differentiation between KNE_A wild and KNE_B populations. Daegwallyeong is a mountain pass that branched out west from the Baekdu-daegan to Chiak Mountain (Fig. 1). The Yeongdong Expressway was constructed in the early 1970s and tourist facilities such as ski resorts have been established in this area. In addition, slash-and-burn farmers lived in these mountain areas probably from the 19th century until the 1960s, leading to destruction of wildlife habitat by deforestation (Yoon, 2009). However, such artificial barriers are unlikely to be a major cause of goral population differentiation because the elapsed time is insufficient to generate the current level of population structure. The same pattern of population differentiation was also revealed in a study using mitochondrial DNA analysis (unpublished data).
Natural barriers may include climatic, landscape and ecological factors. Daegwallyeong, the mountain pass that corresponds to the boundary between KNE_A wild and KNE_B, is a mountainous plateau with an elevation of over 800 m. This plateau is not a habitat ideally suited to gorals, which usually inhabit steep rocky slopes. Moreover, this area is one of the heaviest snowfall regions in South Korea, with annual snow cover reaching more than 900 mm (Lee et al., 2007; Kim et al., 2010). Heavy snow accumulation would contribute to the inappropriateness of the plateau as habitat for gorals and to its inefficiency as a corridor for habitat connectivity. Thus, the natural conditions of Daegwallyeong may have resulted in low population density in this region for a long time. Although several dozen individuals have been observed in this area (Ministry of Environment of Korea, 2002), densities of gorals may be too low to function as a natural bridge for effective gene flow between KNE_A wild and KNE_B.
Ecological characteristics of long-tailed gorals also could contribute to population isolation. Home ranges of long-tailed gorals vary depending on seasonal climate and on geographic factors such as natural barriers and habitat steepness, but are less than 1 km2 (Myslenkov and Voloshina, 1989; Ministry of Environment of Korea, 2002; Cho et al., 2014). This implies that members of this species are unlikely to disperse long distances from their birth site.
To sum up, both human-mediated and natural factors are possible contributors to genetic differentiation of long-tailed goral populations in South Korea. Although anthropogenic factors cannot be ignored, natural climatic and geographic conditions, as well as the sedentary behavior of this species, are the more likely mediators of genetic structuring between the two populations KNE_A wild and KNE_B.
Conservation implications
Conservation of N. caudatus is of urgent importance given its international classification as an endangered and protected species. A few genetic studies of N. caudatus, based on mitochondrial DNA, have focused on intra- or interspecific phylogenetic relationships, but limited information on population genetic diversity and structure is available (Koh et al., 2002; Min et al., 2004; An et al., 2010). In this study, the use of fast-evolving, co-dominant microsatellite markers provided appropriate resolution to assess population genetic structure and differentiation. The information reported here can help to establish proper management and conservation policy for this endangered species.
In this study, different genetic compositions were observed in different wild goral populations in South Korea (KNE_A wild and KNE_B). Weeks et al. (2011) suggested that genetically matched (genotypes) translocation and evolutionary genetic potential (or genetic adaptation) should be primarily considered to ensure that threatened populations can adapt to future environmental changes. However, designation of separate conservation units is not necessarily suggested for the management of the KNE_A wild and KNE_B populations of long-tailed gorals, because only one type of genetic marker (microsatellites) was examined in this study and the level of population differentiation indicated that some degree of gene flow exists.
Although KNE_B showed slightly lower genetic diversity than the KNE_A wild population, both exhibit a moderate level of genetic diversity, indicating that artificial translocation of individuals between KNE_A wild and KNE_B populations is not urgently required. Translocation or reintroduction of wild animals always involves a risk of injury to the translocated individuals and undesirable effects on the ecosystem, such as disease transmission and disturbance of the existing social structure. Thus, all wildlife conservation translocations should follow guidelines suggested by IUCN and must be carefully carried out only when there is an urgent, science-based reason, including a high level of expected benefit to the population and ecosystem affected (http://www.iucnsscrsg. org/).
As part of the conservation efforts for Korean gorals, a reintroduction project is currently being undertaken by the Species Restoration Technology Institute in South Korea. A total of 24 goral individuals from a zoo population and KNE_A wild population have been reintroduced or translocated into the Wolak Mountain area (Ministry of Environment of Korea, 2013). As confirmed in this study, because the zoo population originated from the KNE_A wild region, all reintroduced individuals are essentially from the KNE_A wild population. Animals have been released six times since 1994, and 43 individuals have been observed on Wolak Mountain, including individuals born in the wild (Ministry of Environment of Korea, 2013). Historically, Wolak Mountain was known to be a goral habitat, but the populations became locally extirpated, presumably in the mid-20th century (Woo, 1990). When geographic connectivity is considered, the historical Wolak Mountain population likely had more direct gene flow with the KNE_B population rather than the KNE_A wild population. This is because Wolak Mountain is closely connected through the Baekdu-daegan mountain range to the KNE_B region, with distances ranging only from 55 to 100 km, whereas Wolak Mountain and the KNE_A region are not directly connected by mountain ridges (Fig. 1). Thus, if the reintroduction project is necessary, translocation of gorals from the KNE_B population rather than from KNE_A wild population to Wolak Mountain would be preferable. The reintroduced population eventually will interact with the KNE_B population. Then, reintroduction using KNE_B population will not disturb the locally adapted genetic integrity of the KNE_B population (Weeks et al., 2011).
Translocations from the KNE_A wild population to Wolak Mountain have already been carried out. Nevertheless, at this stage, additional translocations between the KNE_A wild population and the KNE_B population are not recommended, because natural dispersal and interactions are expected between the population from Wolak Mountain and the KNE_B population in the near future. In that case, it will represent an increased opportunity for genetic introgression from the reintroduced population on Wolak Mountain (genetic traits of KNE_A wild) into the indigenous population (KNE_B) and vice versa, and contribute to an increase in the genetic diversity of both Wolak Mountain and KNE_B populations.
The current study emphasizes the importance of detailed studies on population structure and genetic diversity before any restoration policy is envisioned for an endangered species or population. In the future, it will be necessary to closely monitor the genetic diversity of goral populations in South Korea including KNE_A wild, KNE_A captive, KNE_B and reintroduced Wolak Mountain populations. In addition, the other populations which were not sampled in this study, including populations in and near the Demilitarized Zone (DMZ) between North and South Korea, will need to be studied. In particular, the goral populations inside the DMZ may have a compromised level of genetic diversity because they presumably have been isolated for more than five decades since the Korean War. However, they still can serve as the candidate flagship species of a ‘DMZ Peace Park’ proposed at the Eco Conference on the 60th anniversary of the DMZ, held in Goyang city in 2013.
Indications of a Wahlund effect in the upper northeast region (KNE_A wild) in this study imply that fine-scale conservation management within this region should be considered, because cryptic sub-populations likely exist. A detailed genetic study at the landscape genetics level would give important information on animal movements and interactions among sub-populations of Korean gorals. This would identify small, isolated populations that need more attention, and provide a sound scientific base to establish effective conservation policy for this highly endangered species (Schwartz et al., 2007). However, the difficulty of sampling is one of the major limitations in conducting genetic studies of endangered species, and makes routine genetic monitoring of the species difficult. Genetic materials can be obtained from non-invasive samples such as hair roots and feces, but precautions are required to ensure adequate DNA quality and purity for population genetic studies based on such samples. Empirical genetic monitoring using non-invasive samples of long-tailed gorals is underway for the lower northeast region (Ministry of Environment of Korea, 2011).
Illegal poaching is an important factor that can lead to population decline, and is a possible reason for the recent bottlenecks detected in both wild populations (Table 4). Using microsatellite markers, as in the present study, can help to identify an individual’s source population, and thus identify transfer routes for illegally captured animals.
In conclusion, this study reports the status of genetic diversity and the existence of population genetic structure in long-tailed gorals inhabiting South Korea. The moderate level of genetic diversity and genetic structuring of long-tailed gorals at regional scales within South Korea provides a scientific basis to design effective management and conservation strategies for wild, reintroduced and captive goral populations in South Korea. Any translocations or reintroductions of wild animal or plant species including endangered species, if necessary, should be planned considering natural evolutionary processes (Weeks et al., 2011). Fine-scale and landscape-level genetic research planning is recommended, as well as much wider-ranging phylogeographic and genetic diversity studies on goral populations to include the DMZ, North Korea, Russian Far East and Northeastern China populations.
ACKNOWLEDGMENTS
We gratefully acknowledge Dr. Thomas W. Sappington, USDA-ARS, for his critical comments and edits on this manuscript. We would like to express our deep gratitude to the CGRB and cooperators, including the Ministry of Environment of Korea, Daegu Regional Environmental Office, National Institute of Biological Resources (NIBR), Gangwon-do Wildlife Rescue Center, Gyeonggi-do Wildlife Rescue Center, Korea National Park, Association of Korean Goral Conservation, Korean Association for Bird Protection, Dong-Seo Bird Research Association, Seoul Grand Park, Grimm Park, Dong-Chul Lee, Prof. Junpei Kimura and D. V. M. Young-Jun Kim who prepared long-tailed goral samples for this study. This work was supported by a Korea Science and Engineering Foundation (KOSEF) grant funded by the Korean government (MEST) (No. 2009-0080227) and by the Research Institute for Veterinary Science, Seoul National University.
REFERENCES
- An, J. (2006) Development and characterization of microsatellite markers for endangered Korean goral (Nemorhaedus caudatus raddeanus) and its molecular phylogenetic status. PhD Thesis, Seoul National University, Seoul, Republic of Korea.
- An, J., Min, M.-S., Sommer, J., Louis, E., Brenneman, R., Kwon, S.-W., Shin, N. S., and Lee, H. (2005) Isolation and characterization of 15 microsatellite loci in the Korean goral (Nemorhaedus caudatus). Mol. Ecol. Notes 5, 421–423.
- An, J., Choi, S.-K., Sommer, J., Louis, E., Brenneman, R., Zemanova, B., Hajkova, P., Park, G., Min, M.-S., Kim, K.-S., and Lee, H. (2010) A core set of microsatellite markers for conservation genetics studies of Korean goral (Naemorhedus caudatus) and its cross-species amplification in Caprinae species. J. Vet. Sci. 11, 351–353.
- Blouin, M. S. (2003) DNA-based methods for pedigree reconstruction and kinship analysis in natural populations. Trends Ecol. Evol. 18, 503–511.
- Borodin, A. M. (ed.) (1984) USSR Red Data Book. Lesnaya Promyshlennost, Moscow, Russia.
- Bromley, G. F. (1977) Goral. Lesnaya Promyshlennost, Moscow, Russia.
- Cho, C.-U., Gyun, G.-H., Yang, J.-J., Lim, S.-J., Lee, A.-N., Park, H.-B., and Lee, B.-K. (2014) Home range and behavioral characteristics of the endangered Korea Gorals (Naemorhedus caudatus) with GPS collar. Korean J. Environ. Ecol. 28, 1–9.
- Cornuet, J.-M., and Luikart, G. (1996) Description and power analysis of two tests for detecting recent population bottlenecks from allele frequency data. Genetics, 144, 2001–2014.
- Cornuet, J. M., Piry, S., Luikart, G., Estoup, A., and Solignac, M. (1999) New methods employing multilocus genotypes to select or exclude populations as origins of individuals. Genetics, 153, 1989–2000.
- Di Rienzo, A., Peterson, A. C., Garza, J. C., Valdes, A. M., Slatkin, M., and Freimer, N. B. (1994) Mutational processes of simple-sequence repeat loci in human populations. Proc. Natl. Acad. Sci. USA 91, 3166–3170.
- Duckworth, J. W., MacKinnon, J., and Tsytsulina, K. (2008) Naemorhedus caudatus. The IUCN Red List of Threatened Species. Version 2014.3. <www.iucnredlist.org>
- Evanno, G., Regnaut, S., and Goudet, J. (2005) Detecting the number of clusters of individuals using the software STRUCTURE: a simulation study. Mol. Ecol. 14, 2611–2620.
- Garza, J. C., and Williamson, E. G. (2001) Detection of reduction in population size using data from microsatellite loci. Mol. Ecol. 10, 305–318.
- Geist, V. (1987) On the evolution of the Caprinae. In: The Biology and Management of Capricornis and Related Mountain Antelopes (ed.: H. Soma), pp. 3–40. Croon Helm, London, UK.
- Gentry, A. (1992) The subfamilies and tribes of the family Bovidae. Mammal Rev. 22, 1–32.
- Goudet, J. (1995) FSTAT (version 1.2): a computer program to calculate F-statistics. J. Hered. 86, 485–486.
- Groves, P., and Shields, G. (1996) Phylogenetic of the Caprinae based on cytochrome b sequence. Mol. Phylogenet. Evol. 5, 467–476.
- Harley, E. H. (2001) AGARst. A programme for calculating allele frequencies, GST and RST from microsatellite data, version 2. University of Cape Town, Cape Town, South Africa.
- Hassanin, A., Lecointre, G., and Tillier, S. (1998a) The “evolutionary signal” of homoplasy in protein-coding gene sequences and its consequences for a priori weighting in phylogeny. Comptes Rendus de l’Academie des Sciences Series III. 321, 611–620.
- Hassanin, A., Pasquet, E., and Vigne, J. (1998b) Molecular systematic of the subfamily Caprinae (Artiodactyla, Bovidae) as determined from cytochrome b sequences. J. Mamm. Evol. 5, 217–236.
- Hutton, J., and Dickson, B. (2000) Endangered species, threatened convention: the past, present and future of CITES. Earthscan Publications, London, UK.
- Jang, K., and Hwang, U. (2010) Complete mitochondrial genome of the Korean goral Naemorhaedus caudatus (Ruminantia, Bovidae, Antilopinae) and conserved domains in the control region of Caprini. Mitochondr. DNA. 21, 62–64.
- Kim, K.-S., Min, M.-S., An, J.-H., and Lee, H. (2004a) Cross-species amplification of Bovidae microsatellites and low diversity of the endangered Korean goral. J. Hered. 95, 521–525.
- Kim, Y. P., Im, E. S., and Kim, Y. J. (2004b) Restructing mountain systems in Korean Peninsula: Focusing on mountain range analysis. Korea Research Institute for Human Settlements press, Seoul.
- Kim, B. J., Lee, Y.-S., An, J.-H., Park, H.-C., Okumura, H., Lee, H., and Min, M.-S. (2008) Species and sex identification of the Korean goral (Nemorhaedus caudatus) by molecular analysis of non-invasive samples. Mol. Cells 26, 314–318.
- Kim, Y. S., Park, M. J., Kim, S. J., Moon, K. H., and Kim, H. S. (2010) Estimation of frequency based snowfall depth and maximum snowfall depth in 2010, Korea. 2010 Conference of Korea Water Resources Association, Seoul, p. 1476 (written in Korean).
- Koh, H. S., Yang, B. G., Lee, B. K., and Lee, J. H. (2002) Sequence diversity of mitochondrial cytochrome b gene in Grey goral Naemorhedus caudatus (Artiodactyla, Bovidae) from Korea. Korean J. Syst. Zool. 18, 1–21.
- Lee, J. J., Jung, Y. H., and Lee, S. W. (2007) A study on the evaluation of probable snowfall depth in Korea. Journal of Korean Society of Hazard Mitigation, 7, 53–63. (written in Korean with English abstract)
- Lorenzini, R., Posillico, M., Lovari, S., and Petrella, A. (2004) Noninvasive genotyping of the endangered Apennine brown bears: a case study not to let one’s hair down. Anim. Conserv. 7, 199–209.
- Luikart, G., Allendorf, F. W., Cornuet, J. M., and Sherwin, W. B. (1998) Distortion of allele frequency distributions provides a test for recent population bottlenecks. J. Hered. 89, 238–247.
- Lynch, M., Ritland, K. (1999) Estimation of pairwise relatedness with molecular markers. Genetics 152, 1753–1766.
- Min, M.-S., Okumura, H., Jo, D.-J., An, J.-H., Kim, K.-S., Kim, C.-B., Shin, N.-S., Lee, M.-H., Han, C.-H., Voloshina, I., and Lee, H. (2004) Molecular phylogenetic status of the Korean goral and Japanese serow based on partial sequences of the mitochondrial cytochrome b gene. Mol. Cells 17, 365–372.
- Ministry of Environment of Korea (2002) New technique for the restoration of endangered species in Korea. National Institute of Environmental Research, Korea.
- Ministry of Environment of Korea (2004) Wildlife protection act. Ministry of Government Legislation, Korea.
- Ministry of Environment of Korea, Daegu Regional Environmental Office (2011) Status of endangered species, Korean goral (Naemorhedus caudatus) using DNA analyses: ecosystem conservation zone, Wangpichen and surrounding areas of Nakdong river (Baekam Mt. and Geumjang Mt.) (written in Korean).
- Ministry of Environment of Korea (2013) Research of long-tailed goral including endangered species in Korea 2012 (written in Korean).
- Mucci, N., Randi, E., Gentile, L., Mari, F., and Locati, M. (1998) Mitochondrial cytochrome b sequence divergence among Spanish, Alpine and Abruzzo chamois (genus Rupicapra). Hystrix 10, 29–36.
- Myslenkov, A., and Voloshina, I. (1989) Ecology and behaviour of the Amur Goral. Nauka, Moscow.
- Nowak, R. (1991) Walker’s Mammals of the World. Johns Hopkins University Press, Baltimore, USA.
- Park, S. D. E. (2001) Trypanotolerance in West African cattle and the population genetic effects of selection. PhD thesis, University of Dublin, Dublin, Ireland.
- Peakall, R., and Smouse, P. E. (2006) GENALEX 6: genetic analysis in Excel. Population genetic software for teaching and research. Mol. Ecol. Notes 6, 288–295.
- Piry, S., Luikart, G., and Cornuet, J.-M. (1999) BOTTLENECK: A Computer program for detecting recent reduction in the effective population size using allele frequency data. J. Hered. 90, 502–503.
- Piry, S., Alapetite, A., Cornuet, J.-M., Paetkau, D., Baudouin, L., and Estoup, A. (2004) GENECLASS2: A Software for genetic assignment and first-generation migrant detection. J. Hered. 95, 536–539.
- Pritchard, J. K., Stephens, M., and Donnelly, P. (2000) Inference of population structure using multilocus genotype data. Genetics 155, 945–959.
- Queller, D. C., and Goodnight, K. F. (1989) Estimating relatedness using genetic markers. Evolution 43, 258–275.
- Rannala, B., and Mountain, J. L. (1997) Detecting immigration by using multilocus genotypes. Proc. Natl. Acad. Sci. USA 94, 9197–9201.
- Ropiquet, A., and Hassanin, A. (2005a) Molecular phylogeny of caprines (Bovidae, Antilopinae): the question of their origin and diversification during the Miocene. J. Zool. Syst. Evol. Res. 43, 49–60.
- Ropiquet, A., and Hassanin, A. (2005b) Molecular evidence for the polyphyly of the genus Hemitragus (Mammalia, Bovidae). Mol. Phylogenet. Evol. 36, 154–168.
- Schwartz, M. K., Luikart, G., and Waples, R. S. (2007) Genetic monitoring as a promising tool for conservation and management. Trends Ecol. Evol. 22, 25–33.
- Van Oosterhout, C., Hutchinson, W. F., Wills, D. P. M., and Shipley, P. (2004) MICROmicro-CHECKERchecker: software for identifying and correcting genotyping errors in microsatellite data. Mol. Ecol. Notes 4, 535–538.
- Wang, J. (2002) An estimator of pairwise relatedness using molecular markers. Genetics 160, 1203–1215.
- Weeks, A. R., Sgro, C. M., Young, A. G., Frankham, R., Mitchell, N. J., Miller, K. A., Byrne, M., Coates, D. J., Eldridge, M. D. B., Sunnucks, P., Breed, M. F., James, E. A., and Hoffmann, A. A. (2011) Assessing the benefits and risks of translocations in changing environments: a genetic perspective. Evol. Appl. 4, 709–725.
- Wilson, D., and Reeder, D. (eds.) (2005) Mammal Species of the World, 3rd ed. pp. 637–722. Johns Hopkins University Press, Baltimore, USA.
- Woo, H.-C. (1990) Mammals. Bulletin of the Korean Association for Conservation of Nature 10, 5–27. (written in Korean).
- Wright, S. (1943) Isolation by distance. Genetics, 28, 114–138.
- Yang, B. G. (2002) Systematic, ecology and current population status of the goral, Naemorhedus caudatus, in Korea. Ph.D. Dissertation, pp. 67–78. Chungbuk Nat’l Univ. (written in Korean with English abstract).
- Yoon, S. S. (2009) A Study of the Slash-and-burn Farmers. The Society of Korean Language and Culture 40, 185–206.