ABSTRACT
Epigenetic regulation is crucial for the development of plants and for adaptation to a changing environment. Recently, genome-wide profiles of histone modifications have been determined by a combination of chromatin immunoprecipitation (ChIP) and genomic tiling arrays (ChIP on chip) or ChIP and high-throughput sequencing (ChIP-seq) in species including Arabidopsis thaliana, rice and maize. Validation of ChIP analysis by PCR or qPCR using positive and negative regions of histone modification is necessary. In contrast, information about histone modifications is limited in Chinese cabbage, Brassica rapa. The aim of this study was to develop positive and negative control primer sets for H3K4me3 (trimethylation of the 4th lysine of H3), H3K9me2, H3K27me3 and H3K36me3 in B. rapa. The expression and histone modification of four FLC paralogs in B. rapa, before and after vernalization, were examined using the method developed here. After vernalization, expression of all four BrFLC genes was reduced, and accumulation of H3K27me3 was observed in three of them. As with A. thaliana, the vernalization response and stability of FLC repression correlated with the accumulation of H3K27me3. These results suggest that the epigenetic state during vernalization is important for high bolting resistance in B. rapa. The positive and negative control primer sets developed here revealed positive and negative histone modifications in B. rapa that can be used as a control for future studies.
INTRODUCTION
Epigenetic regulation is defined as changes in gene activity that are inherited through cell divisions without alteration of the DNA sequence. DNA wraps around histone protein octamers, each containing two of the core histones H2A, H2B, H3 and H4, to form the nucleosome, which is the basic unit of chromatin. Alteration of chromatin structure, which causes changes in transcription, is regulated by various post-translational modifications of the N-terminal regions of histone proteins, such as methylation or acetylation (Fuchs et al., 2006). Epigenetic regulation operates not only for the control of processes involved in development, but also for adaptation to changing environmental conditions (Berr et al., 2011; Richards, 2011; Fujimoto et al., 2012). In plant breeding, plants having desirable traits are selected from the population. Most of these traits are caused by genetic variation arising from spontaneous or artificially induced mutations. However, the possibility of selection of a particular epigenetic state, epigenetic selection, has been discussed, suggesting that the heritable epigenetic state is also important for plant breeding (Hauben et al., 2009; Springer, 2013).
Genome-wide profiles of epigenetic information define the epigenome, and are determined by a combination of chromatin immunoprecipitation (ChIP) and genomic tiling arrays (ChIP on chip) or ChIP and high-throughput sequencing (ChIP-seq), especially to detect methylation and acetylation of lysine residues on histone H3 because histone H3 undergoes the most extensive modification. In Arabidopsis thaliana, the genome-wide distribution patterns of histone modifications such as H3K4me (methylation of the 4th lysine of H3), H3K9me, H3K27me and H3K36me have been examined (Turck et al., 2007; Zhang et al., 2007, 2009; Bernatavichute et al., 2008; Oh et al., 2008; Roudier et al., 2011). More than 90% of the three types of H3K4me (H3K4me1, H3K4me2 and H3K4me3) are localized in genic regions including promoters, and H3K4me3 is associated with actively transcribed genes (Zhang et al., 2009). H3K36me3 is also enriched in genic regions, especially in highly expressed genes (Roudier et al., 2011). By contrast, H3K9me2 is observed in pericentromeric heterochromatin regions, especially in transposable elements (TEs), and H3K27me3 is observed in genic regions with a low level of transcription and in a tissue-specific manner (Turck et al., 2007; Zhang et al., 2007; Zhang et al., 2008). Thus, H3K4me3 and H3K36me3 are associated with gene activation, while H3K9me2 and H3K27me3 are associated with gene repression, in A. thaliana.
The transcriptional regulation of genes involved in flowering time or flower organ identity is controlled in part by chromatin regulation (Kaufmann et al., 2010). One of the well-known mechanisms controlled by chromatin regulation is vernalization, which is defined as “the acquisition or acceleration of the ability to flower by a chilling treatment” (Groszmann et al., 2011). One key determinant of vernalization in A. thaliana is FLOWERING LOCUS C (FLC). FLC encodes a MADS box DNA-binding protein and acts as a floral repressor (Michaels and Amasino, 1999; Sheldon et al., 1999). FLC is expressed prior to cold exposure and its expression is repressed by vernalization. Before prolonged cold exposure, FLC chromatin has the active histone mark H3K4me3, and this active epigenetic state shifts to an epigenetically repressed state, associated with an increase of H3K27me3, following vernalization, and FLC expression is reduced (Groszmann et al., 2011). H3K27me3 addition is catalyzed by the Polycomb Repressive Complex 2 (PRC2) (Simon and Kingston, 2009). Chinese cabbage (Brassica rapa L. var capitata), which is a close relative of A. thaliana, is vernalization-sensitive and has four FLC paralogs (BrFLC-1, BrFLC-2, BrFLC-3 and BrFLC-5) whose expression is repressed by vernalization, similar to A. thaliana (Kim et al., 2007; Zhao et al., 2010).
To perform an epigenome analysis of any histone modification, validation of ChIP analysis by PCR or qPCR using regions that are positive and negative for histone modification is necessary. However, few genes have been shown to be associated with H3K4me3, H3K9me2, H3K27me3 or H3K36me3 modifications in B. rapa. In addition, there are no reports examining the histone modification of BrFLC genes before and after vernalization, although BrFLC genes are expected to act similarly to FLC in A. thaliana. In this study, we developed positive and negative control primer sets that are suitable for validation of ChIP analysis against four histone modifications, H3K4me3, H3K9me2, H3K27me3 and H3K36me3. We also examined the histone states of the four FLC paralogs in B. rapa before and after vernalization.
MATERIALS AND METHODS
Plant materials and growth conditions
Previously, we developed the RJKB series of Chinese cabbage inbred lines (Shimizu et al., 2014). In this study, two of these inbred lines, RJKB-T23 and RJKB-T24, were used as plant material. Plants were grown on MS plates with 1.0% (w/v) sucrose under long day conditions (16 h light) at 21 ℃. Plants were harvested at 14 days after sowing for expression and ChIP analyses. For vernalizing cold treatments, seeds were surface-sterilized and placed on MS plates with 1% (w/v) sucrose for four weeks at 4 ℃ under long day conditions (16 h light). Plant materials were harvested at the end of four weeks of cold treatment, or four-week vernalization, followed by seven or 12 days of normal growth conditions.
Chromatin immunoprecipitation (ChIP)
ChIP experiments were performed as described by Buzas et al. (2011). One gram of 1st and 2nd leaves of Chinese cabbage was used for ChIP analysis and anti-H3K4me3 (Millipore, 07-473), anti-H3K9me2 (ACTIVE MOTIF, 39753), anti-H3K27me3 (Millipore, 04-449) and anti-H3K36me3 (Abcam, ab9050) antibodies were used. Purified immunoprecipitated DNAs were amplified using a whole-genome amplification kit (Sigma, GenomePlex Kit, WGA2) and cloned into pGEM-T Easy vector (Promega). Individual clones were sequenced, and the location of sequenced fragments in the reference genome of B. rapa (Brassica genome release v1.5), Chiifu-401, was examined by BLAST search using the Brassica Database (http://brassicadb.org/brad/).
For ChIP-PCR, immunoprecipitated DNA was amplified using Quick Taq HS DyeMix (Toyobo). The PCR reaction was performed using the following conditions: 94 ℃ for 2 min, followed by 30 cycles of 94 ℃ for 30 s, 58 ℃ for 30 s and 68 ℃ for 30 s. ChIP-qPCR was performed using a LightCycler Nano (Roche). The immunoprecipitated DNA was amplified using FastStart Essential DNA Green Master (Roche). PCR conditions were 95 ℃ for 10 min followed by 40 cycles of 95 ℃ for 10 s, 60 ℃ for 10 s and 72 ℃ for 15 s, and a Melting program (60 ℃ to 95 ℃ at 0.1 ℃/s). After the amplification cycles, each reaction was subjected to melt temperature analysis to confirm single amplified products. Data presented are the average and standard error (SE) from three biological and experimental replications. Primer sequences used in this study are shown in Supplementary Table S1.
RNA extraction and RT-PCR/qPCR
Total RNA was isolated from cotyledons or 1st and 2nd leaves using the SV Total RNA Isolation System (Promega). cDNA was synthesized from 500 ng total RNA using ReverTra Ace qPCR RT Master Mix with gDNA Remover (Toyobo). The cDNA was PCR-amplified using Quick Taq HS DyeMix (Toyobo). The PCR reaction was performed using the following conditions: 94 ℃ for 2 min, followed by 30 cycles of 94 ℃ for 30 s, 58 ℃ for 30 s and 68 ℃ for 30 s. RT-qPCR was performed by the same methods as ChIP-qPCR (see above), using the cDNA as a template. The expression level of each gene relative to Bractin was calculated using automatic CQ calling according to the manufacturer’s instructions (Roche) (Fujimoto et al., 2006). Data presented are the average and SE from three biological and experimental replications. Primer sequences are shown in Supplementary Table S1.
RESULTS
Classification of expression levels by RNA sequencing analysis
We previously examined the transcriptome of 14-day-old 1st and 2nd leaves of the Chinese cabbage inbred line RJKB-T24 (Shimizu et al., 2014). Of 41,029 genes, 13,283 (32.4%) did not have any mapped reads; these were categorized as Group-0 (Fig. 1). The FPKM (fragments per kilobase of transcript per million mapped reads) of the remaining genes, which had at least one mapped read, was calculated. We divided the levels of gene expression into six groups using the log2 score of FPKM, as follows: Group-6 (highest), log2 score of FPKM (x) is greater than 9.0; Group-5, 6.0 < x < 9.0; Group-4, 3.0 < x < 6.0; Group-3, 0.0 < x < 3.0; Group-2, –3.0 < x < 0.0; Group-1 (lowest), x < –3.0. The average of the log2 FPKM scores was 2.76, and the distribution from Group-1 to Group-6 was 1.2%, 9.1%, 21.7%, 30.9%, 4.4% and 0.2%, respectively (Fig. 1).
Screening of positive and negative control primer sets to confirm the enrichment of histone modification
H3K4me3 and H3K36me3 are known as active histone marks, while H3K9me2 and H3K27me3 are known as repressive histone marks. To identify regions having these histone marks, we selected five genes categorized in Group-6 and six in Group-0/1. All five genes in Group-6 showed amplification by ChIP-PCR using the antibody against H3K4me3, and none of the five were amplified using the antibody against H3K9me2 (Table 1). Three genes showed amplification by ChIP-PCR using the antibody against H3K27me3 and two using the antibody against H3K36me3 (Table 1). Of six genes categorized in Group-0/1, only one, Bra018355, showed amplification by ChIP-PCR using the antibody against H3K4me3 and H3K27me3, while the other five genes showed no amplification using any of the four antibodies (Table 1).
Table 1. ChIP-PCR using antibodies against H3K4me3, H3K9me2, H3K27me3 and H3K36me3
| | H3K4me3 | H3K9me2 | H3K27me3 | H3K36me3 | FPKM | Group |
|---|
| Highly expressed genes | Bra028174 | + | – | + | + | 3050.60 | Group-6 |
| Bra013206 | + | – | – | – | 1919.22 | Group-6 |
| Bra039113 | + | – | – | + | 1834.65 | Group-6 |
| Bra015809 | + | – | + | – | 1396.67 | Group-6 |
| Bra013123 | + | – | + | – | 1360.17 | Group-6 |
| Low- or non-expressed genes | Bra018355 | + | – | + | – | 0.00 | Group-0 |
| Bra021022 | – | – | – | – | 0.00 | Group-0 |
| Bra011336 | – | – | – | – | 0.00 | Group-0 |
| Bra017790 | – | – | – | – | 0.00 | Group-0 |
| Bra028233 | – | – | – | – | 0.00 | Group-0 |
| Bra013999 | – | – | – | – | 0.054 | Group-1 |
+, PCR amplification; –, No PCR amplification.
FPKM, Fragments per kilobase of transcript per million mapped reads.
Next, we examined the histone methylation status of five Chinese cabbage genes orthologous to A. thaliana genes with an H3K27me3 mark: AG, AGL19, FUSCA3, FWA and STM (Turck et al., 2007; Zhang et al., 2007). The expression level of these five genes was low in leaves except for Bra020826 (Group-4), one of the AGL19-orthologous genes (Table 2). ChIP-PCR using antibodies against H3K4me3, H3K9me2, H3K27me3 and H3K36me3 showed that four of the tested genes (except for AGL19) had only the H3K27me3 mark, while AGL19 had the H3K4me3 mark in addition to the H3K27me3 mark (Table 2).
Table 2. ChIP-PCR using antibodies against H3K4me3, H3K9me2, H3K27me3 and H3K36me3
| | H3K4me3 | H3K9me2 | H3K27me3 | H3K36me3 | FPKM | Group |
|---|
| AG* | Bra012564 | – | – | + | – | 0.22 | Group-2 |
| Bra013364 | 0.22 | Group-2 |
| AGL19* | Bra019343 | + | – | + | – | 0.00 | Group-0 |
| Bra020826 | 46.3 | Group-4 |
| FUSCA3* | Bra025229 | – | – | + | – | 0.00 | Group-0 |
| Bra032953 | 0.07 | Group-1 |
| FWA | Bra013898 | – | – | + | – | 0.00 | Group-0 |
| STM | Bra027050 | – | – | + | – | 0.00 | Group-0 |
AG, AGL19, FUSCA3, FWA and STM in A. thaliana display H3K27me3 accumulation.
+, PCR amplification; –, No PCR amplification.
FPKM, Fragments per kilobase of transcript per million mapped reads.
*, A single primer set can amplify the two indicated orthologous genes.
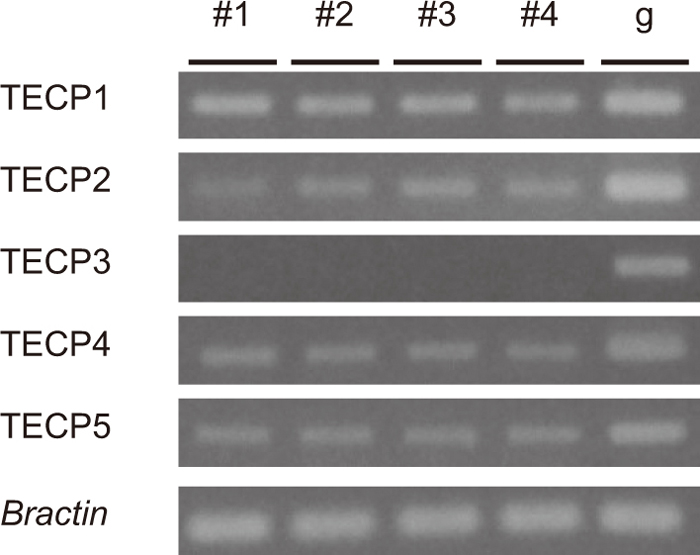
To identify regions having the H3K9me2 mark, we assessed histone status in transposable elements (TEs), as it is known that TEs have heterochromatic epigenetic marks such as DNA methylation and H3K9me2 (Bernatavichute et al., 2008). We generated primer sets in two TEs, STF7aL and STF12bL, which are expressed and known to have DNA methylation in the leaves (Fujimoto et al., 2008), and in five randomly selected TEs, termed TECP1-5. The histone status of these seven TEs was examined by ChIP-PCR using the same four antibodies. STF7aL, TECP2 and TECP4 had all four histone marks, while TECP1, TECP3 and TECP5 did not have any histone mark. STF12bL had only H3K9me2 (Table 3). The expression state of these five TECPs was examined by RT-PCR, and all except for TECP3 were expressed (Fig. 2).
Table 3. ChIP-PCR of transposable elements using antibodies against H3K4me3, H3K9me2, H3K27me3 and H3K36me3
| H3K4me3 | H3K9me2 | H3K27me3 | H3K36me3 |
|---|
| STF7aL | + | + | + | + |
| STF12bL | – | + | – | – |
| TECP1 | – | – | – | – |
| TECP2 | + | + | + | + |
| TECP3 | – | – | – | – |
| TECP4 | + | + | + | + |
| TECP5 | – | – | – | – |
+, PCR amplification; –, No PCR amplification.
To find more regions having H3K9me2 or H3K36me3 modifications, we determined the sequences of DNA fragments having these modifications. The PCR fragments were amplified by the WGA2 kit using ChIP-DNA as a template, and 110 (H3K9me2) and 32 (H3K36me3) DNA fragments were sequenced. The locations of these fragments in the reference genome were examined (Supplementary Tables S2 and S3). Ninety-three of 110 (84.5%) DNA fragments with H3K9me2 were in intergenic regions, and 81 (73.6%) of the 110 DNA fragments were in TEs (Supplementary Table S2). Seventeen of 32 (53.1%) DNA fragments with H3K36me3 were in genic regions and these genes tended to have a higher expression level (mean FPKM = 41.84) (Supplementary Table S3). We validated four and three regions having H3K9me2 and H3K36me3, respectively, in genic regions by ChIP-PCR, and all regions showed enrichment of H3K9me2 or H3K36me3 modifications (Table 4).
Table 4. Verification of H3K9me2 or H3K36me3 enrichment by ChIP-PCR
| Clone number | H3K4me3 | H3K9me2 | H3K27me3 | H3K36me3 | Gene name | FPKM | Group |
|---|
| H3K9me2 | | | | | | | |
| No. 11 (CL9-11) | + | + | + | + | | | |
| No. 16 (CL9-16) | – | + | – | – | | | |
| No. 63 (CL-63) | + | + | + | + | Bra035041 | 0.00 | Group-0 |
| No. 71 (CL9-71) | + | + | + | + | | | |
| H3K36me3 | | | | | | | |
| No. 12 (CL36-12) | + | – | – | + | Bra028913 | 7.43 | Group-3 |
| No. 14 (CL36-14) | + | – | – | + | | | |
| No. 18 (CL36-18) | + | – | – | + | Bra037182 | 433.61 | Group-5 |
+, PCR amplification; –, No PCR amplification.
For H3K4me3, H3K9me2, H3K27me3 and H3K36me3, we developed positive and negative control primer sets which come from regions with and without histone modifications, respectively, in RJKB-T24 (Table 5). These primer sets were applied to another Chinese cabbage inbred line, RJKB-T23. All primer sets showed the enrichment of targeted histone modifications in RJKB-T23 (Fig. 3), indicating that these primer sets can be used for confirming the enrichment of each histone modification in B. rapa.
Table 5. Positive and negative control primer sets for H3K4me3, H3K9me2, H3K27me3 and H3K36me3
| Positive | Negative/Reference |
|---|
| 1 | 2 | 1 | 2 |
|---|
| H3K4me3 | Bra013206 | Bra039113 | FWA | STM |
| H3K9me2 | STF7aL | CL9-16 | Bra028174 | Bra039113 |
| H3K27me3 | FWA | STM | Bra013206 | Bra028913 |
| H3K36me3 | Bra028174 | Bra028913 | AG | Bra018355 |
In A. thaliana, before vernalization, a key gene controlling flowering time through vernalization, FLC, is expressed and has the active histone mark H3K4me3. This active state shifts to an epigenetically repressed state, with increased H3K27me3, following vernalization, and FLC expression is reduced (Bastow et al., 2004; De Lucia et al., 2008). In B. rapa, there are four FLC genes and two VIN3 genes, whose orthologs in A. thaliana are activated by vernalization (Sung and Amasino, 2004). In the RNA-seq data, transcripts of all four BrFLC genes were detected (Table 6) and BrVIN3 expression level was either very low (Bra006824, FPKM = 0.29, Group-2) or undetectable (Bra020445, Group-0) in 14-day-old seedlings of RJKB-T24. SNP information from RNA-seq data spanning the BrFLC genes showed that Bra006051/BrFLC-3, Bra022771/BrFLC-5 and Bra028599/BrFLC-2 in RJKB-T24 did not have any SNPs compared to the reference genome. Bra009055/BrFLC-1 had 2 SNPs, one a synonymous substitution and the other a non-synonymous substitution (20Pro → Thr). From this SNP information, all BrFLCs in RJKB-T24 could be functional except for BrFLC-5, which is truncated.
Table 6. Epigenetic status of
FLC genes in normal growth conditions
| | H3K4me3 | H3K9me2 | H3K27me3 | H3K36me3 | FPKM | Group |
|---|
| Bra006051 | BrFLC-3 | + | – | – | – | 75.05 | Group-5 |
| Bra009055 | BrFLC-1 | + | – | – | + | 22.51 | Group-4 |
| Bra022771 | BrFLC-5 | + | – | – | – | 9.74 | Group-4 |
| Bra028599 | BrFLC-2 | + | – | – | – | 61.27 | Group-4 |
+, Histone modification confirmed by ChIP-PCR.
–, Absence of histone modification confirmed by ChIP-PCR.
The expression levels of BrFLC and BrVIN3 genes before and after vernalization were examined using primer sets that can amplify all four BrFLC genes and both of the BrVIN3 genes in RJKB-T24. We treated seeds for four weeks at 4 ℃, at the end of which time their developmental stage was similar to that of seedlings at two days after sowing under normal growth conditions. The expression level of BrFLCs immediately after this treatment (the four-week vernalization samples) was reduced. After four-week vernalization, plants were transferred to normal growth conditions for either seven or 12 days. Cotyledons were fully opened and 1st and 2nd leaves had appeared in the four-week vernalization plus seven days normal growth treatment. In the four-week vernalization plus 12 days normal growth treatment, 1st and 2nd leaves were enlarged and plants were similar to the 14-day-old plants under normal growth conditions. The repression of BrFLCs was maintained following the return to ambient temperature (Fig. 4A). Expression of BrVIN3 genes was activated after prolonged cold treatment, and their expression level reverted to that observed before cold treatment when the seedlings were returned to normal growth conditions (Fig. 4B). There was no significant difference in expression levels of BrFLCs or BrVIN3s in two-, four- and six-day-old cotyledons and 10- and 14-day-old 1st and 2nd leaves grown under normal conditions (data not shown).

We examined the H3K27me3 modification in BrFLC genes before and after vernalization. We developed BrFLC-specific primer sets around the first exon, and performed ChIP-PCR using the 1st and 2nd leaves before prolonged cold treatment. All four BrFLC genes had the H3K4me3 but not the H3K27me3 modification (Table 6). ChIP-qPCR using H3K27me3 antibody was performed on the four BrFLC genes, and the orthologs of MAF1 (Bra024350) and FWA (Bra013898), before and after four-week vernalization (Fig. 5). Before vernalization only the FWA gene showed enrichment of H3K27me3, and there was no change in the level of H3K27me3 accumulation after vernalization (Fig. 5, Supplementary Fig. S1), suggesting that the H3K27me3 status not only in FWA but also in STM was stable during vernalization treatment. After the four-week vernalization treatment, Bra006051/BrFLC-3, Bra009055/BrFLC-1 and Bra028599/BrFLC-2 showed a > 20-fold increase in the level of H3K27me3, and FWA showed enrichment of H3K27me3 but to the same level as before vernalization (Fig. 5, Supplementary Fig. S1). The increase of H3K27me3 in Bra006051/BrFLC-3, Bra009055/BrFLC-1 and Bra028599/BrFLC-2 was maintained when plants were returned to normal growth conditions for 12 days (Fig. 5, Supplementary Fig. S1). The accumulation of H3K27me3 in MAF1 was also increased (four-fold) after four-week vernalization, and was further increased (ten-fold) when the plants were returned to normal growth conditions for 12 days (Fig. 5, Supplementary Fig. S1).

DISCUSSION
To identify genomic regions with the active histone marks H3K4me3 or H3K36me3 in B. rapa, we selected five genes with a high expression level using previous RNA-seq data (Shimizu et al., 2014). All five genes showed enrichment of H3K4me3, while two out of the five genes showed enrichment of H3K36me3. This demonstrates that we can efficiently identify H3K4me3, but not H3K36me3 regions, using RNA-seq data. To identify regions having H3K36me3, we determined the sequences of 32 DNA fragments having H3K36me3, and approximately 50% of the fragments (17/32 genes) were in genic regions. Thirteen of these 17 genes (76.5%) were categorized as Group-4 or -5, and this percentage was higher than that of Group-4 or Group-5 among total genes (35.3%). These results indicate that H3K4me3 and H3K36me3 are enriched in transcriptionally active genes in B. rapa, similar to other plants (Oh et al., 2008; Zhang et al., 2009; Roudier et al., 2011; Chen et al., 2011; Chen et al., 2013).
Next, we identified regions with H3K9me2 or H3K27me3, which are repressive histone marks. We selected six genes with low or no expression level from RNA-seq data, and one gene, Bra018355, showed enrichment of H3K27me3, but enrichment of H3K9me2 was not seen in any of the analyzed genes, suggesting that it is difficult to predict regions with H3K9me2 or H3K27me3 based on RNA-seq data. As TEs are associated with H3K9me2 in A. thaliana, we examined the enrichment of H3K9me2 in seven TEs; two (STFs) are highly methylated (Fujimoto et al., 2008) and four had H3K9me2, and these four TEs were expressed. Although the primer sets in TEs amplified both active and silenced copies of TEs, there was no correlation between the expression levels and enrichment of H3K9me2. We also determined the sequences of 110 DNA fragments having H3K9me2, and 81 of 110 fragments (76.3%) were in TEs, indicating that H3K9me2 is associated with TEs, consistent with previous reports in A. thaliana (Lippman et al., 2004; Bernatavichute et al., 2008). To identify regions having H3K27me3, we selected five genes in B. rapa that are orthologous to A. thaliana genes having a H3K27me3 mark. All five genes had H3K27me3, and four of the five were not expressed in leaves. H3K27me3 distribution patterns are highly conserved between natural accessions in A. thaliana (Moghaddam et al., 2011; Deng et al., 2013; Dong et al., 2013), suggesting that H3K27me3-targeted genes are conserved between A. thaliana and B. rapa.
It is difficult to predict H3K9me2-, H3K27me3- and H3K36me3-marked regions from RNA-seq data, but we identified regions with and without these four histone modifications in the Chinese cabbage inbred line RJKB-T24 by sequencing the DNA fragments of ChIP products or using epigenome information in A. thaliana. Using the results of ChIP-PCR in RJKB-T24, we developed primer sets for positive and negative regions of H3K4me3, H3K9me2, H3K27me3 and H3K36me3. We applied these primer sets to another Chinese cabbage inbred line, RJKB-T23, and confirmed the enrichment of all four histone modifications, indicating that these primer sets for histone modifications are useful for ChIP analysis in Chinese cabbage and may be applicable to other B. rapa varieties such as turnip, komatsuna, and pak choi. These positive and negative primer sets will be useful as controls to examine histone modification status in a specific gene by ChIP-PCR/qPCR, or at the whole genome level by ChIP-seq, in B. rapa.
In leafy vegetables such as Chinese cabbage, high bolting resistance is an important trait for cultivation. In B. rapa, co-localization of flowering time QTLs and BrFLC genes suggested that genetic mutation of BrFLC genes causes flowering time variations (Schranz et al., 2002; Li et al., 2009; Yuan et al., 2009; Zhao et al., 2010; Kakizaki et al., 2011; Kitamoto et al., 2014). However, there are no reports examining the epigenetic state of BrFLC before and after vernalization or the stability of the epigenetically repressed state after plants return to warm conditions in B. rapa. The vernalization response and stability of FLC repression are correlated with the accumulation of H3K27me3 in A. thaliana (Shindo et al., 2006; Coustham et al., 2012), suggesting that chromatin state during vernalization is important for high bolting resistance in B. rapa. We examined the histone modifications of four FLC paralogs in B. rapa. From RNA-seq data, all four BrFLC paralogs were expressed in leaves growing in normal conditions; three (BrFLC-2, -3 and -5) had H3K4me3, and BrFLC-1 had both H3K4me3 and H3K36me3. BrFLC-5 was expressed in leaves, but this is likely a pseudogene because the FLC protein is truncated. Interestingly, there was no accumulation of H3K27me3 in BrFLC-5 after vernalization in spite of the reduction of its expression after vernalization. As high levels of H3K27me3 are important for the maintenance of FLC silencing in A. thaliana (Finnegan and Dennis, 2007; De Lucia et al., 2008), repression of BrFLC-5 expression by vernalization may simply be a temporal change. Accumulation of H3K27me3 was observed in BrFLC-1, BrFLC-2 and BrFLC-3, and H3K27me3 levels were stably maintained after the return to warm conditions, suggesting that the reduction in expression of the three BrFLC paralogs is associated with increased H3K27me3 and thus that repression of BrFLCs is maintained by H3K27me3 in B. rapa. In A. thaliana, the first intron, in addition to the promoter region and exon 1, is important for the maintenance of FLC repression (Sheldon et al., 2002), and a long non-coding RNA, COLD ASSISTED INTRONIC NONCODING RNA (COLDAIR), which is required for targeting the PRC2 complex to FLC, is expressed from the mid-region of the first intron (Tsai et al., 2010; Heo and Sung, 2011). Natural variation of the vernalization response is due to non-coding cis variation within FLC in A. thaliana (Coustham et al., 2012; Li et al., 2015). Among three BrFLC paralogs in B. rapa, the sequence and length of the first intron vary, and there is no sequence similarity in the first intron of BrFLCs to COLDAIR in A. thaliana. The association between an insertion in the first intron and weak repression of BrFLCs by vernalization has been identified in a late-bolting line in B. rapa (Kitamoto et al., 2014). We have shown here that the repression of three FLC paralogs by vernalization is associated with the change of epigenetic state in B. rapa. However, further experiments will be required for determining the regions important for recruitment of H3K27me3 or the response to vernalization in B. rapa.
ACKNOWLEDGMENTS
We thank Mr. Naoki Fukushima and Ms. Sonoko Ishikura for their technical assistance. This work was supported by Open Partnership Joint Projects of JSPS Bilateral Joint Research Projects and a Grant-in-Aid for Young Scientists (B) (2478002) (JSPS) to R. Fujimoto, and by Grant-in-Aid for Scientific Research (B) (15H04433) (JSPS) to K. Okazaki.
REFERENCES
- Bastow, R., Mylne, J. S., Lister, C., Lippman, Z., Martienssen, R. A., and Dean, C. (2004) Vernalization requires epigenetic silencing of FLC by histone methylation. Nature 427, 164–167.
- Bernatavichute, Y. V., Zhang, X., Cokus, S., Pellegrini, M., and Jacobsen, S. E. (2008) Genome-wide association of histone H3 lysine nine methylation with CHG DNA methylation in Arabidopsis thaliana. PLoS One 8, e3156.
- Berr, A., Shafiq, S., and Shen, W. H. (2011) Histone modifications in transcriptional activation during plant development. Biochim. Biophys. Acta 1809, 567–576.
- Buzas, D. M., Robertson, M., Finnegan, E. J., and Helliwell, C. A. (2011) Transcription-dependence of histone H3 lysine 27 trimethylation at the Arabidopsis polycomb target gene FLC. Plant J. 65, 872–881.
- Chen, Q., Chen, X., Wang, Q., Zhang, F., Lou, Z., Zhang, Q., and Zhou, D. X. (2013) Structural basis of a histone H3 lysine 4 demethylase required for stem elongation in rice. PLoS Genet. 9, e1003239.
- Chen, X., Hu, Y., and Zhou, D. X. (2011) Epigenetic gene regulation by plant Jumonji group of histone demethylase. Biochim. Biophys. Acta 1809, 421–426.
- Coustham, V., Li, P., Strange, A., Lister, C., Song, J., and Dean, C. (2012) Quantitative modulation of polycomb silencing underlies natural variation in vernalization. Science 337, 584–587.
- De Lucia, F., Crevillen, P., Jones, A. M., Greb, T., and Dean, C. (2008) A PHD-polycomb repressive complex 2 triggers the epigenetic silencing of FLC during vernalization. Proc. Natl. Acad. Sci. USA 105, 16831–16836.
- Deng, W., Buzas, D. M., Ying, H., Robertson, M., Taylor, J., Peacock, W. J., Dennis, E. S., and Helliwell, C. (2013) Arabidopsis Polycomb Repressive Complex 2 binding sites contain putative GAGA factor binding motifs within coding regions of genes. BMC Genomics 14, 593.
- Dong, X., Reimer, J., Göbel, U., Engelhorn, J., He, F., Schoof, H., and Turck, F. (2013) Natural variation of H3K27me3 distribution between two Arabidopsis accessions and its association with flanking transposable elements. Genome Biol. 13, R117.
- Finnegan, E. J., and Dennis, E. S. (2007) Vernalization-induced trimethylation of histone H3 lysine 27 at FLC is not maintained in mitotically quiescent cells. Curr. Biol. 17, 1978–1983.
- Fuchs, J., Demidov, D., Houben, A., and Schubert, I. (2006) Chromosomal histone modification patterns–from conservation to diversity. Trends Plant Sci. 11, 199–208.
- Fujimoto, R., Sasaki, T., and Nishio, T. (2006) Characterization of DNA methyltransferase genes in Brassica rapa. Genes Genet. Syst. 81, 235–242.
- Fujimoto, R., Sasaki, T., Inoue, H., and Nishio, T. (2008) Hypomethylation and transcriptional reactivation of retrotransposon-like sequences in ddm1 transgenic plants of Brassica rapa. Plant Mol. Biol. 66, 463–473.
- Fujimoto, R., Sasaki, T., Ishikawa, R., Osabe, K., Okazaki, K., and Dennis, E. S. (2012) Molecular mechanisms of epigenetic variation in plants. Int. J. Mol. Sci. 13, 9900–9922.
- Groszmann, M., Greaves, I. K., Albert, N., Fujimoto, R., Helliwell, C. A., Dennis, E. S., and Peacock, W. J. (2011) Epigenetics in plants-vernalisation and hybrid vigour. Biochim. Biophys. Acta 1809, 427–437.
- Hauben, M., Haesendonckx, B., Standaert, E., Van Der Kelen, K., Azmi, A., Akpo, H., Van Breusegem, F., Guisez, Y., Bots, M., Lambert, B., et al. (2009) Energy use efficiency is characterized by an epigenetic component that can be directed through artificial selection to increase yield. Proc. Natl. Acad. Sci. USA 106, 20109–20114.
- Heo, J. B., and Sung, S. (2011) Vernalization-mediated epigenetic silencing by a long intronic noncoding RNA. Science 331, 76–79.
- Kakizaki, T., Kato, T., Fukino, N., Ishida, M., Hatakeyama, K., and Matsumoto, S. (2011) Identification of quantitative trait loci controlling late bolting in Chinese cabbage (Brassica rapa L.) parental line Nou 6 gou. Breed. Sci. 61, 151–159.
- Kaufmann, K., Pajoro, A., and Angenent, G. C. (2010) Regulation of transcription in plants: mechanisms controlling developmental switches. Nat. Rev. Genet. 11, 830–842.
- Kim, S. Y., Park, B. S., Kwon, S. J., Kim, J., Lim, M. H., Park, Y. D., Kim, D. Y., Suh, S. C., Jin, Y. M., Ahn, J. H., et al. (2007) Delayed flowering time in Arabidopsis and Brassica rapa by the overexpression of FLOWERING LOCUS C (FLC) homologs isolated from Chinese cabbage (Brassica rapa L. ssp. pekinensis). Plant Cell Rep. 26, 327–336.
- Kitamoto, N., Yui, S., Nishikawa, K., Takahata, Y., and Yokoi, S. (2014) A naturally occurring long insertion in the first intron in the Brassica rapa FLC2 gene causes delayed bolting. Euphytica 196, 213–223.
- Li, F., Kitashiba, H., Inaba, K., and Nishio, T. (2009) A Brassica rapa linkage map of EST-based SNP markers for identification of candidate genes controlling flowering time and leaf morphological traits. DNA Res. 16, 311–323.
- Li, P., Tao, Z., and Dean, C. (2015) Phenotypic evolution through variation in splicing of the noncoding RNA COOLAIR. Genes Dev. 29, 696–701.
- Lippman, Z., Gendrel, A. V., Black, M., Vaughn, M. W., Dedhia, N., McCombie, W. R., Lavine, K., Mittal, V., May, B., Kasschau, K. D., et al. (2004) Role of transposable elements in heterochromatin and epigenetic control. Nature 430, 471–476.
- Michaels, S. D., and Amasino, R. M. (1999) FLOWERING LOCUS C encodes a novel MADS domain protein that acts as a repressor of flowering. Plant Cell 11, 949–956.
- Moghaddam, A. M., Roudier, F., Seifert, M., Bérard, C., Magniette, M. L., Ashtiyani, R. K., Houben, A., Colot, V., and Mette, M. F. (2011) Additive inheritance of histone modifications in Arabidopsis thaliana intra-specific hybrids. Plant J. 67, 691–700.
- Oh, S., Park, S., and van Nocker, S. (2008) Genic and global functions for Paf1C in chromatin modification and gene expression in Arabidopsis. PLoS Genet. 4, e1000077.
- Richards, E. J. (2011) Natural epigenetic variation in plant species: a view from the field. Curr. Opin. Plant Biol. 14, 204–209.
- Roudier, F., Ahmed, I., Bérard, C., Sarazin, A., Mary-Huard, T., Cortijo, S., Bouyer, D., Caillieux, E., Duvernois-Berthet, E., Al-Shikhley, L., et al. (2011) Integrative epigenomic mapping defines four main chromatin states in Arabidopsis. EMBO J. 30, 1928–1938.
- Schranz, M. E., Quijada, P., Sung, S. B., Lukens, L., Amasino, R., and Osborn, T. C. (2002) Characterization and effects of the replicated flowering time gene FLC in Brassica rapa. Genetics 162, 1457–1468.
- Sheldon, C. C., Burn, J. E., Perez, P. P., Metzger, J., Edwards, J. A., Peacock, W. J., and Dennis, E. S. (1999) The FLF MADS box gene: a repressor of flowering in Arabidopsis regulated by vernalization and methylation. Plant Cell 11, 445–458.
- Sheldon, C. C., Conn, A. B., Dennis, E. S., and Peacock, W. J. (2002) Different regulatory regions are required for the vernalization-induced repression of FLOWERING LOCUS C and for the epigenetic maintenance of repression. Plant Cell 14, 2527–2537.
- Shimizu, M., Fujimoto, R., Ying, H., Pu, Z. J., Ebe, Y., Kawanabe, T., Saeki, N., Taylor, J. M., Kaji, M., Dennis, E. S., et al. (2014) Identification of candidate genes for Fusarium yellows resistance in Chinese cabbage by differential expression analysis. Plant Mol. Biol. 85, 247–257.
- Shindo, C., Lister, C., Crevillen, P., Nordborg, M., and Dean, C. (2006) Variation in the epigenetic silencing of FLC contributes to natural variation in Arabidopsis vernalization response. Genes Dev. 20, 3079–3083.
- Simon, J. A., and Kingston, R. E. (2009) Mechanisms of polycomb gene silencing: knowns and unknowns. Nat. Rev. Mol. Cell Biol. 10, 697–708.
- Springer, N. M. (2013) Epigenetics and crop improvement. Trends Genet. 29, 241–247.
- Sung, S., and Amasino, R. M. (2004) Vernarization in Arabidopsis thaliana is mediated by the PHD finger protein VIN3. Nature 427, 159–164.
- Tsai, M. C., Manor, O., Wan, Y., Mosammaparast, N., Wang, J. K., Lan, F., Shi, Y., Segal, E., and Chang, H. Y. (2010) Long noncoding RNA as modular scaffold of histone modification complexes. Science 329, 689–693.
- Turck, F., Roudier, F., Farrona, S., Martin-Magniette, M. L., Guillaume, E., Buisine, N., Gagnot, S., Martienssen, R. A., Coupland, G., and Colot, V. (2007) Arabidopsis TFL2/LHP1 specifically associates with genes marked by trimethylation of histone H3 lysine 27. PLoS Genet. 3, e86.
- Yuan, Y. X., Wu, J., Sun, R. F., Zhang, X.-W., Xu, D. H., Bonnema, G., and Wang, X. W., (2009) A naturally occurring splicing site mutation in Brassica rapa FLC1 gene is associated with variation in flowering time. J. Exp. Bot. 60, 1299–1308.
- Zhang, X., Clarenz, O., Cokus, S., Bernatavichute, Y. V., Pellegrini, M., Goodrich, J., and Jacobsen, S. E. (2007) Whole-genome analysis of histone H3 lysine 27 trimethylation in Arabidopsis. PLoS Biol. 5, e129.
- Zhang, X., Shiu, S. H., Cal, A., and Borevitz, J. O. (2008) Global analysis of genetic, epigenetic and transcriptional polymorphisms in Arabidopsis thaliana using whole genome tiling arrays. PLoS Genet. 4, e1000032.
- Zhang, X., Bernatavichute, Y. V., Cokus, S., Pellegrini, M., and Jacobsen, S. E. (2009) Genome-wide analysis of mono-, di- and trimethylation of histone H3 lysine 4 in Arabidopsis thaliana. Genome Biol. 10, R62.
- Zhao, J., Kulkarni, V., Liu, N., Pino Del Carpio, D., Bucher, J., and Bonnema, G. (2010) BrFLC2 (FLOWERING LOCUS C) as a candidate gene for a vernarization response QTL in Brassica rapa. J. Exp. Bot. 61, 1817–1825.