ABSTRACT
We investigated the genetic diversity of the core collection of hexaploid wheat accessions in the Japanese wheat gene bank, NBRP-Wheat, with a focus on grain morphology. We scanned images of grains in the core collection, which consists of 189 accessions of Triticum aestivum, T. spelta, T. compactum, T. sphaerococcum, T. macha and T. vavilovii. From the scanned images, we recorded six metric characters (area size, perimeter length, grain length, grain width, length to width ratio and circularity) using the software package SmartGrain ver. 1.2. Statistical analyses of the collected data along with hundred-grain weight revealed that T. aestivum has the largest diversity in grain morphology. Principal component analysis of these seven characters demonstrated that two principal components (PCcore1 and PCcore2) explain more than 96% of the variation in the core collection accessions. The correlation coefficients between the principal components and characters indicate that PCcore1 is related to grain size and PCcore2 to grain shape. From a genome-wide association study, we found a total of 15 significant marker-trait associations (MTAs) for grain morphological characters. More interestingly, we found mutually exclusive MTAs for PCcore1 and PCcore2 on 18 and 13 chromosomes, respectively. The results suggest that grain morphology in hexaploid wheat is determined by two factors, grain size and grain shape, which are under the control of multiple genetic loci.
INTRODUCTION
Bread wheat (Triticum aestivum L.) is one of the major food crops in the world. It is predicted that the global demand for cereal crops will exceed production capacity in the coming decades. Thus, wheat improvement measures targeting increased yield are urgently required (Tester and Langridge, 2010). In this context, among the different wheat traits, grain size and shape are particularly important since they strongly affect yield (Williams et al., 2013) and milling quality (Evers and Withey, 1989). Grain size is the volume of the grain, which is often measured as weight and volume of 100 or 1,000 grains. Grain shape is mostly characterized by the proportion of the three growth axes, length, width and thickness (Breseghello and Sorrells, 2007). According to a previous study, there is little correlation between grain shape and size in wheat (Gegas et al., 2010).
Software for digital image analysis has emerged as a powerful tool to phenotype plant morphology. For example, Iwata and Ukai (2002) developed the program SHAPE (http://lbm.ab.a.u-tokyo.ac.jp/~iwata/shape/) that detects the outline of an object and converts it into a numeric descriptor called an elliptic Fourier descriptor. The program has been successfully applied to measure grain shape in rice, common wheat and synthetic hexaploid wheat (Iwata et al., 2010; Williams et al., 2013; Rasheed et al., 2014). Furthermore, upgrades of the software for measuring grains have been made publicly available (Tanabata et al., 2012; Whan et al., 2014). These software releases have enabled high-throughput phenotyping and, therefore, contributed to elucidating the genetic components of grain morphology.
Previous studies have discovered genes that influence grain size or shape in wheat. TaGW2, a wheat ortholog of rice OsGW2, was isolated as a grain morphology-regulating gene, and was assigned to the homoeologous group-6 chromosomes (Su et al., 2011). Two single-nucleotide polymorphisms (SNPs) in the promoter region of TaGW2-6A are associated with grain width and thousand-grain weight (Su et al., 2011). Disruption of TaGW2-B1 or TaGW2-D1 resulted in significant increase in thousand-grain weight, grain length, and grain width (Zhang et al., 2018). This result is consistent with the findings of a previous study on TaGW2-knockdown mutants (Hong et al., 2014). The wheat sucrose synthase 2 gene (TaSus2) controls carbon flow into starch biosynthesis. By employing two different haplotypes of the chromosome 2B-encoded TaSus2 gene, Jiang et al. (2011) demonstrated that TaSus2 is associated with thousand-grain weight. Significant differences in thousand-grain weight were detected among hexaploid wheat cultivars grown in China that have different haplotypes of cell wall invertase genes, TaCwi-4A and TaCwi-5D (Jiang et al., 2015). These genes are associated mainly with grain size, and some of them pleiotropically influence grain morphology.
Okamoto et al. (2012) suggested that the Tenacious glume 1 locus (Tg-D1), a gene responsible for the free-threshing character of hexaploid wheat, also affects spikelet and grain shapes. Okamoto and Takumi (2013) also revealed that the polonicum allele of the P1 locus, a subspecies differentiation gene of T. turgidum L. ssp. polonicum (L.) Thell., affected grain shape as well as other spike-related morphology. Furthermore, some subspecies differentiation genes, including sphaerococcum (S), squarehead (Q) and compact (C), are known to be associated with grain shape as well as spike and glume morphology in hexaploid wheat (Tsunewaki and Koba, 1979; Salina et al., 2000; Johnson et al., 2008; Zhang et al., 2011; for a summary of gene nomenclature, see Gene Catalogue 2013, https://shigen.nig.ac.jp/wheat/komugi/genes/download.jsp).
Many researchers have tried to analyze the complex genetic background that regulates grain size and shape. Gegas et al. (2010) identified meta-QTLs (quantitative trait loci) on chromosomes 1A, 3A, 4B, 5A and 6A by examining six doubled-haploid populations. They also measured samples of ancestral wheat species and found a significant reduction in phenotypic variation in grain shape in the modern germplasm pool. Strong QTLs for grain length and parameters related to the lateral characteristics of grains were detected on chromosome 5B in the recombinant inbred lines (RILs) derived from W7984 × ‘Opata 85’, and on chromosome 2D in the RILs derived from ‘AC Reed’ × ‘Grandin’, respectively (Breseghello and Sorrells, 2007). Williams and Sorrells (2014) reported 31 and 30 QTLs for grain morphology in two doubled-haploid populations. Maphosa et al. (2014) detected QTLs for some traits, including grain shape, size and yield, near the loci for photoperiod sensitivity, Ppd-B1 and Ppd-D1, indicating that flowering time can affect different aspects of grain morphology.
As a complement of QTL analysis, genome-wide association (GWA) studies have become popular for identifying genotypes that correlate with phenotypes. GWA analysis can explore wide genetic variation conserved in diverse germplasms, while QTL analysis can only detect the variation between parents (Bergelson and Roux, 2010). Rapidly developing next-generation sequencing technologies allow the detection of a large number of SNPs in a given genome. Huang et al. (2010) sequenced more than 500 diverse rice landraces and found six SNPs very close to, but not exactly within the coding sequence of, the previously identified genes. In common wheat, significant marker-trait associations (MTAs) with 14 markers on chromosomes 2D, 5A and 5B were discovered by association mapping of grain size and shape (Breseghello and Sorrells, 2006). Rasheed et al. (2014) applied high-throughput phenotyping and GWA analysis to a set of 231 lines of synthetic hexaploid wheat, and identified candidate genomic regions underlying grain morphology traits on chromosomes 1A, 2A, 2B, 3A, 3D, 4A, 5B, 6A and 7A. Among these, 13 chromosomal regions matched the previously reported QTLs. Notably, they successfully showed significant MTAs with the previously described grain shape-related genes TaGW2-A1 and TaSus-B1.
In this study, we aimed to identify the genetic elements determining grain morphology in common wheat accessions representing six subspecies. For this purpose, we performed association studies between phenotypes and genotypes on samples from the core collection of hexaploid wheat, which represents the genetic diversity of common wheat conserved ex situ at NBRP-Wheat, Japan (Takenaka et al., 2018). We also aimed to test whether the collection is suitable research material to conduct GWA studies. First, we performed principal component (PC) analysis to find elements determining the differences in grain phenotype among accessions of the core collection. Subsequently, a GWA study was conducted to identify genetic markers associated with grain phenotypes and PCs. We also performed QTL analysis using an F2 population derived from the cross of two accessions, ‘Norin 61’ × KU-3136, which differ in grain morphology.
MATERIALS AND METHODS
Plant materials
For phenotype scoring of grain morphology, we used 189 common wheat accessions of the National BioResource Project (NBRP)-Wheat hexaploid core collection (Takenaka et al., 2018). Detailed information on the core collection is available through NBRP-Wheat (http://www.shigen.nig.ac.jp/wheat/komugi/). Briefly, the core collection is comprised of Triticum aestivum (T. aestivum ssp. aestivum L., 161 accessions), T. spelta (T. aestivum ssp. spelta (L.) Thell., 12 accessions), T. compactum (T. aestivum ssp. compactum (Host) MacKey, six accessions), T. macha (T. aestivum ssp. macha (Dekapr. & Menabde) MacKey, four accessions), T. sphaerococcum (T. aestivum ssp. sphaerococcum (Percival) MacKey, three accessions), T. vavilovii (T. aestivum var. vavilovii Jakubz., two accessions) and a synthetic hexaploid wheat, W7984 (Altar84/Aegilops tauschii (219) CIGM86.940). These accessions have originated from 28 countries or regions, and comprise all hexaploid wheat subspecies with the AABBDD genome. For QTL analysis, 107 F2 individuals from a single F1 plant obtained by a cross between ‘Norin 61’, a Japanese common wheat cultivar, and accession KU-3136, an Iranian landrace, were used in the study. Both parental accessions are members of the hexaploid wheat core collection. For association and QTL mapping, we cultured the plants in the 2011–2012 and 2013–2014 growing seasons, respectively. Plants were grown in a glass house without air conditioning at the Yoshida Campus, Kyoto University, Japan (N35.031, E135.79). Genotype data were adopted from Takenaka et al. (2018).
Phenotyping
Digital measurement of the grains was performed as follows: we placed individual grains on a glass plate, with the crease side facing down, and produced images with a scanner (GT-X820, EPSON, Japan) at resolutions of 240 or 360 dpi. For analysis of images, we employed the software package SmartGrain ver. 1.2, which was developed for high-throughput phenotyping of rice grains (Tanabata et al., 2012) and is also applicable to wheat grain measurement (Okamoto et al., 2013). We measured six parameters related to grain size and shape: area size (AS), perimeter length (PL), grain length (GL), grain width (GW), length to width ratio (LWR) and circularity (CS), as indicated in Supplementary Fig. S1. We adopted the default threshold for accuracy of grain detection, so that extreme values for grain size could be excluded. We also measured the hundred-grain weight (HGW) using an electronic balance (CJ-820, Shinko Denshi, Japan). Measurements were done without biological or technical replications. The number of grains recognized by the software, number of grains measured, means and standard deviations (SDs) of the metric characters (AS, PL, GL, GW, LWR and CS) are given in Supplementary Table S1 for the accessions of the core collection and Supplementary Table S2 for the F2 individuals.
Data analysis
Descriptive statistics of the numerical data were computed using Excel 2013 (Microsoft, USA). Graphical visualization of the data was performed using either Excel 2013 or R ver. 3.4.0 (R Core Team, 2018, https://www.R-project.org/ [as accessed on September 1st, 2018]). Pearson’s correlation coefficients were computed between the parameters measured as mentioned in the preceding section, using Excel 2013. The data on the seven metric characters (including HGW) of the core collection were subjected to principal component (PC) analysis (PCA) by means of correlation matrices using R ver. 3.1.1 (R Core Team, 2018). The first to seventh PCs calculated from the metric characters of the core collection are referred to as PCcore1 to PCcore7, respectively. Association analysis was performed using the pipeline implemented in the software TASSEL 5 (Bradbury et al., 2007). We used the first to fifth PCs obtained from PCA of marker genotypes to infer population structures and generate a general linear model (GLM) for estimation of regression between the genotypes and phenotypes. The minimum allele frequency of markers was set to 0.05. We performed PCA on the data on the seven metric characters (including HGW) of the F2 plants as described above. The first to seventh PCs of the F2 population are referred to as PCpop1 to PCpop7, respectively.
Genotyping and construction of a linkage map and QTL analysis
Genotypes of the core collection accessions were acquired by DArTseq, as described elsewhere (Takenaka et al., 2018). After removing unreliable markers, we used 23,067 DArT markers (9,822 SNPs and 13,245 PAVs) in the present study. Diversity array profiling was performed on the F2 population by Diversity Arrays Technology (Canberra, Australia). For the F2 population (n = 107), a total of 7,792 DArT markers were analyzed. The markers were grouped into linkage groups and assigned to each chromosome using the formLinkageGroups function of R/qtl (Broman et al., 2003). Linkage maps were constructed by MapDisto ver. 1.7.7 (Lorieux, 2012). Markers ambiguously genotyped or showing strong segregation distortion were removed from the data set. After removing the redundant markers, the linkage maps consisted of 1,131 markers (total map length 3144.4 cM, average marker distance 2.9 cM) that were then used for QTL analysis. QTL analysis was conducted by the composite interval mapping (CIM) method in the R/qtl package. The parameters for the analysis were as follows: Marker covars: 3; Window size: 10 cM; Error.prob: 0.0001; and Mapping function: Kosambi. The statistically significant thresholds of the log-likelihood (LOD) scores were determined based on the results of 1,000 repetitions of permutation tests.
RESULTS
Phenotypic variation in grain size and shape observed in hexaploid wheats
We analyzed 189 common wheat accessions of the NBRP-Wheat hexaploid core collection (Takenaka et al., 2018) for grain morphology. The phenotypic variation of the seven characters is depicted in the plots given in Fig. 1, and the mean, standard deviation and range of the characters are summarized in Table 1. Grains of T. sphaerococcum accessions are markedly short and round; they are significantly different, according to Tukey’s HSD tests (P < 0.05), from those of the other subspecies in terms of four characters: PL, GL, LWR and CS (Table 1). In contrast, T. spelta grains had a considerably longitudinally-elongated shape, while their GW was not significantly different from that of the other subspecies (Fig. 1). The characters PL, GL, LWR and CS varied more clearly among the subspecies than the other characters, while differences in AS and GW were not pronounced and HGW was not significantly different in any comparison between two subspecies (Table 1).

Table 1. Mean, standard deviation and range (Min. and Max.) of the grain shape characters in five wheat subspecies examined in this study
| Character |
|---|
| AS (mm2) | PL (mm) |
|---|
| Mean ± SD | Min. | Max. | Mean ± SD | Min. | Max. |
|---|
| T. aestivum (n = 161) | 16.37 ± 2.43b | 10.98 | 24.65 | 17.17 ± 1.40b | 13.70 | 21.68 |
| T. compactum (n = 6) | 17.10 ± 3.61ab | 14.02 | 21.73 | 17.62 ± 2.03bc | 15.36 | 20.25 |
| T. macha (n = 4) | 14.69 ± 0.74ab | 13.70 | 15.47 | 16.94 ± 0.46bc | 16.37 | 17.51 |
| T. spelta (n = 13) | 17.60 ± 2.45b | 14.31 | 21.70 | 18.90 ± 1.08c | 17.22 | 20.87 |
| T. sphaerococcum (n = 3) | 12.25 ± 1.26a | 10.83 | 13.25 | 13.79 ± 0.69a | 13.00 | 14.32 |
| T. vavilovii (n = 2) | 20.16 ± 1.14b | 19.35 | 20.97 | 19.19 ± 0.52bc | 18.82 | 19.55 |
| All accessions | 16.41 ± 2.53 | | | 17.26 ± 1.51 | | |
| Character |
|---|
| GL (mm) | GW (mm) |
|---|
| Mean ± SD | Min. | Max. | Mean ± SD | Min. | Max. |
|---|
| T. aestivum (n = 161) | 6.89 ± 0.62b | 5.38 | 8.80 | 3.10 ± 0.25ab | 2.42 | 3.70 |
| T. compactum (n = 6) | 7.04 ± 0.84bc | 5.96 | 8.15 | 3.13 ± 0.27ab | 2.86 | 3.55 |
| T. macha (n = 4) | 6.95 ± 0.24bc | 6.75 | 7.30 | 2.76 ± 0.13a | 2.65 | 2.93 |
| T. spelta (n = 13) | 7.84 ± 0.46c | 7.09 | 8.74 | 2.94 ± 0.29ab | 2.59 | 3.42 |
| T. sphaerococcum (n = 3) | 5.07 ± 0.23a | 4.81 | 5.23 | 3.18 ± 0.17ab | 2.99 | 3.28 |
| T. vavilovii (n = 2) | 7.67 ± 0.20bc | 7.53 | 7.81 | 3.38 ± 0.08b | 3.33 | 3.44 |
| All accessions | 6.94 ± 0.69 | | | 3.09 ± 0.26 | | |
| Character |
|---|
| LWR | CS |
|---|
| Mean ± SD | Min. | Max. | Mean ± SD | Min. | Max. |
|---|
| T. aestivum (n = 161) | 2.239 ± 0.196b | 1.708 | 2.826 | 0.695 ± 0.034b | 0.604 | 0.795 |
| T. compactum (n = 6) | 2.264 ± 0.204bc | 1.926 | 2.508 | 0.688 ± 0.038ab | 0.634 | 0.745 |
| T. macha (n = 4) | 2.539 ± 0.173cd | 2.364 | 2.773 | 0.642 ± 0.026ab | 0.610 | 0.672 |
| T. spelta (n = 13) | 2.688 ± 0.216d | 2.337 | 3.052 | 0.616 ± 0.036a | 0.569 | 0.680 |
| T. sphaerococcum (n = 3) | 1.601 ± 0.016a | 1.588 | 1.619 | 0.807 ± 0.004c | 0.803 | 0.811 |
| T. vavilovii (n = 2) | 2.273 ± 0.004bcd | 2.271 | 2.276 | 0.688 ± 0.002ab | 0.687 | 0.689 |
| All accessions | 2.267 ± 0.242 | | | 0.690 ± 0.042 | | |
| Character |
|---|
| HGW (g) |
|---|
| Mean ± SD | Min. | Max. |
|---|
| T. aestivum (n = 161) | 4.63 ± 0.74 | 2.88 | 6.60 |
| T. compactum (n = 6) | 5.11 ± 1.17 | 4.00 | 6.60 |
| T. macha (n = 4) | 4.36 ± 0.30 | 3.92 | 4.60 |
| T. spelta (n = 13) | 4.74 ± 0.64 | 3.96 | 5.96 |
| T. sphaerococcum (n = 3) | 4.43 ± 0.16 | 4.28 | 4.60 |
| T. vavilovii (n = 2) | 5.94 ± 0.20 | 5.80 | 6.08 |
| All accessions | 4.66 ± 0.75 | | |
Mean values with the same letters are not significantly different at the P = 0.05 level by Tukey’s HSD tests.
One synthetic wheat line is included in T. aestivum.
The abbreviations of the characters are as follows: AS: area size; PL: perimeter length; GL: grain length; GW: grain width; LWR: length to width ratio; CS: circularity; and HGW: hundred-grain weight.
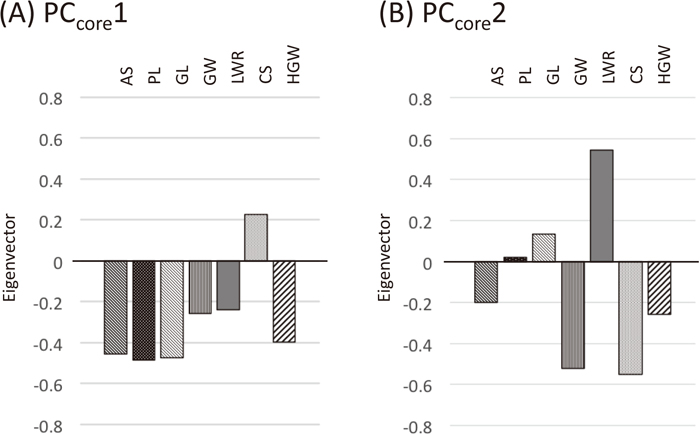
PCA based on the seven characters revealed that PCcore1 and PCcore2 account for 96.6% of the total phenotypic variation, taken together, and for 60.2% and 36.4% of the total variance, individually (Table 2A). These two components sufficiently describe grain shape variation in hexaploid wheat. Almost all the rest of the variance was explained by PCcore3 (3.10%, cumulative to PCcore3 was 99.7%). PCcore1 is negatively correlated with AS, PL, GL and HGW (Fig. 2A); and PCcore2 is negatively correlated with GW and CS, and positively with LWR (Fig. 2B). These results indicate that PCcore1 corresponds to grain size and PCcore2 to grain roundness.
Table 2. Proportion of variance accounted for by each principal component; (A) PC
core calculated from the seven measurements in the core collection, and (B) PC
pop calculated from the seven measurements in the F
2 population
| (A) Core collection | Principal component (PCcore) |
|---|
| PCcore1 | PCcore2 | PCcore3 | PCcore4 | PCcore5 | PCcore6 | PCcore7 |
|---|
| Standard deviation | 2.053 | 1.596 | 0.466 | 0.110 | 0.068 | 0.054 | 0.030 |
| Proportion of variance (%) | 60.2 | 36.4 | 3.1 | 0.2 | 0.1 | 0.0 | 0.0 |
| (B) F2 population | Principal component (PCpop) |
|---|
| PCpop1 | PCpop2 | PCpop3 | PCpop4 | PCpop5 | PCpop6 | PCpop7 |
|---|
| Standard deviation | 2.060 | 1.618 | 0.327 | 0.140 | 0.093 | 0.065 | 0.025 |
| Proportion of variance (%) | 60.6 | 37.4 | 1.5 | 0.3 | 0.1 | 0.1 | 0.0 |
The 189 common wheat accessions were plotted on a PCcore1 and PCcore2 plane to visualize their distribution within taxa (Fig. 3). Accessions of T. aestivum show the widest distribution, which overlaps with accessions of T. compactum. The accessions of T. spelta are on the low PCcore1 and high PCcore2 region of the plot, representing its lanceolate grain morphology. The T. spelta accessions seem to be further divisible into two groups by the PCcore2 value of 3.0. Triticum sphaerococcum accessions form a cluster, distinct from the other groups, occupying a region (high PCcore1 and low PCcore2) remote from T. spelta, while T. macha accessions generally clustered in the region corresponding to small positive PCcore1 and PCcore2 values.
Correlations between measurements concerning grain morphology
We examined correlations between the seven grain morphology characters measured in this study (Table 3). LWR and CS are significantly and negatively correlated (P < 0.001). HGW is positively correlated with AS, PL, GL and GW (P < 0.001). In contrast, HGW is not correlated with LWR or CS, the parameters that indicate roundness of the grain. Both GL and GW showed almost the same level of correlation with AS and HGW. Taking these results together, higher HGW is correlated with enlargement in length or width but not with grain roundness.
Table 3. Correlation coefficient (r) matrix between seven parameters related to grain morphology in the hexaploid wheat core collection
| AS | PL | GL | GW | LWR | CS |
|---|
| PL | 0.935*** | | | | | |
| GL | 0.854*** | 0.981*** | | | | |
| GW | 0.775*** | 0.513*** | 0.348*** | | | |
| LWR | 0.179* | 0.510*** | 0.658*** | −0.472*** | | |
| CS | −0.154* | −0.491*** | −0.640*** | 0.486*** | −0.992*** | |
| HGW | 0.845*** | 0.760*** | 0.666*** | 0.721*** | 0.049 | −0.027 |
Levels of significance are indicated by asterisks: * P < 0.05 and *** P < 0.001.
Abbreviations of the characters are as follows: AS: area size; PL: perimeter length;
GL: grain length; GW: grain width; LWR: length to width ratio; CS: circularity; and HGW: hundred-grain weight.
Patterns of correlations between the seven characters differed by subspecies (Supplementary Table S3). In T. aestivum, GL and GW showed comparable levels of positive correlation with HGW. In T. compactum, HGW had stronger correlation with GL than with GW. Contrarily, in T. spelta, HGW showed stronger correlation with GW than with GL.
Marker-trait associations for grain size and shape
A set of 23,067 non-redundant DArT markers was used to estimate MTAs for the morphological characters and derived principal components (PCcore1 and PCcore2) in the hexaploid wheat core collection. We had the largest number of markers on the B genome (9,717 markers) and the smallest number on the D genome (4,132 markers). Compared with other homoeologous groups, group-4 chromosomes had fewer markers (2,026 markers). The average marker distance was 755 kb in the ‘Chinese Spring’ RefSeq ver. 1.0 (International Wheat Genome Sequencing Consortium [IWGSC], 2018). We detected a total of 15 MTAs (P < 0.05) for five traits (Supplementary Fig. S2 and Table 4): seven for GW on chromosomes 3D, 5D, 6A and 7A; four for AS on chromosomes 2A, 5B, 5D and 6B; two for GL on chromosomes 3D and 6B; and one each for PL and LWR on chromosome 3D and 6A, respectively. One SNP marker on chromosome 5D was commonly associated with AS and GW, and another SNP marker on chromosome 3D was commonly associated with GL and PL. Highly significant (P < 0.001) MTAs for PCcore1 were found on 18 chromosomes, except on 4D, 5D and 7D (Fig. 4A and Table 4). Of these, the markers 9598_67 on chromosome 2A and 1379180|F|0 on chromosome 6B were significantly associated with AS and GL, respectively (Table 4). MTAs for PCcore2 were found on chromosomes 1A, 1D, 2A, 2D, 3A, 3B, 4A, 4B, 5A, 6A, 6B, 7B and 7D (Fig. 4B and Table 4). Interestingly, none of the markers were significantly associated with both PCcore1 and PCcore2.
Table 4. Summary of the markers significantly associated with traits or principal components
| Marker* | Chromosome** | Position** | MAF*** | Trait/PCcore**** | P-value***** | r-square |
|---|
| 165442_43 | 1A | 12,818,392 | 0.083 | PCcore2 | 5.21E-10 | 0.204 |
| 100066446|F|0 | 1A | 357,943,878 | 0.088 | PCcore1 | 6.62E-09 | 0.172 |
| 1243131|F|0 | 1A | 395,485,761 | 0.242 | PCcore1 | 2.34E-10 | 0.206 |
| 19687_32 | 1A | 428,979,651 | 0.164 | PCcore2 | 3.86E-08 | 0.175 |
| 40360_30 | 1A | 584,510,143 | 0.126 | PCcore1 | 1.29E-09 | 0.183 |
| 1040327|F|0 | 1B | 397,452,850 | 0.182 | PCcore1 | 3.02E-08 | 0.173 |
| 96787_35 | 1B | 484,926,181 | 0.288 | PCcore1 | 2.23E-08 | 0.158 |
| 130797_44 | 1B | 527,290,978 | 0.153 | PCcore1 | 2.26E-09 | 0.179 |
| 36467_39 | 1D | 8,717,732 | 0.155 | PCcore2 | 8.24E-09 | 0.220 |
| 86083_11 | 1D | 18,445,793 | 0.337 | PCcore1 | 2.07E-09 | 0.197 |
| 80897_34 | 1D | 35,089,092 | 0.097 | PCcore2 | 3.97E-08 | 0.158 |
| 162689_21 | 2A | 666,202 | 0.331 | PCcore1 | 6.14E-10 | 0.221 |
| 100152207|F|0 | 2A | 2,481,459 | 0.084 | PCcore2 | 2.18E-08 | 0.174 |
| 18679_46 | 2A | 52,561,218 | 0.217 | PCcore1 | 1.46E-08 | 0.180 |
| 100047258|F|0 | 2A | 161,802,985 | 0.087 | PCcore2 | 1.93E-10 | 0.202 |
| 9598_67 | 2A | 176,657,891 | 0.142 | PCcore1 | 2.73E-08 | 0.175 |
| | | | AS | 1.37E-06 | 0.108 |
| 1202353|F|0 | 2A | 533,610,520 | 0.160 | PCcore2 | 3.04E-10 | 0.220 |
| 1201700|F|0 | 2A | 542,735,067 | 0.083 | PCcore2 | 2.19E-08 | 0.162 |
| 984915|F|0 | 2A | 672,292,519 | 0.106 | PCcore2 | 6.20E-10 | 0.214 |
| 147622_10 | 2A | 744,406,984 | 0.428 | PCcore1 | 5.69E-12 | 0.248 |
| 57544_7 | 2A | 755,679,368 | 0.280 | PCcore1 | 2.07E-08 | 0.195 |
| 1053248|F|0 | 2B | 37,638,471 | 0.224 | PCcore1 | 1.52E-08 | 0.180 |
| 1110728|F|0 | 2B | 38,038,226 | 0.235 | PCcore1 | 3.50E-09 | 0.193 |
| 100041532|F|0 | 2B | 38,418,311 | 0.248 | PCcore1 | 6.31E-09 | 0.193 |
| 100014051|F|0 | 2B | 40,820,189 | 0.354 | PCcore1 | 9.94E-10 | 0.196 |
| 2344725|F|0 | 2B | 310,497,217 | 0.207 | PCcore1 | 1.17E-08 | 0.183 |
| 1037325|F|0 | 2B | 425,439,857 | 0.263 | PCcore1 | 1.76E-08 | 0.184 |
| 159273_22 | 2B | 780,874,551 | 0.096 | PCcore1 | 3.67E-08 | 0.171 |
| 1017808|F|0 | 2D | 35,685,901 | 0.131 | PCcore2 | 1.06E-08 | 0.189 |
| 1120403|F|0 | 2D | 35,779,293 | 0.121 | PCcore2 | 2.06E-08 | 0.169 |
| 1206664|F|0 | 2D | 286,683,654 | 0.250 | PCcore1 | 4.93E-09 | 0.192 |
| 44082_15 | 3A | 174,292,933 | 0.155 | PCcore1 | 3.16E-08 | 0.173 |
| 100140827|F|0 | 3A | 269,662,271 | 0.246 | PCcore1 | 3.46E-08 | 0.159 |
| 100100782|F|0 | 3A | 478,240,957 | 0.104 | PCcore2 | 7.88E-09 | 0.188 |
| 2279165|F|0 | 3A | 505,723,125 | 0.290 | PCcore1 | 1.04E-09 | 0.194 |
| 40770_10 | 3A | 552,022,101 | 0.135 | PCcore2 | 1.08E-09 | 0.189 |
| 100117951|F|0 | 3A | 724,802,286 | 0.309 | PCcore1 | 8.12E-10 | 0.194 |
| 128673_61 | 3B | 21,628,278 | 0.268 | PCcore1 | 9.97E-09 | 0.189 |
| 1110031|F|0 | 3B | 160,796,879 | 0.128 | PCcore2 | 1.28E-08 | 0.183 |
| 125966_18 | 3B | 256,434,394 | 0.120 | PCcore1 | 1.06E-08 | 0.183 |
| 100183863|F|0 | 3B | 413,417,874 | 0.091 | PCcore1 | 9.92E-10 | 0.185 |
| 1708031|F|0 | 3B | 455,510,259 | 0.054 | PCcore2 | 3.16E-09 | 0.194 |
| 1059808|F|0 | 3B | 637,336,197 | 0.082 | PCcore2 | 2.92E-09 | 0.204 |
| 52691_18 | 3B | 657,765,792 | 0.090 | PCcore2 | 2.97E-08 | 0.158 |
| 146921_62 | 3B | 728,890,038 | 0.300 | PCcore1 | 8.03E-09 | 0.198 |
| 133817_44 | 3B | 730,308,145 | 0.078 | PCcore2 | 2.76E-08 | 0.174 |
| 2291606|F|0 | 3B | 825,666,355 | 0.359 | PCcore1 | 2.17E-08 | 0.172 |
| 1108004|F|0 | 3B | 825,692,647 | 0.353 | PCcore1 | 4.31E-08 | 0.165 |
| 1060989|F|0 | 3B | 829,296,037 | 0.369 | PCcore1 | 6.45E-09 | 0.185 |
| 127300_57 | 3D | 30,599,336 | 0.080 | PCcore1 | 4.75E-10 | 0.196 |
| 28725_45 | 3D | 97,156,576 | 0.113 | PL | 1.63E-06 | 0.096 |
| | | | GL | 4.08E-07 | 0.098 |
| 2245897|F|0 | 3D | 610,360,064 | 0.316 | GW | 1.22E-06 | 0.115 |
| 138306_19 | 4A | 435,443,248 | 0.149 | PCcore1 | 6.50E-09 | 0.176 |
| 65827_61 | 4A | 651,086,848 | 0.095 | PCcore2 | 1.42E-08 | 0.174 |
| 59384_66 | 4A | 683,442,288 | 0.091 | PCcore2 | 3.28E-09 | 0.204 |
| 1220886|F|0 | 4A | 683,784,501 | 0.114 | PCcore2 | 2.64E-09 | 0.196 |
| 13890_41 | 4A | 716,954,725 | 0.484 | PCcore1 | 6.86E-10 | 0.245 |
| 110819_8 | 4B | 418,520,783 | 0.064 | PCcore2 | 2.09E-09 | 0.185 |
| 161845_32 | 5A | 27,932,867 | 0.070 | PCcore2 | 3.36E-11 | 0.241 |
| 93006_25 | 5A | 31,382,091 | 0.270 | PCcore1 | 3.24E-08 | 0.177 |
| 100110036|F|0 | 5A | 293,198,558 | 0.054 | PCcore2 | 1.67E-08 | 0.160 |
| 129879_40 | 5A | 447,369,048 | 0.351 | PCcore1 | 2.45E-09 | 0.185 |
| 155579_63 | 5A | 471,688,496 | 0.067 | PCcore2 | 6.93E-09 | 0.168 |
| 100008079|F|0 | 5A | 613,008,271 | 0.215 | PCcore1 | 1.09E-08 | 0.168 |
| 995322|F|0 | 5A | 651,588,620 | 0.098 | PCcore2 | 2.46E-08 | 0.177 |
| 1127879|F|0 | 5A | 659,720,753 | 0.127 | PCcore2 | 2.67E-08 | 0.181 |
| 1100614|F|0 | 5A | 660,203,124 | 0.131 | PCcore2 | 2.50E-09 | 0.194 |
| 1075342|F|0 | 5A | 660,838,453 | 0.135 | PCcore2 | 1.18E-09 | 0.207 |
| 1104872|F|0 | 5A | 673,856,849 | 0.158 | PCcore2 | 9.59E-10 | 0.200 |
| 100013271|F|0 | 5B | 13,716,837 | 0.279 | PCcore1 | 1.96E-08 | 0.164 |
| 1110164|F|0 | 5B | 18,412,677 | 0.395 | PCcore1 | 3.18E-09 | 0.193 |
| 148286_38 | 5B | 589,677,126 | 0.266 | PCcore1 | 3.68E-09 | 0.193 |
| 160859_45 | 5B | 598,087,201 | 0.400 | PCcore1 | 5.82E-09 | 0.194 |
| 15092_67 | 5B | 641,042,120 | 0.120 | PCcore1 | 2.52E-10 | 0.216 |
| 1687243|F|0 | 5B | 665,777,977 | 0.170 | PCcore1 | 9.02E-09 | 0.169 |
| 44364_67 | 5B | 689,204,249 | 0.277 | AS | 2.09E-06 | 0.109 |
| 87916_8 | 5D | 438,825,741 | 0.253 | AS | 1.07E-06 | 0.098 |
| | | | GW | 1.11E-07 | 0.130 |
| 12078_7 | 5D | 548,685,082 | 0.089 | GW | 1.91E-06 | 0.105 |
| 90610_29 | 6A | 23,364,154 | 0.199 | PCcore1 | 4.02E-08 | 0.155 |
| 100074651|F|0 | 6A | 77,280,929 | 0.374 | PCcore1 | 8.40E-12 | 0.243 |
| 100116387|F|0 | 6A | 107,214,709 | 0.210 | PCcore1 | 4.53E-09 | 0.172 |
| 1863558|F|0 | 6A | 107,608,385 | 0.236 | PCcore1 | 2.68E-08 | 0.178 |
| 100099397|F|0 | 6A | 431,051,382 | 0.381 | LWR | 1.78E-06 | 0.086 |
| 1951_47 | 6A | 479,995,897 | 0.168 | PCcore1 | 2.10E-08 | 0.177 |
| 1035065|F|0 | 6A | 536,013,866 | 0.051 | DS | 2.69E-08 | 0.124 |
| 131396_52 | 6A | 537,676,061 | 0.053 | DS | 8.44E-08 | 0.120 |
| 100153068|F|0 | 6A | 564,507,113 | 0.077 | PCcore2 | 1.24E-08 | 0.166 |
| 1081406|F|0 | 6A | 564,727,290 | 0.080 | PCcore2 | 5.56E-09 | 0.192 |
| 2256502|F|0 | 6A | 569,601,794 | 0.356 | GW | 4.56E-07 | 0.133 |
| 1219724|F|0 | 6A | 570,341,222 | 0.299 | GW | 1.71E-06 | 0.110 |
| 1379180|F|0 | 6B | 1,020,107 | 0.086 | PCcore1 | 3.69E-09 | 0.174 |
| | | | GL | 1.13E-06 | 0.079 |
| 78451_16 | 6B | 41,371,759 | 0.156 | PCcore1 | 2.66E-08 | 0.181 |
| 148869_13 | 6B | 216,875,194 | 0.072 | PCcore2 | 2.90E-08 | 0.179 |
| 100029002|F|0 | 6B | 489,835,087 | 0.122 | PCcore1 | 4.67E-09 | 0.177 |
| 1270273|F|0 | 6B | 492,495,205 | 0.136 | PCcore1 | 9.95E-09 | 0.166 |
| 100017132|F|0 | 6B | 493,353,110 | 0.137 | PCcore1 | 1.11E-08 | 0.166 |
| 146641_67 | 6B | 521,993,893 | 0.058 | AS | 1.69E-06 | 0.117 |
| 35028_54 | 6B | 583,300,775 | 0.151 | PCcore2 | 3.71E-08 | 0.157 |
| 139259_68 | 6B | 680,302,917 | 0.203 | PCcore1 | 1.97E-08 | 0.178 |
| 90150_64 | 6B | 688,870,066 | 0.099 | PCcore2 | 2.56E-08 | 0.156 |
| 102116_7 | 6B | 689,192,959 | 0.156 | PCcore1 | 1.26E-08 | 0.195 |
| 1864447|F|0 | 6D | 430,364,941 | 0.143 | PCcore1 | 2.22E-08 | 0.161 |
| 1063933|F|0 | 7A | 45,856,698 | 0.083 | GW | 1.27E-06 | 0.110 |
| 100079801|F|0 | 7A | 158,379,371 | 0.243 | PCcore1 | 3.72E-10 | 0.198 |
| 100056709|F|0 | 7A | 533,940,294 | 0.298 | PCcore1 | 1.50E-08 | 0.168 |
| 69961_10 | 7A | 612,027,449 | 0.137 | PCcore1 | 1.41E-08 | 0.183 |
| 57176_7 | 7A | 652,292,856 | 0.214 | GW | 1.19E-06 | 0.125 |
| 55305_31 | 7B | 63,653,934 | 0.140 | PCcore2 | 2.63E-08 | 0.175 |
| 100016544|F|0 | 7B | 111,993,696 | 0.211 | PCcore1 | 1.74E-08 | 0.165 |
| 1272052|F|0 | 7B | 115,243,952 | 0.131 | PCcore1 | 4.86E-09 | 0.174 |
| 112516_9 | 7B | 634,555,218 | 0.124 | PCcore2 | 6.20E-09 | 0.181 |
| 126302_53 | 7D | 10,869,957 | 0.110 | PCcore2 | 3.87E-08 | 0.161 |
| 158848_32 | 7D | 613,766,365 | 0.100 | PCcore2 | 3.53E-08 | 0.174 |
| 14769_24 | UN | 10,239,557 | 0.265 | PCcore1 | 1.51E-08 | 0.180 |
| 142136_8 | UN | 214,317,938 | 0.366 | PCcore1 | 1.76E-09 | 0.187 |
* Markers listed here are significantly associated with the trait (
P < 0.05, after Bonferroni correction) and with PC
core1 and PC
core2 (
P < 0.001, after Bonferroni correction).
** Chromosomal and genomic positions are according to ‘Chinese Spring’ RefSeq ver. 1.0 (
IWGSC, 2018). “UN” indicates unknown chromosomal localization.
*** Minor allele frequency.
**** Trait (AS: area size; PL: perimeter length; GL: grain length; GW: grain width; and LWR: length to width ratio) or principal component (PC
core1 and PC
core2) calculated from them.
*****
P-values before Bonferroni correction.

The F2 population was derived from the cross of Japanese cultivar ‘Norin 61’ (PCcore1 = 1.803, PCcore2 = 1.946 in Fig. 3) with KU-3136, an Iranian landrace (PCcore1 = –1.006, PCcore2 = –0.188 in Fig. 3). A total of 1,131 markers were assigned to chromosomes, with the largest number of markers on chromosome 2B (140 markers) and the smallest number on 5D (four markers). In total, 437, 577 and 117 markers were assigned to A, B and D genomes, respectively. Two linkage groups each were assigned to chromosomes 1B, 1D, 2A, 2D, 3A, 4D, 5D, 6D and 7D, and three to chromosome 7D. QTL analysis was carried out for all the studied characters: AS, PL, GL, GW, LWR, CS and HGW (Supplementary Table S4). We found that a QTL on chromosome 2A for GL showed a significant LOD score (P < 0.05) (Fig. 5). The QTL was significant (P < 0.05) in 96 of 100 repetitions of analysis with CIM. The highest peak of an LOD score was between the DArTseq markers “100015166” and “1079734”, which are separated by 4.8 cM on the genetic map. The physical positions of the markers are at 678 Mb and 684 Mb on the long arm of chromosome 2A (IWGSC, 2018). The QTL contributed 25.4% of the variation in grain length. No significant QTL was detected for other metric characters.

We tried to find QTLs for PCpop1 to PCpop7 calculated from the seven measurements in the F2 population. PCpop1 and PCpop2 account for 98.0% of the total phenotypic variation, and 60.6% and 37.4% of the total variance, individually (Table 2B). PCpop3 explains almost all the rest of the variance (cumulative to PCcore3 was 99.5%). PCpop1 is positively correlated with AS, PL, GL, GW, CS and HGW, and negatively with LWR. PCpop2 is positively correlated with AS, PL, GL, LWR and HRW, and negatively with GW and CS. PCpop3 is negatively correlated with AS, PL, GL, GW and CS, and positively with LWR and HGW. PCpop3 showed strongest correlation to HGW (eigenvector 0.879). Distributions of PCpop scores in the segregation population are depicted in Supplementary Fig. S3. For PCpop3, we found a QTL on chromosome 4B (LOD = 5.801, P < 0.05) in 92 of 100 repetitions of CIM analyses. The most proximal marker to the QTL is at the position 607,638,073 on chromosome 4B in RefSeq ver. 1.0 (IWGSC, 2018), which is a different position from that of the marker showing an MTA to PCcore2 (Table 4).
DISCUSSION
In this study, we analyzed 189 hexaploid wheat accessions corresponding to six subspecies, and found that AS and HGW have little correlation with LWR and CS. The former two parameters (AS and HGW) are metric characters of grain size and the latter two are of grain shape. This result is consistent with the findings of previous studies (Gegas et al., 2010; Rasheed et al., 2014). When the accessions were analyzed separately for each subspecies, patterns of correlations among grain characters were different between subspecies (Supplementary Table S3). It is noted that in T. spelta, AS and HGW are both strongly correlated with GW, and weakly correlated with GL. Since grain morphology is strongly affected by spike morphology, which is often the key character distinguishing the different subspecies of Triticum, there should be structural constraints within a subspecies that delimit the variation of the subspecies-specific metric characters. In other words, subspecies differentiation genes probably affect grain shape to some extent and, thus, most of the subspecies, with the exception of T. compactum, were clustered on the PCcore1–PCcore2 plot (Fig. 3). In the case of T. spelta, long grain shape is a common character of the subspecies, and there is no room for further longitudinal expansion. A narrower range of GL in T. spelta (7.09–8.74) than in T. aestivum (5.38–8.80) is compatible with this hypothesis (Table 1). The multiphyletic origin of T. compactum (Takenaka et al., 2018) may explain the high degree of variation in grain morphology in this species (Fig. 1).
It has been suggested that two traits of grain, size and shape, are largely independent and are under the control of distinct genetic components in wheat (Gegas et al., 2010). In our study, we demonstrated by PCA that PCcore1 and PCcore2 accounted for as much as 96.6% of the variation in grain morphology in the hexaploid wheat core collection. It was also implied that PCcore1 corresponds to grain size and PCcore2 to grain shape, or, more precisely, roundness. Furthermore, markers showing significant associations to PCcore1 and PCcore2 were mutually exclusive. Therefore, our results suggest that grain size and shape are under the distinct controls of multiple loci in the subspecies of hexaploid wheat with an AABBDD genome. We speculate that grain characters measured in this study are the outcomes of epistatic interactions of multiple genetic factors controlling PCcore1 and PCcore2 so that they showed less significant associations to markers in our GWA analysis.
GWA mapping of the core collection detected MTAs on 18 chromosomes except 4D, 5D and 7D for PCcore1, and on 13 chromosomes except 1B, 2B, 3D, 4D, 5B, 5D, 6D and 7A for PCcore2. We noticed that the contribution of the D-genome to grain morphology is smaller than those of the A- and B-genomes of hexaploid wheat. Indeed, only two of the seven chromosomes of the D-genome had significant MTAs for both PCcore1 and PCcore2. Since MTAs for flowering time have been evenly detected on A-, B- and D-genomes, the statistical power of detecting significant MTAs due to low marker density in the D-genome is unlikely to be causal (Takenaka et al., 2018). Alternatively, the D-genome’s relatively minor contribution may reflect the evolutionary history of hexaploid wheat, which originated from hybridization between cultivated tetraploid wheat (T. turgidum L.) and wild goat grass, Aegilops tauschii Coss. (Kihara, 1944; McFadden and Sears, 1944). By QTL analysis of bi-parental populations between two synthetic wheat accessions, Okamoto et al. (2013) indicated that some QTLs affected grain morphology in both Ae. tauschii and the synthetic hexaploid wheat. Grains of cultivated tetraploid wheat have been adapted to a suitable form for human agricultural systems, and, thus, the contribution (probably with negative effects) of Ae. tauschii may have been diminished after hexaploidization through artificial selection by ancient farmers. This hypothesis should be further tested in future studies on grain morphology of the tetraploid wheat core collection, which contains both cultivated and wild tetraploid wheat accessions (S. Takenaka, M. Nitta and S. Nasuda, unpublished data).
An MTA on chromosome 2B for PCcore1, which is correlated with grain size characters (Figs. 2 and 4), may be attributed to the TaSus2 gene that is associated with thousand-grain weight (Jiang et al., 2011). Rasheed et al. (2014) analyzed a major principal component calculated from values recorded based on images of the crease side of grains, and detected MTAs on chromosome 2B as well as on other five chromosomes. On chromosome 2B, a QTL for grain weight was mapped (Huang et al., 2006; Breseghello and Sorrells, 2007; Ramya et al., 2010). Thus, our study adds evidence supporting the hypothesis that chromosome 2B has genetic factors controlling grain size.
An MTA on chromosome 5A for PCcore2 revealed in this study may be within the same linkage disequilibrium (LD) block as the Q gene (Simons et al., 2006), since most T. spelta accessions examined here were monomorphic for markers showing significant MTAs. The genomic sequence of the Q gene (nucleotides 650,130,900 to 650,127,221) is located near the tag sequences of five PAV markers (nucleotides 651,588,620, 659,720,753, 660,203,124, 660,838,453 and 673,856,849 as indicated by the first nucleotide of the tag sequence) on chromosome 5AL in the ‘Chinese Spring’ RefSeq ver. 1.0 (IWGSC, 2018). Breseghello and Sorrells (2006) reported MTAs for grain weight and size on chromosomes 5A and 5B. Simmonds et al. (2014) detected an environmentally robust QTL for grain weight on chromosome 6A, where the TaGW2 gene that affects grain weight and width resides.
QTLs for grain morphology have been mapped on chromosome 2A. It was demonstrated that two allelic variations in the cell wall invertase gene TaCwi-A1 on 2AL affect thousand-grain weight in Chinese germplasms (Ma et al., 2012). We searched for a sequence homologous to TaCwi in RefSeq ver. 1.0, and found that our QTL (678 to 684 Mb) is at a location different from TaCwi-A1 (508 Mb) on 2AL. Tyagi et al. (2015) detected two QTLs on 2AL that are involved in multiple traits of grain size and shape. Williams and Sorrells (2014) detected a QTL for grain length on chromosome 2A, which was confirmed by Rasheed et al. (2014). The QTL we found on chromosome 2A only accounted for grain length but not for other analyzed traits. This observation confirms the finding by Williams et al. (2013) and Williams and Sorrells (2014) that a QTL for grain length on chromosome 2A does not affect other traits of grain morphology. Because the sequences of the markers adjacent to the QTL found by Williams et al. (2013) and Williams and Sorrells (2014) are unknown, we cannot further infer whether our QTL is identical to theirs.
To summarize, we were able to show that the morphological diversity of grains of hexaploid wheat (Fig. 1) can be attributed to two principal component (PCcore) scores related to grain size and shape (Figs. 2 and 3). Genetic markers that had significant association with PCcore1 and PCcore2 were detected on 18 and 13 of the 21 chromosomes of hexaploid wheat, respectively. The diversity of grain morphology of T. aestivum is wider than that of the other subspecies (Fig. 1). Other subspecies, except T. compactum, have narrower diversity as represented by species-specific clustering on the PCcore1–PCcore2 plot (Fig. 3). We also indicated that the NBRP-Wheat hexaploid core collection, which has been extensively genotyped by DarTseq markers (Takenaka et al., 2018), can be used for genetic dissection of complex traits, as exemplified here with grain morphology.
ACKNOWLEDGMENTS
We thank the staff at NBRP-Wheat for their devotion to the project. This work was supported by the National BioResource Project-Wheat from the Ministry of Education, Culture, Sports, Science and Technology, Japan. This manuscript is given the contribution number 621 from the Laboratory of Plant Genetics, Graduate School of Agriculture, Kyoto University.
REFERENCES
- Bergelson, J., and Roux, F. (2010) Towards identifying genes underlying ecologically relevant traits in Arabidopsis thaliana. Nat. Rev. Genet. 11, 867–879.
- Bradbury, P. J., Zhang, Z., Kroon, D. E., Casstevens, T. M., Ramdoss, Y., and Buckler, E. S. (2007) TASSEL: software for association mapping of complex traits in diverse samples. Bioinformatics 23, 2633–2635.
- Breseghello, F., and Sorrells, M. E. (2006) Association mapping of kernel size and milling quality in wheat (Triticum aestivum L.) cultivars. Genetics 172, 1165–1177.
- Breseghello, F., and Sorrells, M. E. (2007) QTL analysis of kernel size and shape in two hexaploid wheat mapping populations. Field Crops Res. 101, 172–179.
- Broman, K. W., Wu, H., Sen, Ś., and Churchill, G. A. (2003) R/qtl: QTL mapping in experimental crosses. Bioinformatics 19, 889–890.
- Evers, A. D., and Withey, R. P. (1989) Use of image analysis to predict milling extraction rates of wheats. Food Microstruct. 8, 191–199.
- Gegas, V. C., Nazari, A., Griffiths, S., Simmonds, J., Fish, L., Orford, S., Sayers, L., Doonan, J. H., and Snape, J. W. (2010) A genetic framework for grain size and shape variation in wheat. Plant Cell 22, 1046–1056.
- Hong, Y., Chen, L., Du, L. P., Su, Z., Wang, J., Ye, X., Qi, L., and Zhang, Z. (2014) Transcript suppression of TaGW2 increased grain width and weight in bread wheat. Funct. Integr. Genomics 14, 341–349.
- Huang, X., Wei, X., Sang, T., Zhao, Q., Feng, Q., Zhao, Y., Li, C., Zhu, C., Lu, T., Zhang, Z., et al. (2010) Genome-wide association studies of 14 agronomic traits in rice landraces. Nat. Genet. 42, 961–967.
- Huang, X. Q., Cloutier, S., Lycar, L., Radovanovic, N., Humphreys, D. G., Noll, J. S., Somers, D. J., and Brown, P. D. (2006) Molecular detection of QTLs for agronomic and quality traits in a doubled haploid population derived from two Canadian wheats (Triticum aestivum L.). Theor. Appl. Genet. 113, 753–766.
- International Wheat Genome Sequencing Consortium (IWGSC) (2018) Shifting the limits in wheat research and breeding using a fully annotated reference genome. Science 361, eaar7191.
- Iwata, H., Ebana, K., Uga, Y., Hayashi, T., and Jannink, J. L. (2010) Genome-wide association study of grain shape variation among Oryza sativa L. germplasms based on elliptic Fourier analysis. Mol. Breed. 25, 203–215.
- Iwata, H., and Ukai, Y. (2002) SHAPE: a computer program package for quantitative evaluation of biological shapes based on elliptic Fourier descriptors. J. Hered. 93, 384–385.
- Jiang, Q., Hou, J., Hao, C., Wang, L., Ge, H., Dong, Y., and Zhang, X. (2011) The wheat (T. aestivum) sucrose synthase 2 gene (TaSus2) active in endosperm development is associated with yield traits. Funct. Integr. Genomics 11, 49–61.
- Jiang, Y., Jiang, Q., Hao, C., Hou, J., Wang, L., Zhang, H., Zhang, S., Chen, X., and Zhang, X. (2015) A yield-associated gene TaCWI, in wheat: its function, selection and evolution in global breeding revealed by haplotype analysis. Theor. Appl. Genet. 128, 131–143.
- Johnson, E. B., Nalam, V. J., Zemetra, R. S., and Riera-Lizarazu, O. (2008) Mapping the compactum locus in wheat (Triticum aestivum L.) and its relationship to other spike morphology genes of the Triticeae. Euphytica 163, 193–201.
- Kihara, H. (1944) Discovery of the DD-analyser, one of the ancestors of Triticum vulgare. Agric. Hortic. 19, 889–890.
- Lorieux, M. (2012) MapDisto: fast and efficient computation of genetic linkage maps. Mol. Breed. 30, 1231–1235.
- Ma, D., Yan, J., He, Z., Wu, L., and Xia, X. (2012) Characterization of a cell wall invertase gene TaCwi-A1 on common wheat chromosome 2A and development of functional markers. Mol. Breed. 29, 43–52.
- Maphosa, L., Langridge, P., Taylor, H., Parent, B., Emebiri, L. C., Kuchel, H., Reynolds, M. P., Chalmers, K. J., Okada, A., Edwards, J., et al. (2014) Genetic control of grain yield and grain physical characteristics in a bread wheat population grown under a range of environmental conditions. Theor. Appl. Genet. 127, 1607–1624.
- McFadden, E. S., and Sears, E. R. (1944) The artificial synthesis of Triticum spelta. Rec. Genet. Soc. Am. 13, 26–27.
- Okamoto, Y., Kajimura, T., Ikeda, T. M., and Takumi, S. (2012) Evidence from principal component analysis for improvement of grain shape- and spikelet morphology-related traits after hexaploid wheat speciation. Genes Genet. Syst. 87, 299–310.
- Okamoto, Y., Nguyen, A. T., Yoshioka, M., Iehisa, J. C. M., and Takumi, S. (2013) Identification of quantitative trait loci controlling grain size and shape in the D genome of synthetic hexaploid wheat lines. Breed. Sci. 63, 423–429.
- Okamoto, Y., and Takumi, S. (2013) Pleiotropic effects of the elongated glume gene P1 on grain and spikelet shape-related traits in tetraploid wheat. Euphytica 194, 207–218.
- Ramya, P., Chaubal, A., Kulkarni, K., Gupta, L., Kadoo, N., Dhaliwal, H. S., Chhuneja, P., Lagu, M., and Gupta, V. (2010) QTL mapping of 1000-kernel weight, kernel length, and kernel width in bread wheat (Triticum aestivum L.). J. Appl. Genet. 51, 421–429.
- Rasheed, A., Xia, X., Ogbonnaya, F., Mahmood, T., Zhang, Z., Mujeeb-Kazi, A., and He, Z. (2014) Genome-wide association for grain morphology in synthetic hexaploid wheats using digital imaging analysis. BMC Plant Biol. 14, 128.
- Salina, E., Börner, A., Leonova, I., Korzun, V., Laikova, L., Maystrenko, O., and Röder, M. S. (2000) Microsatellite mapping of the induced sphaerococcoid mutation genes in Triticum aestivum. Theor. Appl. Genet. 100, 686–689.
- Simmonds, J., Scott, P., Leverington-Waite, M., Turner, A. S., Brinton, J., Korzun, V., Snape, J., and Uauy, C. (2014) Identification and independent validation of a stable yield and thousand grain weight QTL on chromosome 6A of hexaploid wheat (Triticum aestivum L.). BMC Plant Biol. 14, 191.
- Simons, K. J., Fellers, J. P., Trick, H. N., Zhang, Z., Tai, Y. S., Gill, B. S., and Faris, J. D. (2006) Molecular characterization of the major wheat domestication gene Q. Genetics 172, 547–555.
- Su, Z., Hao, C., Wang, L., Dong, Y., and Zhang, X. (2011) Identification and development of a functional marker of TaGW2 associated with grain weight in bread wheat (Triticum aestivum L.). Theor. Appl. Genet. 122, 211–223.
- Takenaka, S., Nitta, M., and Nasuda, S. (2018) Population structure and association analyses of the core collection of hexaploid accessions conserved ex situ in the Japanese gene bank NBRP-Wheat. Genes Genet. Syst. 93, 237–254.
- Tanabata, T., Shibaya, T., Hori, K., Ebana, K., and Yano, M. (2012) SmartGrain: high-throughput phenotyping software for measuring seed shape through image analysis. Plant Physiol. 160, 1871–1880.
- Tester, M., and Langridge, P. (2010) Breeding technologies to increase crop production in a changing world. Science 327, 818–822.
- Tsunewaki, K., and Koba, T. (1979) Production and genetic characterization of the co-isogenic lines of a common wheat Triticum aestivum CV. S-615 for ten major genes. Euphytica 28, 579–592.
- Tyagi, S., Mir, R. R., Balyan, H. S., and Gupta, P. K. (2015) Interval mapping and meta-QTL analysis of grain traits in common wheat (Triticum aestivum L.). Euphytica 201, 367–380.
- Whan, A. P., Smith, A. B., Cavanagh, C. R., Ral, J. P. F., Shaw, L. M., Howitt, C. A., and Bischof, L. (2014) GrainScan: a low cost, fast method for grain size and colour measurements. Plant Methods 10, 23.
- Williams, K., Munkvold, J., and Sorrells, M. (2013) Comparison of digital image analysis using elliptic Fourier descriptors and major dimensions to phenotype seed shape in hexaploid wheat (Triticum aestivum L.). Euphytica 190, 99–116.
- Williams, K., and Sorrells, M. E. (2014) Three-dimensional seed size and shape QTL in hexaploid wheat (Triticum aestivum L.) populations. Crop Sci. 54, 98–110.
- Zhang, Y., Li, D., Zhang, D., Zhao, X., Cao, X., Dong, L., Liu, J., Chen, K., Zhang, H., Gao, C., et al. (2018) Analysis of the functions of TaGW2 homoeologs in wheat grain weight and protein content traits. Plant J. 94, 857–866.
- Zhang, Z., Belcram, H., Gornicki, P., Charles, M., Just, J., Huneau, C., Magdelenat, G., Couloux, A., Samain, S., Gill, B. S., et al. (2011) Duplication and partitioning in evolution and function of homoeologous Q loci governing domestication characters in polyploid wheat. Proc. Natl. Acad. Sci. USA 108, 18737–18742.

