INTRODUCTION
A vertical lightness gradient from a dark back to a light belly is the most common body coloration phenotype in the animal kingdom (Allen et al., 2012), as reported in various animal species, including mammals, birds, fishes and insects (Thayer, 1896; Michaud et al., 1994; Caro, 2005; Kamilar, 2009; Kamilar and Bradley, 2011). The ventral color pattern, known as countershading, is considered to have the effect of making organisms difficult to detect. A marked evolutionary feature of the countershading pattern is that of “repeated evolution,” in which similar traits appear when animals face similar environmental conditions recurrently (Barrett and Schluter, 2008; Gompel and Prud’homme, 2009; Jones et al., 2012). In mammals, more than 150 genes are related to coat coloration (Bennett and Lamoreux, 2003). The agouti signaling protein (Asip) and melanocortin 1 receptor (Mc1r) genes are major determinants of red-yellow (pheomelanin) and black-brown (eumelanin) pigments, which are synthesized in melanocytes (Klungland et al., 1995; Morgan et al., 1999; Hoekstra and Nachman, 2003; Fontanesi et al., 2006, 2010; Kingsley et al., 2009; Mallarino et al., 2016; Suzuki et al., 2020). Switching between the pigment types is regulated by Mc1r, expressed on the cell surface of melanocytes. The production of eumelanin is suppressed by the presence of the antagonist agouti, the product of Asip, the antagonist/reverse agonist of Mc1r, which initiates the production of pheomelanin. In the house mouse Mus musculus, Asip harbors two exon 1-associated promoter regions with different functions related to the ventral coat color and agouti pattern of individual hairs with black and yellow bands (Vrieling et al., 1994). Both genes of Mc1r and Asip are considered to have important roles in the evolution of rapid changes in coat coloration (e.g., Vrieling et al., 1994; Chen et al., 1996; Hoekstra et al., 2004, 2005; Hoekstra, 2006; Iwasa et al., 2018; Sakuma et al., 2019). Geographical variation has also been investigated and it has been reported that natural selection is involved (Hoekstra et al., 2004, 2005; Kingsley et al., 2009; Mullen et al., 2009; Marín et al., 2018).
The color of the coat, in particular the ventral fur color, often differs depending on the geographic location in M. musculus (Marshall, 1998; Slábová and Frynta, 2007; Lai et al., 2008) and has been used as a diagnostic marker in the mouse (Schwarz and Schwarz, 1943; Marshall, 1998). The hair color of this species, which is currently divided into three subspecies groups, i.e., M. m. castaneus (CAS: southern Asia, Southeast Asia and southern China), M. m. domesticus (DOM: western Asia and western Europe) and M. m. musculus (MUS: northern Eurasia) (e.g., Suzuki et al., 2013; Takada et al., 2013), varies both within and between the subspecies (Takada et al., 2021). An understanding of the genetic background of phenotypic variation would allow observations of coat color variation in wild populations to provide insights into phylogenetic background (Kambe et al., 2011; Suzuki, 2013; Kodama et al., 2015; Sasamori et al., 2017; Marín et al., 2018). There are two possible explanations for the hair color variation in the peripheral regions: the alleles of hair color in the source region may have been transmitted to the surrounding regions; or new alleles that arose in situ may have generated the diversity of hair color (Myoshu and Iwasa, 2018). However, to date, no genetic study has investigated the historical episodes of geographic variation of coat color in M. musculus.
To test these explanations, it would be useful to examine genetic variation in the hair color-related genes, understand their spatiotemporal dynamics, and construct an evolutionary scenario. Sequence variation in the coat color-related gene Mc1r (Nunome et al., 2010; Kambe et al., 2011; Kodama et al., 2015; Kuwayama et al., 2017) has been used for phylogenetic inference of rodents, including M. musculus. However, the Asip gene responsible for ventral coat color has not been analyzed in M. musculus. We recently explored the whole-genome sequences of 98 wild-derived mice mainly from Asia (Fujiwara et al., 2021). This allowed us to reconstruct the prehistoric distribution pathways associated with humans based on mitochondrial whole-genome sequences (Li et al., 2021). For example, these results suggest that CAS and MUS arrived in the Japanese archipelago about 3,000 years ago, and since this time they have experienced genetic admixture (Fujiwara et al., 2021; Li et al., 2021).
The present study was performed to assess the evolutionary background of the geographic variation in ventral coat coloration in M. musculus. First, we examined the variation in ventral coloration by spectrophotometry to determine the degree of variability among individuals. Next, we performed phylogeographic analyses with Asip, encompassing a portion of about 180 kb of the mouse genome, utilizing the mouse genome sequences that we reported previously (Fujiwara et al., 2021). This enabled us to establish the coat color variation in the homelands of M. musculus and also the spatiotemporal dynamics of coat color variation as the distribution of M. musculus expanded to follow humans.
RESULTS
Coat color measurements
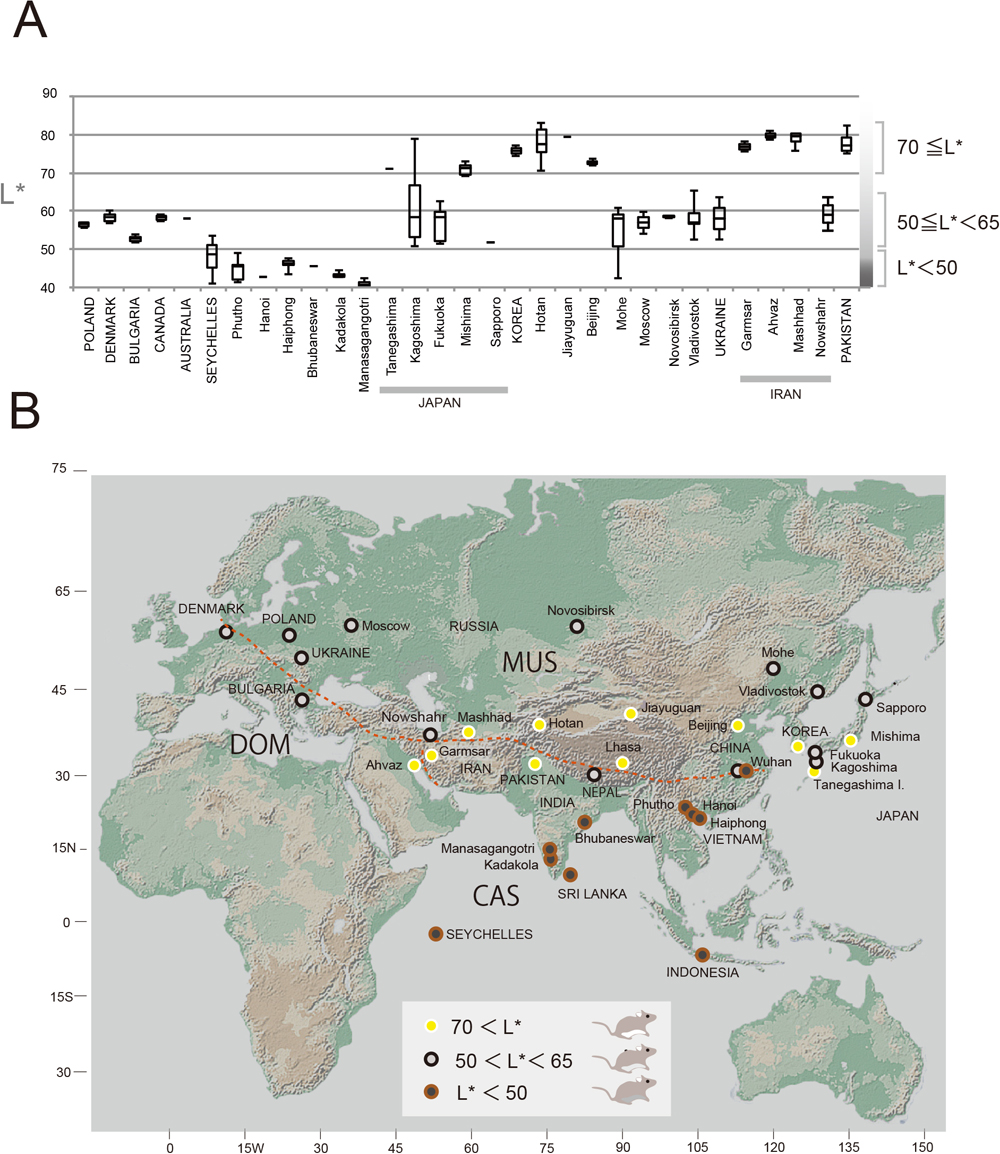
We conducted quantitative measurement of ventral fur color in terms of the CIE L*a*b*-model color parameters in 114 mouse skin specimens from 35 localities (Fig. 1A; Supplementary Table S1). While there were clear differences in the values of lightness (L*) within a locality, there was also a tendency for L* to have roughly similar values within a locality. The averaged L* values representing each of the localities ranged from 40–80 and were classified into two groups for convenience: “gray” (40 < L* < 65) and “white” (70 < L*). The gray group was further divided into two subgroups: dark gray (L* < 50) and light gray (50 < L* < 65). Exceptionally, 10 samples from Wuhan, China exhibited substantial variation in the L* values, from 43 to 57 (Supplementary Table S1). We plotted the groups on a geographic map, which revealed an apparent geographic affinity with latitudinal zonation: the high-, mid- and low-latitude zones harbored the light gray, white and dark gray color groups, respectively (Fig. 1B). The white color group was present in the western range of CAS (Iran and Pakistan), the eastern range of MUS (China, Korea and Japan) and the eastern range of DOM (Iran). The light gray group was present in DOM and MUS from Eastern Europe, Russia and northern Japan. The dark gray group included mice from southern India, Sri Lanka, Vietnam and Indonesia.
From 98 wild mouse genome sequences (Fujiwara et al., 2021; Supplementary Table S2), the 180-kb region from the 3′ end of Eif2s2 to the 3′ end of Asip (specifically, to the end of the exon 4 sequence) was selected (Fig. 2A). We generated a haplotype data set by phasing, resulting in 196 haplotype sequences with 6,671 segregating sites that were used in subsequent phylogenetic analyses.

A neighbor-net (NN) network constructed using the entire Asip gene sequence revealed an overall pattern of clusters representing the three major subspecies groups of CAS, DOM and MUS (Fig. 2B). The MUS network consists of many clusters, and for convenience we divided them into two groups (referred to here as MUS-I and MUS-II) based on geographic information (Fig. 2B). The NN network showed the presence of recombinant-like haplotypes that branched off at intermediate positions of the major subspecies clusters (Fig. 2B). We detected haplotypes integrated into different subspecies-specific clusters in the NN networks or that were present as isolated branches in the middle positions of the subspecies clusters. To identify recombination fragments between haplotypes representing each subspecies, we partitioned the 180-kb sequence into four segments (domains I–IV; ~45 kb each) (Fig. 2A). Domain II contained the ventral-specific promoter region. We constructed NN networks with the four partitioned domains (Fig. 2C). The DOM sequences were shown to be located close to the haplotype cluster of CAS in domain III and embedded within the CAS cluster in domain II (Fig. 2C), suggestive of introgression from CAS to DOM prior to the movement with humans in prehistory. Of the 196 haplotypes, 175 were judged to be non-recombinants having identical cluster formation between the four domains in the networks constructed. The remaining 21 haplotypes either showed different clustering patterns among the four networks or were placed at intermediate positions outside the subspecies-specific clusters, being designated as recombinants (Supplementary Table S2). For example, a recombinant haplotype of Tallinn (Estonia) had MUS-type for domains I–III and DOM-type for domain IV.
Many of the recombinant haplotypes were recovered from the peripheral regions, including the Japanese archipelago (Fig. 2C). Five haplotypes from Hokkaido (four from Sapporo and one from Takikawa) were shown to be similar, with the upper part being MUS-II and the remaining parts CAS. In the Busan (Korea) haplotype (MG0440), the upper half (domains I and II) was MUS-II, whereas the lower half (domains III and IV) involved CAS-derived segments. Recombinants were recovered from the homeland area in northern Iran. Two sequences from northern Iran, MG5135_1 from Nowshahr, and MG0417_1 from Mashhad, were shown to have DOM-derived segments in domain I. The segments of domains III and IV were located in the MUS cluster, while that of domain II was located close to but slightly outside the MUS cluster.
Phylogenetic tree analysis
We constructed a neighbor-joining (NJ) tree for the 175 haplotypes with the K2P substitution model and the option of deletion of all gaps, excluding the 21 predicted recombinant haplotypes (Fig. 3A). The NJ tree showed monophyletic clusters for DOM and MUS. In contrast, it showed a markedly divergent pattern for the CAS haplotypes, consistent with previous results of Mc1r analysis (Kodama et al., 2015).

More detailed branching patterns within subspecies clusters for CAS (Supplementary Fig. S1) and MUS (Supplementary Fig. S2) also appeared in the NN networks. In these phylogenetic analyses, three subclusters exhibited a bush-like clustering pattern with short terminal branches (termed haplogroups a, b and c) in the CAS cluster. The grouping of the three haplogroups exhibited a geographic structure (Fig. 3B). Haplogroup a was represented by haplotypes from southern India. Haplogroup b comprised broadly distributed haplotypes from the northern part of the Indian subcontinent, Nepal, Bangladesh, Yunnan (southeastern China), Sri Lanka and the Russian Far East, including Sakhalin. Haplogroup c was represented by haplotypes from areas including southern China, Vietnam, Indonesia, the Russian Far East and Japan.
Phylogenetic analysis divided MUS into MUS-II, consisting of haplotypes mainly from China, Korea and Japan, and to a lesser extent from Iran and Russia, and MUS-I, consisting of haplotypes from other regions (Fig. 4). The members of MUS-I were distributed over wide areas of the northern part of Eurasia from eastern Europe to the Russian Far East, including Sakhalin. The spatial pattern is essentially consistent with a previous nuclear gene analysis (Nunome et al., 2010), in which MUS was divided into two geographic groups, “northern” and “southern,” corresponding to MUS-I and MUS-II of Asip, respectively. It is notable that haplotypes from Ukraine (Donetsk), the Russian Far East (Birakan and Krementui) and northeast China (Mohe and Manzhouli) formed a cluster connected with short branches (marked by an asterisk in Fig. 4A). MUS-II had a branching pattern expanding from west to east across five regions in sequence: northern Iran (region 1), western China (region 2), northern China (region 3), the Korean Peninsula (region 4) and the Japanese archipelago (region 5) (Fig. 4; Supplementary Fig. S2). This was consistent with the results of a previous study of mitochondrial DNA (Li et al., 2021).

These results indicate close relationships between the source and peripheral areas in the Asip haplogroups, suggestive of the involvement of human-associated migration in determining types of ventral fur color (Fig. 5). In CAS, the allele of Asip, which darkens the abdominal coat color (“dark gray”) somewhere in northern India, was transported to the neighboring eastern area. In MUS, the coat color type “white” was detected in the northeastern part of Iran and the Asip type in northern Iran and the easternmost peripheral region, the Japanese archipelago.
DISCUSSION
Quantitative evaluation of regional differences in the lightness of ventral hair color
In this study, we examined the phylogenetic relationships of the Asip gene to better understand evolutionary implications of coat color variation in the Eurasian house mouse, which has dispersed alongside humans since prehistory. The two subspecies groups of M. musculus that dispersed over a wide area of Asia exhibit considerable diversity in ventral coat color and form three distinct groups based on the lightness (L*) of the ventral fur color (Fig. 1): dark gray (L* < 50) and white (L* > 70) for CAS, and light gray (50 < L* < 65) and white (L* > 70) for MUS in their respective western and eastern distribution areas. DOM in western Europe tends to have light gray fur (50 < L* < 65) similar to that observed in the western region of MUS. However, individuals from Ahvaz in westernmost Iran characterized as having the DOM background are white (L* > 70). MUS distributed in the northern part of Eurasia is light gray (50 < L* < 65) at high latitudes, while that occurring at low latitudes, covering China, Korea and Japan, is white (L* > 70). In general, these results support those reported by Lai et al. (2008) indicating that there is a relationship between coat color and rainfall.
Considering the historical migrations confirmed by mitochondrial DNA sequences (Li et al., 2021) and the Asip sequences (this study), the light and dark coat colors in the secondary distribution areas are likely to be shaped by the eastward movements of MUS and CAS, respectively, as discussed in detail later. Clear variability in coat color was observed in China and the Japanese archipelago (Supplementary Table S1; Fig. 1B). In Wuhan, for example, the majority of L* values indicated dark gray but included some light gray, which could be interpreted as a result of the inclusion of MUS in the CAS background.
Use of the genome sequences of the Asip locus as a genealogical marker
In this study we used the phased genome sequences of the Asip locus (around 180 kb) as a genealogical marker to assess the evolutionary history of coat color variation in Mus musculus. As a result, we observed subspecies-specific clustering patterns in the majority of haplotypes (Figs. 2 and 3). In contrast, recombinant haplotypes between subspecies were also observed to some extent (21/196) (Supplementary Table S2). Many of these recombinants were detected in the marginal regions, such as the Russian Far East and the Japanese archipelago, probably as a consequence of secondary contacts between individuals from multiple migrations of different subspecies at certain ancient times. For example, recombinant haplotypes were recovered from China (CAS/MUS), Korea (CAS/MUS), Japan (CAS/MUS) and Primorye in Russia (CAS/DOM/MUS). The recombinant haplotypes in Japanese mice each appear to be the product of a single break point along the 180-kb segment, which is similar to what was inferred from the previous analysis of Mc1r and its surrounding gene regions (200 kb, Nunome et al., 2010). It is possible to infer the time when hybridization occurred based on the fragment size, number of generations of heterozygosity stage, and recombination rate (Stephens et al., 2001). In their analysis of the gene region containing Mc1r, Kuwayama et al. (2017) examined a 5-Mb segment containing Mc1r and observed that the length of CAS fragments incorporated is ~180 kb, from which they predicted that about 800 generations ago CAS and MUS hybridization started, assuming a recombination rate of 0.5 cM/Mb (Jensen-Seaman et al., 2004), and heterozygous state in every generation. The number of generations per year is uncertain, ranging from one to three, and heterozygosity with different subspecies of haplotypes did not occur in every generation, so there are many unknowns, but it is safe to assume that interspecific hybridization has occurred sometime in the past several thousand years in the Japanese archipelago.
A DOM-like fragment was detected in a MUS population in northern Iran (localities Nowshahr and Mashhad; Supplementary Table S2). We speculate that this introgressed DOM fragment was subsequently moved to the periphery. Our previous studies revealed the presence of short DOM elements embedded in the genome of mice of the MUS background from northern Japan (Nunome et al., 2010; Kuwayama et al., 2017; Isobe et al., 2018). The event of integration of the short DOM segments can be easily discriminated from very recent (e.g., a few decades ago) introgression events, judging from the large DOM fragments of 5 Mb and 3 Mb (Nunome et al., 2010; Kuwayama et al., 2017). To date, the issue of the short DOM fragments in the Japanese archipelago remains unresolved. Future genome-wide analysis of this issue focusing on intersubspecies recombination events may provide a plausible scenario for the presence of short DOM segments in wild Japanese mice.
Phylogenetic evaluation using recombinant haplotypes may be useful not only for relatively recent hybridization, but also for hybridization events that occurred in older times. In the NN network of domains II and III, the cluster of CAS haplotypes encompasses the cluster of DOM haplotypes (Fig. 2C). This indicates the possibility of genetic introgression between CAS and DOM in the past, prior to human-associated migration, as suggested in our previous study on nuclear gene sequences (Kodama et al., 2015). The analysis of nuclear genome sequences can provide useful information to unravel the complex history of interactions between different lineages from the distant past to the present.
Moreover, assessment of recombinant haplotypes provides information on which regions of the gene are correlated with a phenotype of interest. Domain II contains a promoter region specific for ventral coat color (Fig. 2A; Vrieling et al., 1994). Individuals in Hokkaido with haplotypes incorporating a CAS-derived fragment in this region have darker abdominal coloration. This suggests that the type of this segment is an important determinant of the type of ventral coat color. Further studies are required to identify the mutation responsible at the DNA sequence level.
Do nuclear gene sequences provide temporal information in phylogenetic analysis within species, as mtDNA does? The branch length of nuclear gene sequences is known to be greatly influenced by the size of the effective population (Hudson, 1990). For example, the fact that CAS clusters are connected to each other by long branches, as seen in the NN network (Fig. 2) and NJ tree (Fig. 3), may indicate greater genetic diversity and historically larger population sizes. Therefore, in estimating the age of branching and dispersal, it will be important to carefully match the results of mtDNA analysis.
Dispersal of Asip lineages of CAS in association with humans in prehistoric times in southeastern Asia
The ventral coat coloration of “dark gray” occurred in a wide area, including southern India, Southeast Asia and southern China (Fig. 1). The southern foothills of the Himalayas, northern India (here represented by mice from Delhi) and Nepal are likely part of the homeland of CAS, and the candidate source area of the allele responsible for the darker color phenotype. According to Marshall (1998), the dark gray mouse, “Mus castaneus,” occurs in the eastern part of the region of northern India, while mice in the western part of northern India, represented by the locality Delhi in this study, have a white abdomen. In this study, however, the four haplotypes from Delhi exhibited trends of high nucleotide divergence from one another, and two were integrated into haplogroup b (Fig. 3A, Supplementary Fig. S1), which may have coincided with prehistoric human migration and represent the dark gray fur color. Mice from Nepal are known to harbor highly polymorphic CAS-related mtDNA haplotypes (Prager et al., 1998) and are known to be a distinct lineage (NEP) that differs from CAS, MUS, DOM and M. m. gentilulus from Yemen (Duplantier et al., 2002; Sakuma et al., 2016), indicating the presence of NEP haplotypes from around half a million years ago (Li et al., 2021). However, M. musculus from central Nepal (Kishimoto et al., 2021) is shown to have dark-colored ventral fur, with L* values ranging from 63 to 50, corresponding to the class of “light gray” and not “dark gray,” suggesting that mice from central Nepal may not be responsible for the migration of dark gray fur that is now distributed in the southern part of Asia. Taking these observations together, it is possible to conclude that CAS mice expanded their range eastward with humans in prehistoric times from the vicinity of northern India.
The haplotypes for southern India, Bangladesh, Southeast Asia, southern China and Japan, which are part of the current CAS territory, form three bush-like clusters: haplogroups a, b and c (Fig. 3A). The presence of clusters connected by short branches indicates that these haplogroups experienced bottlenecks, which may have been the result of founder effects due to migration. By focusing on these clusters, it will be possible to understand the early spatial dynamics that accompanied the migration of prehistoric people. The temporal aspect of the migration event can be understood by examining the spatial dynamics of Asip (this study) and mtDNA (Li et al., 2021), and then referring to the divergence age obtained by mtDNA analysis.
Our previous study on whole mtDNA sequences demonstrated the haplotype diversification of CAS within the last 8,000 years in these geographic areas, including southern India (Li et al., 2021). Together with the mitogenome analysis, it is possible to use the Asip data to infer the spatiotemporal dynamics of the human-associated prehistoric movements of CAS (Fig. 5). In the mtDNA data, an earlier prominent divergence event in the CAS lineage (CAS-1; see Li et al., 2021) resulted in the emergence of haplogroups including the haplotype from central and southern India (C1a2; see Li et al., 2021). This implies that mice carrying C1a2 of the mtDNA lineage and haplogroup a of Asip moved from the northern part of the Indian subcontinent to the southeastern part of the Indian subcontinent with humans approximately 3,500 years ago (Fig. 5B), which might have been related to the generation of haplogroup a.
In the NJ tree, the cluster comprising haplogroups b and c is monophyletic with a bootstrap value of 90% (Fig. 3). Accounting the geographic origins of the haplotypes, this cluster is assumed to represent C1a1 as described in the analysis of the mitogenome (Li et al., 2021). Diversification of cluster C1a1 seems to have occurred 5,600–4,300 years ago based on the mitogenome analysis (Li et al., 2021). While haplogroup b is weakly monophyletic, haplogroup c is monophyletic with a high bootstrap value of 98%. Based on the geographic distribution of these haplogroups shown in Fig. 3B, we infer that haplogroups b and c originated from northern India and southern China, respectively.
Given the high nucleotide diversity of members of haplogroup b from the west, an eastward migration from the Indian subcontinent to southwestern China (Yunnan Province) was inferred. However, members of haplogroup b are rare in southern China, where haplogroup c predominates, except in Yunnan, and are sporadically distributed in northeast Asia, including Khabarovsk and Poronaysk (central Sakhalin). Therefore, haplogroup b was probably introduced into both northern and southern China at some time in the ancient past. Assuming that it was linked to the divergence of the Indian and southern Chinese mtDNA lineage (C1a1) into two separate lineages (Li et al., 2021), the geographical development of haplogroup b is estimated to have started about 5,600 years ago. It may then have been replaced in the north by MUS and in the south by CAS haplogroup c until the present.
Asip haplogroup c is considered to be associated with distribution events covering a wide area of Southeast Asia, southern China and East Asia, including migration events, probably from Vietnam, to three sites in Indonesia (Bali and two sites on Java, i.e., Lembang and Bogor); each locality has a specific Asip haplotype (Fig. 5). This may be because different haplotypes were introduced and fixed locally, or different haplotypes were fixed in each location via the introduction of polymorphic haplotypes. The Asip data for haplogroup c are consistent with mitogenome analyses indicating a dispersal event of CAS 3,500–2,500 years ago in southern and southeastern China and the Japanese archipelago (Li et al., 2021). Interestingly, our data of Asip suggest that Taiwan and Okinawa were involved in the over-sea migration. Two mtDNA phylogenetic groups were probably introduced into the Japanese archipelago (Li et al., 2021). Whether polymorphic lineages were introduced from a single source, or whether there were two source areas, such as the Yangtze River and the Pearl River, should be clarified by analyzing other nuclear genes in the future. In either case, the introduction of M. musculus from southern China is confirmed as an historical event. Given the already widespread distribution of CAS-related sequences from Hokkaido to Okinawa, it is conceivable that human activity related to this event substantially affected the Japanese archipelago. These results are useful for understanding prehistoric human migration to and through the Japanese archipelago, and our findings strengthen archaeological and human genomic knowledge related to pre- and post-Yayoi period migration events (Leipe et al., 2020; Jinam et al., 2021).
Eastward spread of northern and southern lineages of MUS shaped the geographic variation of coat color
As for the MUS subspecies, the majority of its current distribution range, except for the predicted source area of northern Iran, is in areas where it has expanded its distribution by accompanying humans (Li et al., 2021). Our present phylogenetic analysis divided MUS into two geographical groups, MUS-I and MUS-II (Fig. 4, Supplementary Fig. S2), in accordance with our previous analyses of nuclear gene sequences (Nunome et al., 2010; Kodama et al., 2015). MUS-I and MUS-II, the northern and southern groups, were shown to have the light gray and white ventral fur color, respectively (Fig. 1), indicating that the two groups have separate histories in their long-distance movements.
The MUS-I group consists of a number of clusters, which we divided into three clusters for convenience in order to understand their geographical distribution (Fig. 4); each cluster is widely distributed from the Caspian Sea area to the southern fringe of Russia’s border with China, Primorye and Sakhalin. This suggests an eastward migration, but due to the lack of mtDNA analysis, it is unclear when the species began to expand; the expansion is assumed to have started about 15,000 years ago, the same as MUS-II (Li et al., 2021). Overall, the diversity of MUS-I was higher than that of MUS-II (Fig. 4A), suggesting that a high degree of diversity was maintained during the migration without an efficient bottleneck effect. However, MUS-I has a cluster of short branches (marked with an asterisk in Fig. 4A) that extends from Ukraine to the Russian Far East and northeast China (represented by Manzhouli), suggesting a relatively recent expansion and hence possible multiple trans-Eurasian migration events in MUS-I.
MUS-II exists as a sequential, nested cluster in China (regions 2–3), Korea (region 4) and Japan (region 5) (Fig. 4C), providing a possible pathway for the movements of MUS in northern Asia related to prehistoric humans (Fig. 5). This supports the hypothesis of an eastward migration associated with the development of human agriculture over the past 15,000 years, as suggested by the results of mitogenome analysis (Li et al., 2021). Interestingly, the Asip data indicate that a haplotype (MG0417_2) from Mashhad in northern Iran, where mice have a white abdomen (Fig. 1), is integrated into the same group, MUS-II (Fig. 4B, Supplementary Fig. S2). It is conceivable that MUS with lighter abdominal hair color originated from northern Iran (Fig. 5). However, it is unclear whether the haplotype that causes the white abdomen was selected by chance during the widespread dispersal of humans, or whether it became dominant as a result of natural selection during migration through arid regions, such as the Taklamakan Desert. In any case, it is possible that the haplotype originating in northern Iran was introduced to western and northern China, the Korean Peninsula and the Japanese archipelago as a result of eastward expansion, suggesting that historical factors played the major role in establishing the white belly coat color of MUS in East Asia.
The last process of the MUS-II expansion was the transfer from the Korean peninsula to the Japanese archipelago. The cluster of MUS in the Japanese archipelago subdivides into two clusters with short branch lengths (5a and 5b in Supplementary Fig. S2). These “bush-like” clusters connected by short outer branches in the nuclear gene lineage may indicate divergence associated with bottlenecks caused by founder events. The previous mtDNA analysis showed that the cluster in the Japanese archipelago has experienced rapid expansion events (Li et al., 2021). We should see if nuclear gene sequences can be used to analyze population dynamics in the future. In the Japanese archipelago, MUS appears to be mixed with CAS from southern China and is associated with darker abdominal coat coloration. In fact, in mice from northern Kyushu (Fukuoka), the ventral fur was black (Fig. 1) and one mouse examined retained the CAS haplotype (Supplementary Table S2). While CAS haplotypes are found in various areas of the Japanese archipelago, CAS is rare in the Korean Peninsula. We found CAS fragments in recombinant haplotypes in one mouse (MG0444) from Busan, Korea, but it remains to be determined whether the haplotypes originated independently in the Korean Peninsula or were recently introduced from Japan to Korea.
Conclusion
In this study, we focused on the polymorphism of ventral coat color in wild mice and the genomic sequence diversity of the Asip gene, which is known to be responsible for the polymorphism. The results reconfirmed the geographic diversity within the three subspecies groups; the ventral coat color consisted of white and various levels of gray, conveniently represented by two forms: light gray and dark gray. Alignment of the Asip sequences revealed subspecies-specific haplotypes and recombinant haplotypes among them. It is conceivable that the Asip sequence can be used to trace the history of human-associated migrations, which may have begun as early as 15,000 years ago based on previous mitogenome sequence analysis (Li et al., 2021). In the most recently colonized areas of Asia, we observed the presence of Asip sequences for CAS in the case of dark gray ventral fur and for MUS in the case of white ventral fur. In the Japanese archipelago, the Asip haplotype of MUS probably arrived around 3,000 years ago (Li et al., 2021) from western and northern China and the Korean Peninsula to Kyushu, and expanded from Kyushu to Hokkaido. The CAS Asip haplotype is thought to have come from southern China to coastal areas of the Russian Far East and the Japanese archipelago shortly before MUS entered Japan. This study on Asip suggested that the dark gray and white fur types in the Asian periphery originated from somewhere in northern India and northern Iran, respectively. Further detailed studies are required to analyze the genetic changes in Asip that have led to the changes in coat color.

