ABSTRACT
Southeast Asia supports high biodiversity, in a mosaic of forest types formed by the expansion and contraction of habitats through past climate changes. Among the region’s forest types, the geographical distribution of peat swamp forests has fluctuated intensely over the past 120,000 years. Most peat swamp forests in Southeast Asia are found in coastal regions and formed within the last 7,000 years after a decline in sea level. However, some peat swamps were initiated earlier on substrates of slightly higher elevation, and these peat swamps might have been refugia for peat swamp species in the last glacial period and the high sea level period. We assessed genetic diversity, genetic structure and divergence time of current genetic groups for Shorea albida in Brunei, an endemic tree species of Bornean peat swamp forests, using 18 microsatellite markers. Genetic diversity was not lower than has been found in other Shorea species, possibly because of the high density of S. albida in Brunei. Although overall genetic divergence between populations was low, two populations (Ingei and Labi Road 3) were distinct from the other populations. Analysis using DIYABC estimated that three genetic groups (Ingei, Labi Road 3 and others) diverged simultaneously from their ancestral population, whose effective size was very small, about 7,500 years ago, corresponding to a recent sea level peak in the Belait-Baram river basin. In that high sea level period, some higher-elevation lands remained, and peat formation had already started in this region. We propose that the current genetic structure of S. albida in Brunei was formed from small refugial populations that survived the period of higher sea level in these higher-elevation areas. Because of their relatively high genetic diversity, Brunei’s S. albida populations should become an important genetic resource for the recovery of genetically healthy populations in other parts of northwest Borneo.
INTRODUCTION
Southeast Asia is known as one of the world’s major hotspots of species diversity (Myers et al., 2000). The region’s modern diversity is attributable in part to its mosaic of forest types, which have shifted throughout the Quaternary with fluctuations in climate and sea level (Cannon et al., 2009). Lower global sea levels during the last glacial period dynamically exposed the Sunda Shelf, which underlies what is now the shallow sea between the Malay Peninsula and the islands of Borneo, Sumatra and Java (Irwanto, 2019). At the Last Glacial Maximum, the exposure of the Sunda Shelf created a continent (Sundaland) with a land area approximately twice that of the parts of the continent that remain exposed as islands today (Voris, 2000). However, the distribution of tropical rainforests on exposed Sundaland was reduced by higher aridity (Hewitt, 2004). The tropical rainforests that remained during the glacial period may have acted as refugia for tropical rainforest species and are thought to have persisted on the Indian Ocean side of Sumatra and the eastern part of Borneo during the Last Glacial Maximum (Thomas, 2000; Gathorne-Hardy et al., 2002). The existence of refugia in this area is also supported by population genetic analysis of mammals, insects and tree species inhabiting the Southeast Asian tropical rainforests (Bänfer et al., 2006; Quek et al., 2007; Arora et al., 2010; Ohtani et al., 2013; Utomo et al., 2018). After the Last Glacial Maximum, the sea level rose to reach its maximum extent in the mid-Holocene, and this rise and subsequent decline in sea level have shaped the distribution of modern terrestrial and marine ecosystems across the inner and central portions of the Sunda Shelf (Hanebuth et al., 2011).
Climatic oscillations during the Quaternary affected the geographical distribution of the Southeast Asian tropical rainforests, but the magnitude of distributional changes differed considerably across forest types (Cannon et al., 2009). It has been suggested that over the past 120,000 years, the geographical distribution of coastal-swamp tropical rainforests has fluctuated especially widely compared to the other vegetation types, such as lowland and upland tropical rainforests (Cannon et al., 2009). This might be because the distribution of coastal peat swamp forests is affected not only by changes in temperature and aridity, but also by changes in coastlines due to rising and declining sea levels. Coastal peat swamps in Southeast Asia are relatively new, having formed about 5,000–7,000 years ago, after the stabilization of global sea levels (Anderson and Muller, 1975; Caline and Huong, 1992; Dommain et al., 2011). However, peats in some locations were initiated during the last glacial period (Taylor et al., 2001; Page et al., 2004; Dommain et al., 2011).
Current tropical peat swamps mostly occur as ombrotrophic mires (Morley, 2000), and they are particularly widespread in low-lying coastal regions, but are also found locally further inland in areas of slightly higher elevation (Morley, 2013). Peat swamps that formed at higher elevations in locations such as swales between low hills may have persisted through periods of higher sea level when most coastal peat swamps were eliminated by the sea transgression. Through these dramatic environmental changes, old peats that formed during the last glacial period and persisted at slightly elevated sites may have acted as refugia for peat swamp species, although possibly with small population sizes. Refugial populations that are small and isolated are strongly affected by genetic drift, which increases their difference from other populations. Therefore, if slightly elevated areas have acted as refugia for peat swamp species, it is expected that this genetic structure will be found in existing peat swamp species.
A majority of forest canopies in Southeast Asia are dominated by trees from the family Dipterocarpaceae (Ghazoul, 2016). In particular, in the peat swamp forests of northwest Borneo, the dipterocarp tree Shorea albida is dominant or often monodominant in three of six peat swamp phasic communities (Anderson, 1963). This species is endemic to Borneo and is distributed from the lower Kapuas River catchment in West Kalimantan, Indonesia up the coast of Borneo to Brunei Darussalam (Ashton, 2004). Because of the great importance of this species in the flora of peat swamps throughout its range, the genetic structure and population history of this species can be used to reveal the location of refugia and the dynamic distribution of peat swamps in this part of Borneo.
Although S. albida is locally abundant in the peat swamp forests of northwest Borneo, the extent of these forests has been dramatically reduced due to deforestation in the last three decades (Miettinen et al., 2016). Of the peatlands in Peninsular Malaysia, Sumatra and Borneo in 2015, only 6.4% are covered by pristine peat swamp forest (Miettinen et al., 2016). In contrast, Brunei has retained 66.7% of pristine peat swamp forests (Miettinen et al., 2016), a remarkably high proportion compared with other regions in Southeast Asia. Brunei has also maintained the largest population of S. albida during its decline in Kalimantan and Sarawak due to land use change (Randi et al., 2019). Therefore, the conservation of the remaining populations of S. albida in Brunei may be critical for the genetic health of the species. At present, many species need human intervention to ensure their survival (Frankham et al., 2012). However, devising suitable intervention strategies for species and populations requires an understanding of the current situation of the target species or populations. Population genetic studies can provide valuable insights such as the level of genetic diversity, genetic structure and population history, which can assist in the long-term planning of conservation strategies. Therefore, a better understanding of the population genetics of S. albida can not only provide insights into the dynamics of peat swamp forests in the region through recent glacial cycles, but also contribute to the conservation and protection of this important species. The genetic variation of three populations of S. albida has been previously investigated in Brunei using isozyme analysis (Sukri and Kamariah, 2005). However, a detailed genetic characterization of various populations of S. albida in Brunei has not been attempted to date.
In this study, we conducted extensive sampling of S. albida populations in Brunei and examined their genetic diversity, genetic structure and population history using 18 microsatellite markers. The objectives of this study were to compare the genetic diversity of S. albida with that of other Shorea species as estimated in previous studies, to identify genetically distinct populations and infer the time and order of their divergence, and thus to describe the current genetic structure of S. albida in Brunei. The results of our study will contribute to establishing conservation strategies for S. albida.
RESULTS
Genetic diversity and differentiation
A total of 110 distinct alleles were detected at 18 loci. Tum1602F14 and Tum1602L21 were monomorphic (Supplementary Table S1). Null allele frequency ranged from 0.000 to 0.051 (Supplementary Table S1). The frequencies of null alleles were considered to be low for all loci, following Chapuis and Estoup (2007). Labi Road 3 exhibited the lowest values of allelic richness (AR = 2.053) and expected heterozygosity (HE = 0.293) (Nei, 1987), while the HE values in other populations were similar to the mean HE of 0.402 (Table 1). The fixation index (FIS) was not significant in any populations. BOTTLENECK analysis showed heterozygosity deficit in Kuala Balai, Labi Road 1, Labi Road 2, Labi Road 3, Mendaram, Penjarai and Penjarai Northeast. No heterozygosity excess was detected (Table 1).
Table 1. Summary of estimated population genetic parameters and BOTTLENECK analysis
| Population | N | AR | HE | FIS | Wilcoxon test probabilities |
|---|
| a | b | c |
|---|
| Badas pipeline East | 21 | 2.591 | 0.436 | 0.11 | 0.054 | 0.953 | 0.107 |
| Badas pipeline South | 5 | 2.833 | 0.481 | −0.04 | 0.335 | 0.687 | 0.670 |
| Badas pipeline West | 15 | 2.546 | 0.404 | 0.04 | 0.052 | 0.955 | 0.104 |
| Ingei | 18 | 2.462 | 0.402 | 0.01 | 0.138 | 0.874 | 0.277 |
| Kuala Balai | 6 | 2.251 | 0.356 | −0.04 | 0.046* | 0.961 | 0.092 |
| Labi Road 1 | 18 | 2.537 | 0.408 | −0.01 | 0.009* | 0.992 | 0.018** |
| Labi Road 2 | 19 | 2.722 | 0.461 | 0.00 | 0.015* | 0.987 | 0.030 |
| Labi Road 3 | 17 | 2.053 | 0.293 | −0.08 | 0.032* | 0.974 | 0.064 |
| Mendaram | 8 | 2.529 | 0.413 | −0.07 | 0.029* | 0.975 | 0.058 |
| Penjarai | 19 | 2.472 | 0.397 | −0.03 | 0.008* | 0.994 | 0.015** |
| Penjarai Northeast | 20 | 2.291 | 0.367 | 0.03 | 0.013* | 0.989 | 0.026 |
| Total (N) or mean (HE) | 166 | – | 0.402 | – | – | – | – |
N: number of samples; AR: allelic richness after rarefaction to sample size four, calculated after removing individuals having missing data; HE: expected heterozygosity; FIS: fixation index. P values for FIS for each population are calculated based on 198,000 randomizations. P values of the Wilcoxon signed-rank test in BOTTLENECK assume the two-phase model. Probabilities for heterozygosity deficit (a), heterozygosity excess (b) and heterozygosity deficit or excess (c) are shown. *P < 0.05; **P < 0.025.
The overall FST (Weir and Cockerham, 1984) across all populations was 0.04. Pairwise FST between populations ranged from 0.0003 between Badas pipeline East and Badas pipeline West to 0.1374 between Badas pipeline South and Labi Road 3 (Supplementary Table S2). Across 55 pairs, 26 had FST significantly different from zero. Labi Road 3 and Ingei populations were clearly distinct from other populations, and FST was significant for most pairs involving at least one of these populations. The Mantel test did not support a correlation between population differentiation and geographic distance (R2 = 0.0687, P = 0.198). Principal coordinate analysis (PCoA) showed that Badas pipeline South, Ingei, Kuala Balai and Labi Road 3 were located away from other populations (Fig. 1). The analysis did not reveal a clear difference between populations on different soil types (podzol or shallow peat vs. deep peat).

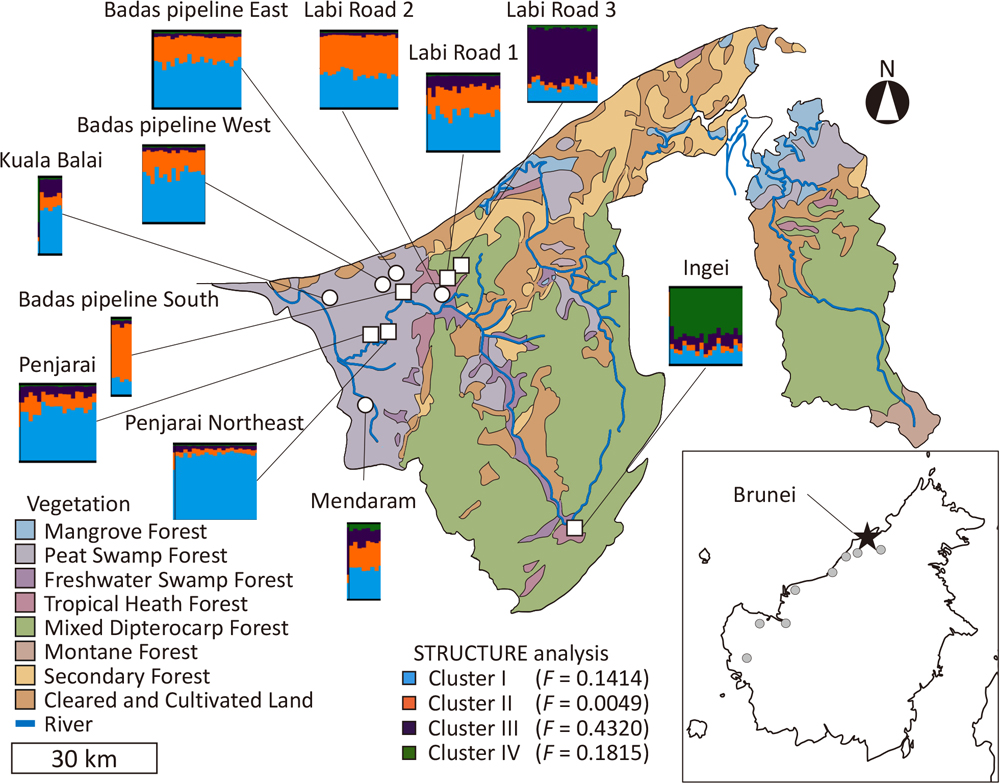
STRUCTURE analysis showed that both ΔK and L(K) were the highest at K = 4, indicating that K = 4 is the most likely number of clusters (Supplementary Fig. S1). At K = 4, the composition of the four clusters varied across populations but was similar among individuals in each population (Fig. 2). Cluster I was shared in all populations, but the proportion varied. Clusters III and IV dominated in Labi Road 3 and Ingei, respectively. Individuals with these combinations of clusters were not observed in the other populations. The F-values ranged from 0.0049 to 0.4320, with the highest value in Cluster III.
Demographic inference
In DIYABC, scenario 4 had the highest posterior probability, indicating that the three genetically distinct populations diverged simultaneously (Fig. 3, Table 2). The 95% confidence intervals (CIs) for scenario 4 did not overlap with those for the other scenarios. The medians of N1, N2 and N3 were 7,760 (95% CI: 1,920–18,400), 5,110 (95% CI: 971–17,500) and 3,420 (95% CI: 609–16,400), respectively, and were much higher than Na (813 with 95% CI of 68.8–3,580). The median of t2 was 125 (95% CI: 25.4–565) generations ago (Supplementary Table S3, Supplementary Fig. S2). Assuming a generation time of 60 years for dipterocarp species (Ashton, 1969), t2 corresponded to 7,500 (95% CI: 1,524–33,900) years ago. In scenario 4 of DIYACB, 14 of the 48 summary statistics showed a significant difference between the observed and simulated data based on the posterior distribution (Supplementary Table S4). Most of these discrepancies were observed in the group of trinucleotide motifs. Principal component analysis (PCA) showed that the observed data set fell within the cluster of points of the posterior distribution (Supplementary Fig. S3). Therefore, the selected scenario was regarded as fitting to the observed data.

Table 2. Posterior probabilities and their confidence intervals for four scenarios in DIYABC based on the logistic approach
| Scenario | Posterior probability [lower and upper 95% confidence intervals] |
|---|
| 1 | 0.0229 | [0.0176–0.0282] |
| 2 | 0.0540 | [0.0415–0.0666] |
| 3 | 0.0949 | [0.0750–0.1147] |
| 4 | 0.8282 | [0.8042–0.8522] |
DISCUSSION
The mean HE within populations was 0.402 for S. albida. This is lower than S. lumutensis (HE = 0.609–0.673; Lee et al., 2006), S. macrophylla (mean HE = 0.67; Utomo et al., 2018), S. platyclados (mean HE = 0.680; Ng et al., 2019) and S. parvifolia (mean HE = 0.433–0.649; Ohtani et al., 2021), but is comparable to S. leprosula (HE = 0.293–0.425, Ohtani et al., 2013). A high level of genetic diversity of S. albida in Brunei was also reported from an isozyme study (Sukri and Kamariah, 2005). These data indicate that the mean heterozygosity of S. albida is not substantially lower than among other Shorea species, even though S. albida is specialized to peat swamps and hence restricted to a narrow ecological and geographical area. However, comparing genetic diversity across studies requires caution because mutation rate and the level of genetic diversity vary across loci. If genetic diversity increases with larger effective population size, as the neutral theory predicts, it is expected that locally gregarious species can hold more genetic variation within a population. In tropical forests of Asia, because of high tree species diversity, the population density of respective species is often low. For instance, the density of reproductive individuals of common Shorea species is often no more than 5.0 per hectare, and, for rare Shorea species, may be less than 1.0 per hectare (Ashton, 1988). In contrast, the upper canopy of peat swamp forests in Brunei often consists purely of S. albida, and so the local population density may be exceptionally high. For example, 43.4–86.0 reproductive individuals per hectare were found in the Badas peat swamp forest (Becek et al., 2022). Therefore, the substantial genetic diversity in S. albida found in this study may result from a large local tree density.
Pairwise FST and STRUCTURE analysis indicated that both the Labi Road 3 and Ingei populations were significantly differentiated from other populations. Interestingly, Labi Road 3 showed a different genetic structure even though it is located near other populations. Genetic differentiation over short geographic distances may arise from a restriction of gene flow, for example by short pollen and seed dispersal distances or by geographic barriers, or as a legacy of past refugia. Genetic differentiation due to limited dispersal of S. albida pollen and seeds seems plausible but is inconsistent with the similarity of most of the sampled populations except Ingei and Labi Road 3. Assuming a similar mating system (outcrossing) and pollinators between S. albida and other Shorea species, pollen and seed dispersal distance could limit gene flow among the populations in the present study. The average pollen dispersal distance among Shorea species has been found to be no more than a kilometer (Lee et al., 2006; Tani et al., 2009, 2012; Masuda et al., 2013). Smith et al. (2015) found that fruits of ten Shorea species dropped from a 30 m canopy observation tower dispersed no more than 40 m. However, if short pollen and seed dispersal distances were creating genetic structure across populations, more differences between populations would be expected. Neither is Labi Road 3 more isolated by geographic barriers than other sites. Thus, the genetic differentiation of the Labi Road 3 and Ingei populations is likely the legacy of past displaced populations rather than the result of limited gene flow.
Refugial populations are formed by isolation from other populations. Isolation of small populations of S. albida in the past may have occurred during periods of high sea level. The sea level of the Sunda region rose rapidly from 19,000 to 8,000 years ago and was 5 m higher than the modern sea level in the mid-Holocene, 4,200 years ago (Hanebuth et al., 2011). The rise in sea level inundated low-lying coastal land areas. In the Belait-Baram river basin where most of the S. albida populations in this study are found, the sea extended inland in the transgressive period, believed to have started about 7,000 years ago (Furukawa, 1988). However, at the same time, some sand terraces and sand ridges remained exposed, and basal peat ages show that peat formation was already initiated at these sites before global sea level stabilization (Furukawa, 1988). Our analysis using DIYABC estimates that the current three genetic groups diverged from the ancestral population 7,500 years ago, corresponding to the sea level highstand in the Belait-Baram river basin. This suggests that the current genetic structure of S. albida was formed in this period of high sea levels. Note that the divergence time may be underestimated because DIYABC assumes no migration among populations (Semerikov et al., 2013), and the STRUCTURE analysis showed admixture that may be the result of migration. During this period, refugial populations of peat swamp species may have persisted in restricted peatland areas. Refugial populations are small and isolated and therefore tend to diverge from other populations by genetic drift. Consistent with this interpretation, the F-value of Cluster III (F = 0.4320), which occupies Labi Road 3, is markedly higher than other populations, suggesting that this population was affected by strong genetic drift. Therefore, we interpret the current genetic groups as having been formed in the sea transgression period, when small populations were maintained as refugia.
Most Southeast Asian peat swamps were formed about 5,000 years ago in low-lying coastal areas after the stabilization of global sea levels (Anderson and Muller, 1975; Caline and Huong, 1992). The initiation and expansion of these peat swamps provided an opportunity for rapid population growth in peat swamp species that survived as small populations during the high sea level period. A BOTTLENECK test did not show any heterozygosity excess, which is a signature of a population bottleneck in the recent past (< 4N generations ago). However, the test showed significant heterozygosity deficits for 7 of 11 populations, suggesting that there has been recent population expansion. The higher values of N1, N2 and N3 than of Na in DIYABC also support the population expansion. These signs of growth in populations are consistent with a previous simulation study suggesting that coastal-swamp evergreen forests expanded dramatically when the Sunda shelf began to flood, especially around 11,000 to 9,000 years ago (Cannon et al., 2009).
Genetic diversity is necessary for species to adapt to environmental changes and reduce extinction risk. Shorea albida in Brunei showed a substantial level of genetic diversity in this study, and this level should be maintained. For re-establishing self-sustaining wild populations, individuals for reintroductions should be selected from multiple genetic groups to increase genetic diversity if the species is outcrossing. A study of S. albida-dominated peat swamp forest at Badas, Brunei revealed a lack of natural recovery from past disturbances caused by logging and caterpillar infestation (Becek et al., 2022), suggesting that human intervention such as afforestation is required for the recovery or regeneration of S. albida populations. All genetic groups of S. albida in Brunei can serve as genetic resources for the establishment and recovery of genetically healthy populations of S. albida in regions of severe population decline in other parts of its range. Our sampling has not yet covered the full geographic range of S. albida, implying that genetic diversity and genetic structure at the species level are still underestimated in this work. Further research with unsampled populations is necessary to obtain an accurate estimate of genetic diversity and genetic structure at the species level, and will help to develop more effective conservation strategies for this species.
In conclusion, although S. albida is geologically and ecologically restricted, our results indicate that a substantial level of genetic diversity is maintained in this species in Brunei, possibly supported by the high tree density of S. albida in this region. There is a significant population structure, which appears to be a legacy of refugial populations that persisted through periods of high sea level. The refugial populations may have been affected by long-lasting environmental pressure, leading to adaptation to unfavorable environments (such as arid climate). This study suggests the importance of maintaining S. albida in Brunei and its value as a genetic resource for re-establishing populations in the future.
MATERIALS AND METHODS
Plant materials and DNA isolation
Leaf or cambium samples of S. albida were collected from 11 locations in Belait district, Brunei Darussalam (Supplementary Fig. S2). At six of these locations (Badas pipeline South, Ingei, Labi Road 1, Labi Road 3, Penjarai and Penjarai Northeast), S. albida individuals grow on podzols or shallow peat (< 1 m) associated with white sand terraces (Ashton, 1964; Furukawa, 1988). These sites support plant communities classified by Anderson (1963) and Anderson and Marsden (Forestry Consultants) Ltd. (1984) as alan batu or kerangas, except for Labi Road 3, which is influenced by alluvial inputs from Sungai Bedas and is classified as freshwater swamp forest. At the other five locations (Badas pipeline East, Badas pipeline West, Kuala Balai, Labi Road 2 and Mendaram), the sampled alan batu, alan bunga and alan padang communities occur on deeper peat. The samples were dried with silica gel. DNA was extracted by the modified cetyltrimethylammonium bromide method (Tsumura et al., 1996). If the PCR amplification was insufficient, the extracted DNA was further precipitated with polyethylene glycol 6000 using the method of Paithankar and Prasad (1991).
SSR genotyping
Eighteen microsatellite loci were used for genotyping. Type-it Multiplex PCR Master Mix (Qiagen) was used to amplify these SSR loci. PCR mixtures (10 μl) contained approximately 10 ng of genomic DNA, 2.5 μl of Type-it Multiplex PCR Master Mix (Qiagen) and 1.25 or 2.5 pmol each of forward and reverse primers (Supplementary Table S5). For fifteen loci (Tum0310K05, Tum1602F14, Tum1602L21, Tum1607P13, EMs53602, EMs73843, EMs99744, EMs102493, Spl529, Spl599, Spl600, Spl629, Spl764, Spl834 and Spl855), a three-primer approach PCR was conducted (Neilan et al., 1997) with universal primers named Tail A, Tail B, Tail C and Tail D (Blacket et al., 2012). Tail A (5′-GCCTCCCTCGCGCCATCAG-3′), Tail B (5′-GCCTTGCCAGCCCGC-3′), Tail C (5′-CAGGACCAGGCTACCGTG-3′) and Tail D (5′-CGGAGAGCCGAGAGGTG-3′) were labeled with fluorescent FAM, VIC, NED and PET, respectively. Additional primer sequences corresponding to universal primers (Tail A, Tail B, Tail C and Tail D) were added to the 5′ end of each forward primer. PIG tails (5′-GTTTCTT-3′) were added to the 5′ end of reverse primers for the four loci (Brownstein et al., 1996). The PCR mixture (10 μl) for the three-primer approach PCR contained approximately 10 ng of genomic DNA, 5.0 μl of Type-it Multiplex PCR Master Mix (Qiagen), 0.25 to 4 pmol of forward primers and reverse primers, and the same amount, with forward primers, of universal primers.
The PCR program on the thermal cycler was set to one step of 5 min at 95 ℃, 30 cycles of 30 s at 95 ℃, 1.5 min at 50–65 ℃ and 30 s at 72 ℃, followed by a final extension for 30 min at 60 ℃. Fragment sizes were determined using the 310 Genetic Analyzer (Applied Biosystems) and verified using GeneMapper version 3.0 (Applied Biosystems).
Data analysis
The observed heterozygosity (HO) and expected heterozygosity (HE) were calculated at each locus using GenAlex 6.4 (Peakall and Smouse, 2006, 2012). Null allele frequencies were estimated at each locus using FreeNa (Chapuis and Estoup, 2007). AR was estimated in each population using the ADZE program after removing missing data (Szpiech et al., 2008). HE (Nei, 1987) was calculated for each population using FSTAT 2.9.4 (https://www2.unil.ch/popgen/softwares/fstat.htm, updated from Goudet, 1995). FIS was calculated for each population using FSTAT. Markov chain Monte Carlo was used for this test with the following parameters: 10,000 dememorization steps, 100 batches and 5,000 iterations per batch. The occurrence of recent population bottlenecks was evaluated with Wilcoxon’s signed rank test as implemented in BOTTLENECK version 1.2.02 assuming a two-phase model (Piry et al., 1999).
Pairwise FST values (Weir and Cockerham, 1984) among populations and their statistical significance after standard Bonferroni corrections were estimated using FSTAT. The nominal level was adjusted for multiple comparisons. PCoA was performed on the populations. A Mantel test was conducted to examine a correlation between genetic distance and geographic distance. These analyses were conducted using GenAlex 6.4. Individual-based Bayesian clustering analysis was performed using STRUCTURE version 2.3.4 (Pritchard et al., 2000) with an admixture model and the “Use sample location as prior (LOCPRIOR)” model (Hubisz et al., 2009). Ten independent runs were conducted with a 50,000 burn-in period and 100,000 Markov chain Monte Carlo repeats. The range of the number of clusters (K) was set from 1 to 11. The best K was inferred from the value of ΔK, and mean LnP(K) calculated by STRUCTURE HARVESTER (Earl and vonHoldt, 2011). The outputs of the ten runs in the inferred best K were averaged by CLUMPAK (Kopelman et al., 2015).
DIYABC ver. 2.1 was used to infer population demography based on Approximate Bayesian computation (Cornuet et al., 2014). Based on the results from STRUCTURE and PCoA analysis, we defined three groups: Pop1 (Badas pipeline East, Badas pipeline South, Badas pipeline West, Kuala Balai, Labi Road 1, Labi Road 2, Mendaram, Penjarai and Penjarai Northeast), Pop2 (Ingei) and Pop3 (Labi Road 3). Four scenarios were tested (Fig. 3). In all scenarios, we defined t# as elapsed time in generations, and N# as the effective population size in each period. The default prior values were used for all parameters, except for the maximum value of N# = 20,000, which resulted in better posterior distributions in pilot runs. Scenario 1 is that Pop1 and Pop2 diverged from Na12 at t1, and Na12 and N3 diverged from an ancestral population (Na) at t2. Scenario 2 is that Pop1 and Pop3 diverged from Na13 at t1, and Na13 and N2 diverged from Na at t2. Scenario 3 is that Pop2 and Pop3 diverged from Na23 at t1, and Na23 and N1 diverged from Na at t2. Scenario 4 is that Pop1, Pop2 and Pop3 diverged from Na at t2. For DIYABC analysis, eighteen microsatellites were classified into two groups according to the motif length (i.e., dinucleotide and trinucleotide motifs). The mean number of alleles, mean genetic diversity and mean allele size variance were used as summary statistics for each population. The number of alleles, mean gene diversity, FST and mean index of classification were used as summary statistics for each of the population pairs. A million simulations were run for each scenario. To evaluate the discrepancy between a model–posterior combination and observed data, the goodness-of-fit of the scenario was assessed by the option ‘model checking’ with PCA in DIYABC.
ACKNOWLEDGMENTS
We thank the Brunei Forestry Department for a use and collection permit to conduct research in forest reserves and stateland forests (Ref: [240]/JPH/UND/17 PT.1); the Brunei Museums Department for permission to access and collect samples from the Tasek Merimbun Heritage Park (Ref: /JMB/1029/97/6); Nur Khalish Hafizhah Ideris for providing Mendaram specimens; the Brunei National Herbarium for assistance with fieldwork and sample collections; and Awang Jangarun anak Eri, Salwana Md Jaafar, Haji Bohari bin Idi, Surin Kumar Thamilselvam, Jeffery Muli anak Incham and Ramasamy anak Zulkiflee for fieldwork support. This research was supported by JSPS KAKENHI Grants (17H04602, 22K06374 and 22H02388), the National Research Foundation Singapore through the Singapore-MIT Alliance for Research and Technology’s Center for Environmental Sensing and Modeling interdisciplinary research program and grants NRF2016-535ITCOO1-021 and NRF2019-ITC001-001, and the ESPEC Prize for the Encouragement of Environmental Studies.
REFERENCES
- Anderson and Marsden (Forestry Consultants) Ltd. (1984) Brunei Forest Resources and Strategic Planning Study. Final Report. Anderson and Marsden (Forestry Consultants) Ltd., Brunei Darussalam.
- Anderson, J. A. R. (1963) The flora of the peat swamp forests of Sarawak and Brunei, including a catalogue of all recorded species of flowering plants, ferns and fern allies. Gard. Bull., Singapore 20, 131–228.
- Anderson, J. A. R., and Muller, J. (1975) Palynological study of a Holocene peat and a Miocene coal deposit from NW Borneo. Rev. Palaeobot. Palynol. 19, 291–351.
- Arora, N., Nater, A., van Schaik, C. P., Willems, E. P., van Noordwijk, M. A., Goossens, B., Morf, N., Bastian, M., Knott, C., Morrogh-Bernard, H., et al. (2010) Effects of Pleistocene glaciations and rivers on the population structure of Bornean orangutans (Pongo pygmaeus). Proc. Natl. Acad. Sci. USA 107, 21376–21381.
- Ashton, P. S. (1964) Manual of the Dipterocarp Trees of Brunei State. Oxford University Press, London, UK.
- Ashton, P. S. (1969) Speciation among tropical forest trees: some deductions in the light of recent evidence. Biol. J. Linn. Soc. Lond. 1, 155–196.
- Ashton, P. S. (1988) Dipterocarp biology as a window to the understanding of tropical forest structure. Annu. Rev. Ecol. Syst. 19, 347–370.
- Ashton, P. S. (2004) Dipterocarpaceae. In Tree Flora of Sabah and Sarawak, vol. 5. (eds.: Soepadmo, E., Saw, L. G., and Chung, R. C. K.), pp. 61–382. Sabah Forestry Department, Forest Research Institute of Malaysia and Sarawak Forestry Department, Kuala Lumpur, Malaysia.
- Bänfer, G., Moog, U., Fiala, B., Mohamed, M., Weising, K., and Blattner, F. R. (2006) A chloroplast genealogy of myrmecophytic Macaranga species (Euphorbiaceae) in Southeast Asia reveals hybridization, vicariance and long-distance dispersals. Mol. Ecol. 15, 4409–4424.
- Becek, K., Yong, G. Y. V., Sukri, R. S., and Lai, D. T. C. (2022) Shorea albida Sym. does not regenerate in the Badas peat swamp forest, Brunei Darussalam – an assessment using remote sensing technology. For. Ecol. Manage. 504, 15.
- Blacket, M. J., Robin, C., Good, R. T., Lee, S. F., and Miller, A. D. (2012) Universal primers for fluorescent labelling of PCR fragments – an efficient and cost-effective approach to genotyping by fluorescence. Mol. Ecol. Resour. 12, 456–463.
- Brownstein, M. J., Carpten, J. D., and Smith, J. R. (1996) Modulation of non-templated nucleotide addition by Taq DNA polymerase: primer modifications that facilitate genotyping. Biotechniques 20, 1004–1010.
- Caline, B., and Huong, J. (1992) New insight into the recent evolution of the Baram Delta from satellite imagery. Bull. Geol. Soc. Malaysia 32, 1–13.
- Cannon, C. H., Morley, R. J., and Bush, A. B. G. (2009) The current refugial rainforests of Sundaland are unrepresentative of their biogeographic past and highly vulnerable to disturbance. Proc. Natl. Acad. Sci. USA 106, 11188–11193.
- Chapuis, M.-P., and Estoup, A. (2007) Microsatellite null alleles and estimation of population differentiation. Mol. Biol. Evol. 24, 621–631.
- Cornuet, J.-M., Pudlo, P., Veyssier, J., Dehne-Garcia, A., Gautier, M., Leblois, R., Marin, J.-M., and Estoup, A. (2014) DIYABC v2.0: a software to make approximate Bayesian computation inferences about population history using single nucleotide polymorphism, DNA sequence and microsatellite data. Bioinformatics 30, 1187–1189.
- Dommain, R., Couwenberg, J., and Joosten, H. (2011) Development and carbon sequestration of tropical peat domes in south-east Asia: links to post-glacial sea-level changes and Holocene climate variability. Quat. Sci. Rev. 30, 999–1010.
- Earl, D. A., and vonHoldt, B. M. (2011) STRUCTURE HARVESTER: a website and program for visualizing STRUCTURE output and implementing the Evanno method. Conserv. Genet. Resour. 4, 359–361.
- Evanno, G., Regnaut, S., and Goudet, J. (2005) Detecting the number of clusters of individuals using the software STRUCTURE: a simulation study. Mol. Ecol. 14, 2611–2620.
- Frankham, R., Ballou, J. D., and Briscoe, D. A. (2012) Introduction to Conservation Genetics. University of Cambridge Press, Cambridge, UK.
- Furukawa, H. (1988) Stratigraphic and geomorphic studies of peat and giant podzols in Brunei, 2: giant podzols. Pedologist 32, 114–126.
- Gathorne-Hardy, F. J., Syaukani, Davies, R. G., Eggleton, P., and Jones, D. T. (2002) Quaternary rainforest refugia in south-east Asia: using termites (Isoptera) as indicators. Biol. J. Linn. Soc. Lond. 75, 453–466.
- Ghazoul, J. (2016) Dipterocarp Biology, Ecology, and Conservation. Oxford University Press, Oxford, UK.
- Goudet, J. (1995) FSTAT (vers.1.2): a computer program to calculate F-statistics. J. Hered. 86, 485–486.
- Hanebuth, T. J. J., Voris, H. K., Yokoyama, Y., Saito, Y., and Okuno, J. (2011) Formation and fate of sedimentary depocentres on Southeast Asia’s Sunda Shelf over the past sea-level cycle and biogeographic implications. Earth Sci. Rev. 104, 92–110.
- Henrot, J. (1995) Treasures of Brunei Darussalam. Brunei Shell Petroleum, Brunei, Malaysia.
- Hewitt, G. M. (2004) Genetic consequences of climatic oscillations in the Quaternary. Philos. Trans. R. Soc. Lond. B Biol. Sci. 359, 183–195.
- Hubisz, M. J., Falush, D., Stephens, M., and Pritchard, J. K. (2009) Inferring weak population structure with the assistance of sample group information. Mol. Ecol. Resour. 9, 1322–1332.
- Irwanto, D. (2019) Tracing the Cradle of Civilizations in Sundaland. Indonesia Hydro Media, Bogor, Indonesia.
- Kopelman, N. M., Mayzel, J., Jakobsson, M., Rosenberg, N. A., and Mayrose, I. (2015) CLUMPAK: a program for identifying clustering modes and packaging population structure inferences across K. Mol. Ecol. Resour. 15, 1179–1191.
- Lee, S. L., Ng, K. K. S., Saw, L. G., Lee, C. T., Muhammad, N., Tani, N., Tsumura, Y., and Koskela, J. (2006) Linking the gaps between conservation research and conservation management of rare dipterocarps: A case study of Shorea lumutensis. Biol. Conserv. 131, 72–92.
- Lee, S. L., Tani, N., Ng, K. K. S., and Tsumura, Y. (2004) Isolation and characterization of 20 microsatellite loci for an important tropical tree Shorea leprosula (Dipterocarpaceae) and their applicability to S. parvifolia. Mol. Ecol. Notes 4, 222–225.
- Masuda, S., Tani, N., Ueno, S., Lee, S. L., Muhammad, N., Kondo, T., Numata, S., and Tsumura, Y. (2013) Non-density dependent pollen dispersal of Shorea maxwelliana (Dipterocarpaceae) revealed by a Bayesian mating model based on paternity analysis in two synchronized flowering seasons. PLoS One 8, e82039.
- Miettinen, J., Shi, C., and Liew, S. C. (2016) Land cover distribution in the peatlands of Peninsular Malaysia, Sumatra and Borneo in 2015 with changes since 1990. Glob. Ecol. Conserv. 6, 67–78.
- Morley, R. J. (2000) Origin and Evolution of Tropical Rain Forests. John Wiley & Sons, Chichester, UK.
- Morley, R. J. (2013) Cenozoic ecological history of South East Asian peat mires based on the comparison of coals with present day and Late Quaternary peats. J. Limnol. 72, 36–59.
- Myers, N., Mittermeier, R. A., Mittermeier, C. G., da Fonseca, G. A., and Kent, J. (2000) Biodiversity hotspots for conservation priorities. Nature 403, 853–858.
- Nei, M. (1987) Molecular Evolutionary Genetics. Columbia University Press, New York, USA.
- Neilan, B. A., Wilton, A. N., and Jacobs, D. (1997) A universal procedure for primer labelling of amplicons. Nucleic Acids Res. 25, 2938–2939.
- Ng, C. H., Lee, C. T., Lee, S. L., Tnah, L. H., and Ng, K. K. S. (2013) Isolation and characterization of microsatellite markers for Shorea platyclados (Dipterocarpaceae). Appl. Plant Sci. 1, apps.1200538.
- Ng, C.-H., Lee, S.-L., Tnah, L.-H., Ng, K. K. S., Lee, C.-T., Diway, B., and Khoo, E. (2019) Genetic diversity and demographic history of an upper hill dipterocarp (Shorea platyclados): implications for conservation. J. Hered. 110, 844–856.
- Ng, K. K. S., Lee, S. L., Tsumura, Y., Ueno, S., Ng, C. H., and Lee, C. T. (2009) Expressed sequence tag-simple sequence repeats isolated from Shorea leprosula and their transferability to 36 species within the Dipterocarpaceae. Mol. Ecol. Resour. 9, 393–398.
- Ohtani, M., Kondo, T., Tani, N., Ueno, S., Lee, L. S., Ng, K. K. S., Muhammad, N., Finkeldey, R., Na’iem, M., Indrioko, S., et al. (2013) Nuclear and chloroplast DNA phylogeography reveals Pleistocene divergence and subsequent secondary contact of two genetic lineages of the tropical rainforest tree species Shorea leprosula (Dipterocarpaceae) in South-East Asia. Mol. Ecol. 22, 2264–2279.
- Ohtani, M., Tani, N., Ueno, S., Uchiyama, K., Kondo, T., Lee, S. L., Ng, K. K. S., Muhammad, N., Finkeldey, R., Gailing, O., et al. (2021) Genetic structure of an important widely distributed tropical forest tree, Shorea parvifolia, in Southeast Asia. Tree Genet. Genomes 17, 44.
- Ohtani, M., Ueno, S., Tani, N., Lee, L. S., and Tsumura, Y. (2012) Twenty-four additional microsatellite markers derived from expressed sequence tags of the endangered tropical tree Shorea leprosula (Dipterocarpaceae). Conserv. Genet. Resour. 4, 351–354.
- Page, S. E., Wűst, R. A. J., Weiss, D., Rieley, J. O., Shotyk, W., and Limin, S. H. (2004) A record of Late Pleistocene and Holocene carbon accumulation and climate change from an equatorial peat bog (Kalimantan, Indonesia): implications for past, present and future carbon dynamics. J. Quat. Sci. 19, 625–635.
- Paithankar, K. R., and Prasad, K. S. (1991) Precipitation of DNA by polyethylene glycol and ethanol. Nucleic Acids Res. 19, 1346.
- Pascual, M., Chapuis, M. P., Mestres, F., Balanya, J., Huey, R. B., Gilchrist, G. W., Serra, L., and Estoup, A. (2007) Introduction history of Drosophila subobscura in the New World: a microsatellite-based survey using ABC methods. Mol. Ecol. 16, 3069–3083.
- Peakall, R., and Smouse, P. E. (2006) GENALEX 6: genetic analysis in Excel. Population genetic software for teaching and research. Mol. Ecol. Notes 6, 288–295.
- Peakall, R., and Smouse, P. E. (2012) GenAlEx 6.5: genetic analysis in Excel. Population genetic software for teaching and research—an update. Bioinformatics 28, 2537–2539.
- Piry, S., Luikart, G., and Cornuet, J.-M. (1999) Computer note. BOTTLENECK: a computer program for detecting recent reductions in the effective size using allele frequency data. J. Hered. 90, 502–503.
- Pritchard, J. K., Stephens, M., and Donnelly, P. (2000) Inference of population structure using multilocus genotype data. Genetics 155, 945–959.
- Quek, S. P., Davies, S. J., Ashton, P. S., Itino, T., and Pierce, N. E. (2007) The geography of diversification in mutualistic ants: a gene’s-eye view into the Neogene history of Sundaland rain forests. Mol. Ecol. 16, 2045–2062.
- Randi, A., Julia, S., Ling, C. Y., Linsky, J., Oldfield, S., and Tsen, S. (2019) Shorea albida. The IUCN Red List of Threatened Species 2019: e.T33099A68072199. http://dx.doi.org/10.2305/IUCN.UK.2019-3.RLTS.T33099A68072199.en. Accessed on 21 July 2020.
- Rannala, B., and Mountain, J. L. (1997) Detecting immigration by using multilocus genotypes. Proc. Natl. Acad. Sci. USA 94, 9197–9201.
- Semerikov, V. L., Semerikova, S. A., Polezhaeva, M. A., Kosintsev, P. A., and Lascoux, M. (2013) Southern montane populations did not contribute to the recolonization of West Siberian Plain by Siberian larch (Larix sibirica): a range-wide analysis of cytoplasmic markers. Mol. Ecol. 22, 4958–4971.
- Smith, J. R., Bagchi, R., Ellens, J., Kettle, C. J., Burslem, D. F. R. P., Maycock, C. R., Khoo, E., and Ghazoul, J. (2015) Predicting dispersal of auto-gyrating fruit in tropical trees: a case study from the Dipterocarpaceae. Ecol. Evol. 5, 1794–1801.
- Sukri, R. S., and Kamariah, A. S. (2005) Population variation of Shorea albida Symington in the peat swamp forests of Brunei Darussalam. Conference on Forestry and Forest Products Research, 194–205.
- Szpiech, Z. A., Jakobsson, M., and Rosenberg, N. A. (2008) ADZE: a rarefaction approach for counting alleles private to combinations of populations. Bioinformatics 24, 2498–2504.
- Tani, N., Tsumura, Y., Fukasawa, K., Kado, T., Taguchi, Y., Lee, S. L., Lee, C. T., Muhammad, N., Niiyama, K., Otani, T., et al. (2012) Male fecundity and pollen dispersal in hill dipterocarps: significance of mass synchronized flowering and implications for conservation. J. Ecol. 100, 405–415.
- Tani, N., Tsumura, Y., Kado, T., Taguchi, Y., Lee, S. L., Muhammad, N., Ng, K. K. S., Numata, S., Nishimura, S., Konuma, A., et al. (2009) Paternity analysis-based inference of pollen dispersal patterns, male fecundity variation, and influence of flowering tree density and general flowering magnitude in two dipterocarp species. Ann. Bot. 104, 1421–1434.
- Taylor, D., Yen, O. H., Sanderson, P. G., and Dodson, J. (2001) Late Quaternary peat formation and vegetation dynamics in a lowland tropical swamp; Nee Soon, Singapore. Palaeogeogr. Palaeoclimatol. Palaeoecol. 171, 269–287.
- Thomas, M. F. (2000) Late Quaternary environmental changes and the alluvial record in humid tropical environments. Quat. Int. 72, 23–36.
- Tsumura, Y., Kawahara, T., Wickneswari, R., and Yoshimura, K. (1996) Molecular phylogeny of Dipterocarpaceae in Southeast Asia using RFLP of PCR-amplified chloroplast genes. Theor. Appl. Genet. 93, 22–29.
- Ujino, T., Kawahara, T., Tsumura, Y., Nagamitsu, T., Yoshimaru, H., and Ratnam, W. (1998) Development and polymorphism of simple sequence repeat DNA markers for Shorea curtisii and other Dipterocarpaceae species. Heredity (Edinb) 81, 422–428.
- Utomo, S., Uchiyama, K., Ueno, S., Matsumoto, A., Widiyatno, Indrioko, S., Na’iem, M., and Tsumura, Y. (2018) Effects of Pleistocene climate change on genetic structure and diversity of Shorea macrophylla in Kalimantan Rainforest. Tree Genet. Genomes 14, 44.
- Voris, H. K. (2000) Maps of Pleistocene sea levels in Southeast Asia: shorelines, river systems and time durations. J. Biogeogr. 27, 1153–1167.
- Weir, B. S., and Cockerham, C. C. (1984) Estimating F-statistics for the analysis of population structure. Evolution 38, 1358–1370.