Abstract
The effects of lower nitrogen (N, 4 me·L−1 NO3-N) concentration on growth, fruit yield, and yellow-shoulder (YS) disorder of tomatoes (Solanum lycopersicum L.) were investigated at EC 0.9 dS·m−1 (N, 6 me·L−1 NO3-N) combined with potassium (K) supplementation. Tomatoes ‘CF Momotaro York’ were grown in extremely low-volume substrate (ELVS) combined with low-node-order pinching and high-density planting (LN&HD). An experiment with five nutrient solution treatments of Enshi formula nutrient solution at EC 0.6 and EC 0.9 dS·m−1, EC 0.6+KNO3 (in which 1 me·L−1 KNO3 was added to EC 0.6 dS·m−1), EC 0.6/0.9 (nutrient solution ranging from EC 0.6 to EC 0.9 during fruit enlargement and ripening stages) and EC 0.9+P+K (P and K concentrations increased to 4.6 and 5.8 me·L−1 in EC 0.9) was conducted. Tomatoes were grown in 250 mL pots filled with granular rock wool combined with LN&HD from Feb. 10 to May 29, 2012. The fertigation system of high frequency and small volume was based on integrated solar radiation level. Total yield and YS index at EC 0.6+KNO3 almost reached those at EC 0.9, but they were still significantly lower than those at EC 0.9+P+K. YS index decreased significantly when K concentration increased by 1 me·L−1 (2 to 3 me·L−1). The results suggest the possibility of increasing the yield when a lower-N (5.3 me·L−1) nutrient solution is applied in the ELVS culture system, if P and K concentrations are further modified to enhance the uptake. Shoot fresh weight at EC 0.6/0.9 was significantly lower than at EC 0.9, but there was no significant difference in total yield between EC 0.9 and EC 0.6/0.9. Total yield increased with increasing NO3-N uptake per plant (R2 = 0.98, P < 0.01) and YS incidence of fruit decreased with increasing K uptake per plant (R2 = 0.92, P < 0.05) during the entire growing period.
Introduction
Since 2007, a so-called D-tray cultivation system with extremely low-volume substrate (ELVS) combined with low-node-order pinching and high-density planting has been developed for tomato production (Endo et al., 2007; Kiriiwa, 2008). The area into which it had been introduced among commercial growers was about 3.5 ha by the end of 2013 (Tamai, 2014). The characteristics of the D-tray cultivation system are described in our previous paper (Zhang et al., 2015).
Zhang et al. (2015) reported on the effects of the concentration or composition of nutrient solution on tomato plant growth and fruit yield as well as yellow-shoulder (YS) disorder of fruit. In terms of the results, fruit yield was significantly improved by increasing the P or K concentration when the total nitrogen (N) concentration was constant, and the effectiveness of K on YS disorder was greater than that of P. It is well recognized that N contributes more to the vegetative components such as leaves and stems of the plant than the reproductive components (fruit) (Papadopoulos, 1991). Although tomato plants grown in ELVS seemed to need relatively low vegetative growth to accommodate their narrow planting density of 3.6 to 5.4 plants·m−2, fertigation of low-concentration nutrient solution has not been well optimized for tomatoes grown in ELVS. In this study, the possibility of applying nutrient solution with N concentration lower than 6.5 me·L−1 was examined, in order to obtain comparable yield and reduce the extent of YS disorder compared with those of EC 0.9+P+K nutrient solution (6.5 me·L−1 N) reported in our previous paper (Zhang et al., 2015).
Owing to a full fruit load during the reproductive growth stage, mineral elemental uptake was higher during the fruit enlargement and ripening stages than in the flowering stage in the ELVS cultivation system, as well as in other systems (Ishihara et al., 2007; Terabayashi et al., 2004a, b). Hohjo (2001) showed that tomato yield and fruit quality were improved by increasing the nutrient solution concentration from fruit enlargement to the end of the experiment. Zhang et al. (2015) showed that fruit yield at 4.3 me·L−1 N and 2.0 me·L−1 K of Enshi formula at EC 0.6 dS·m−1 was significantly reduced at the 2nd and 3rd trusses, and there was also higher (12%) unmarketable YS incidence compared with that at EC 0.9+P+K. Consequently, in the present study, it is hypothesized that an increase in the concentration of nutrient solution during the fruit enlargement and ripening stages can satisfy the increasing demand for mineral elements in the case of a full fruit load. Therefore, the effects of changing the nutrient solution from EC 0.6 dS·m−1 at the flowering stage to EC 0.9 dS·m−1 at the fruit enlargement stage on fruit yield and YS disorder were also examined.
Materials and Methods
Treatments
There were five treatments consisting of EC 0.6, EC 0.9, EC 0.6+KNO3, EC 0.6/0.9, and EC 0.9+P+K, as shown in Table 1. EC 0.6 and EC 0.9 treatments involved Enshi formula nutrient solution at EC 0.6 dS·m−1 and EC 0.9 dS·m−1, respectively. The calcium (Ca) concentration at EC 0.6 was adjusted to 3.0 me·L−1 to avoid blossom-end rotted (BER) fruit by adding 1 me·L−1 Ca, so the EC became 0.85 dS·m−1 combined with 0.15 dS·m−1 water at EC 0.6 treatment. At EC 0.6+KNO3, 1 me·L−1 KNO3 was added to EC 0.6 for extra K and N supplementation, which resulted in 5 me·L−1 NO3-N and 3 me·L−1 K. At EC 0.6/0.9, plants were fertigated with EC 0.6 dS·m−1 during the flowering stage (1 to 4 as shown in Table 1) and EC 0.9 dS·m−1 during the fruit enlargement and ripening stages (5 to 12 as shown in Table 1). At EC 0.9+P+K treatment, K and PO4-P concentrations were increased up to 5.8 and 4.6 me·L−1, respectively, as proposed in our previous paper (Zhang et al., 2015). Fifteen reservoir tanks were arranged in 3 lines, 5 reservoirs per line, and 10 plants per reservoir. Three replications of each treatment were distributed in every line. Thus, 150 plants were used in the experiment.

Tomato seedlings ‘CF Momotaro York’ with 5 fully expanded true leaves were planted into a D-tray filled with granular rock wool with a 24 cm planting distance on Feb. 10, 2012. As a result, the plant density was about 4 plants·m−2. Treatments were initiated on March 6 at the flowering stage of the first truss. Nutrient solution distributed through the drip fertigation system to each plant was recirculated with a pump at a flow rate of approximately 25 mL·min−1. The fertigation frequency was controlled by a solar radiation controller for 4 minutes for every 1.0 MJ·m−2 of solar radiation accumulated. The experiment was conducted in a heated plastic greenhouse in which the internal minimum (heating) and ventilation air temperatures were 15°C and 23°C, respectively, and the average measured temperatures were 15.5°C at night and 22.2°C in the daytime throughout the entire growing period. The other culture conditions and management of the growing system were the same as in a previous paper (Zhang et al., 2015).
Measurement and statistical analysis
Total fruit yield, marketable fruit yield, fruit number and fruit weight were assessed during the ripening stage for each truss. The split and BER fruit were excluded from marketable yield. At the end of the experiment, stem diameter and length, and shoot (leaf and stem) fresh weight were measured. Leaves were dried in a forced air oven at 80°C to constant weight. The dry leaf sample was dry-ashed in a furnace at 550°C for mineral element content analysis. The analysis was following the methods described in the previous report (Zhang et al., 2015).
YS disorder was recorded at every harvest time. Its level of severity was classified into 5 grades as follows: Extremely severe = 4, Severe = 3, Medium = 2, Light = 1, and None = 0, corresponding to yellow areas as proportions of the total fruit shoulder area of 70–100%, 50–70%, 30–50%, 0–30%, and 0% respectively. The number of disordered fruit and extent of the disorder are expressed by YS incidence and YS index of fruit, respectively. They were calculated as described by Zhang et al. (2015).
The concentration of mineral elements in each reservoir was determined weekly, following the methods described previously (Zhang et al., 2015). The weekly plant nutrient uptake was estimated using the difference between the sum of the nutrient amount including original and weekly refilled nutrient solution, and the residual amount after one week, as described previously (Zhang et al., 2015). The total uptake of each element per plant was calculated using the sum of the weekly uptake during 12 weeks (Table 1) from transplanting to the end of harvesting. Fertilization (NO3-N) efficiency (kg·e−1) was calculated in marketable yield (kg/plant) divided by uptake of NO3-N (e/plant) in each replication.
Data were analyzed by one-way ANOVA, and significant differences of the mean values were evaluated using Scheffe’s multiple range test. Linear regression was used to evaluate the relationship between uptake of mineral elements and fruit yield, and YS incidence of fruit.
Results
Plant growth, fruit yield and quality, and nutrient content in leaves
The stem diameters at EC 0.6+KNO3 and EC 0.6/0.9 were significantly larger than at EC 0.6, and smaller than at EC 0.9+P+K (Table 2). Stem length at EC 0.6+KNO3 reached the same level as at EC 0.9 and EC 0.9+P+K, while that at EC 0.6/0.9 was significantly shorter than those at EC 0.9 and EC 0.9+P+K. Shoot fresh weight at EC 0.6/0.9 was significantly lower than those at EC 0.9 and EC 0.6+KNO3, while there was no significant difference in total yield among EC 0.6+KNO3, EC 0.6/0.9, and EC 0.9, which were still significantly lower than at EC 0.9+P+K. Yield reduction was caused by a significant reduction in the 3rd truss. Upon comparison with EC 0.6, although YS index decreased significantly at EC 0.6+KNO3 and EC 0.6/0.9, the former reached the same significant degree as at EC 0.9, but the latter was still higher than at EC 0.9. The split fruit constituted 7, 8, 7, 13, and 8% of the total at EC 0.6, EC 0.6+KNO3, EC 0.9, EC 0.6/0.9, and EC 0.9+P+K, respectively (data not shown). The BER fruit incidence was not observed in all treatments at harvesting time, although the incidence before fruit thinning was 9, 3, 7, 3, and 2% at EC 0.6, EC 0.6+KNO3, EC 0.9, EC 0.6/0.9, and EC 0.9+P+K, respectively (data not shown).

At EC 0.6+KNO3, N content and K content of leaves were significantly higher than at EC 0.6, while PO4-P, Mg, and Ca contents were not affected by KNO3 supplementation. At EC 0.6/0.9, N, PO4-P, K, Ca, and Mg contents of leaves were all the same as those at EC 0.9 (Table 3).
Relationship between total yield and uptake of NO3-N, and between YS incidence and uptake of K and PO4-P
The levels of uptake of mineral elements and their patterns were closely related to their concentrations, although their extents differed at each element. They increased largely with truss flowering and the expansion of upper leaves, and decreased after pinching (data not shown). Uptake of PO4-P, Ca, and Mg was not influenced by supplementation of KNO3 into EC 0.6. The levels of uptake of K were 9, 13, 13, 13, and 22 me/plant at EC 0.6, EC 0.6+KNO3, EC 0.9, EC 0.6/0.9, and EC 0.9+P+K, respectively, during the fruit enlargement and ripening stages. The levels of NO3-N, PO4-P, and K uptake at EC 0.6/0.9 increased up to almost those at EC 0.9 with increasing concentration (data not shown).
The levels of uptake of NO3-N were 193, 260, 285, 366, and 332 me/plant at EC 0.6, EC 0.6+KNO3, EC 0.9, EC 0.6/0.9, and EC 0.9+P+K, respectively. The corresponding levels of uptake of K were 99, 143, 151, 137, and 237 me/plant, and those of PO4-P were 55, 44, 59, 39, and 168 me/plant (Figs. 1, 2, and 3).

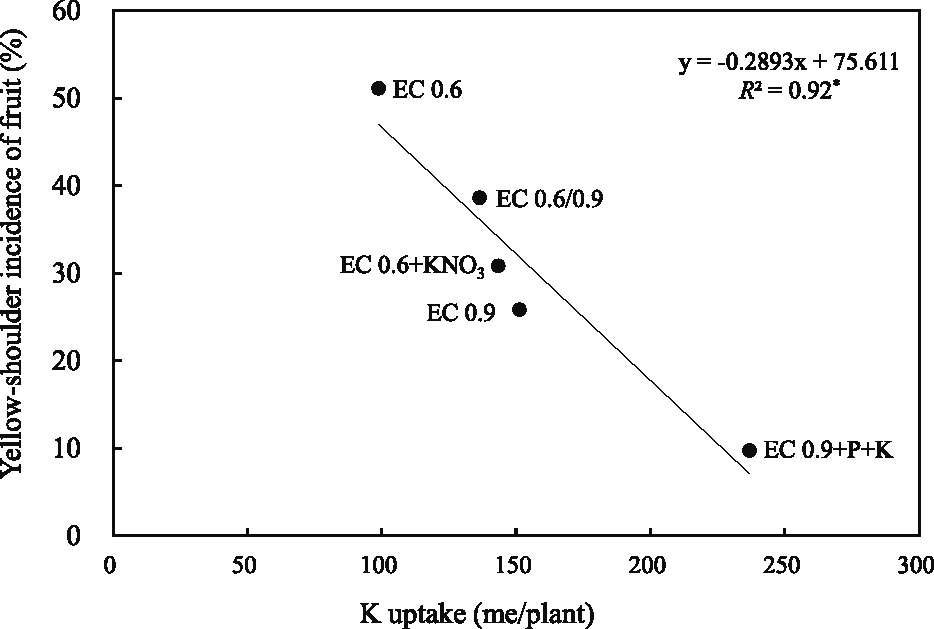
The total fruit yield was plotted against the uptake of each mineral element. There was a significant linear correlation between total yield and uptake of NO3-N (R2 = 0.98, P < 0.01) (Fig. 1), followed by K (R2 = 0.87, P < 0.05), PO4-P (R2 = 0.53), and Ca (R2 = 0.50) (data not shown). On the other hand, YS incidence was significantly correlated with uptake of K (R2 = 0.87, P < 0.05) (Fig. 2), but not with uptake of PO4-P (Fig. 3). The fertilization (NO3-N) efficiency levels were 8.6, 7.6, 7.1, 6.7, and 6.4 kg·e−1 at EC 0.6, EC 0.6+KNO3, EC 0.9, EC 0.6/0.9, and EC 0.9+P+K, respectively, among which that of EC 0.6 was significantly higher than the others, and there was no significant difference between EC 0.6+KNO3 and EC 0.9+P+K (P < 0.05, n = 3) (data not shown).
Discussion
Tomato plants grown in ELVS require relatively low vegetative growth to accommodate their narrow planting density. It is well known that N contributes more to the vegetative components such as leaves and stems of the plant than to the reproductive components (fruit) (Papadopoulos, 1991). Zhang et al. (2015) reported that a N concentration of 6.5 me·L−1 at EC 0.9 dS·m−1 was sufficient to satisfy tomato plant vegetative growth because the fertilization (NO3-N) efficiency per marketable fruit was higher at EC 0.9 (6.1 kg·e−1) than at EC 1.2 (4.9 kg·e−1). Furthermore, we still needed to determine the possibility of fertigation at a lower N concentration of nutrient solution, such as lower than 6.5 me·L−1, to accommodate the high-density planting adequately for tomatoes grown in ELVS.
In the present study, fertilization (NO3-N) efficiency at 5.3 me·L−1 N concentration in EC 0.6+KNO3 was maintained at the same degree as at 6.5 me·L−1 N concentration in EC 0.9+P+K without increasing the shoot fresh weight. Total yield at EC 0.6+KNO3 increased significantly to the same extent as at EC 0.9 and higher than at EC 0.6, but there was still a big difference between EC 0.6+KNO3 and EC 0.9+P+K (Table 2). Total yield showed a significant positive relationship with uptake of NO3-N (R2 = 0.98, P < 0.01) in the case of the present range of NO3-N uptake from 193 to 332 me/plant (Fig. 1). NO3-N uptake per plant was higher at EC 0.9+P+K (332 me/plant) than at EC 0.9 (285 me/plant), although the NO3-N application concentrations were identical, and N content in leaves was found to be greatest at EC 0.9+P+K correspondingly (Table 3). This was caused by P and K supplementation at EC 0.9+P+K enhancing the uptake of NO3-N. On the other hand, Zhang et al. (2015) reported that the improvement of fruit yield was more likely to depend on P supplementation than K. Therefore, much higher fruit yield comparable to the level at EC 0.9+P+K may be realized by regulating P concentration at a constant level of 5.3 me·L−1 N (NO3-N = 5, NH4-N = 0.3 me·L−1). Subsequently, research about P concentration ranging from 1.0 me·L−1 at EC 0.6+KNO3 to 4.6 me·L−1 at EC 0.9+P+K should be clarified in future research.
In the literature, it is indicated that YS disorder was reduced by K fertilization in soil (Helyes et al., 2009; Taber et al., 2008) or K supplementation in soilless culture (Zhang et al., 2015). In the present research, when K concentration was increased from 2 me·L−1 (EC 0.6) to 3 me·L−1 (EC 0.6+KNO3), average uptake of K increased correspondingly (data not shown). K content of leaves was 4.51% at EC 0.6+KNO3 (Table 3), which was significantly higher than that at EC 0.6. As a result, YS index decreased largely at EC 0.6+KNO3 compared with that at EC 0.6, but it was still unable to achieve as low a YS index level as at EC 0.9+P+K. Additionally, YS incidence was significantly dependent on uptake of K (R2 = 0.92, P < 0.05) (Fig. 2), which suggested that K concentration could be increased further within the range from 3 me·L−1 at EC 0.6+KNO3 to 5.8 me·L−1 at EC 0.9+P+K, or even higher than 5.8 me·L−1. In this study, uptake of PO4-P did not correlate closely with YS incidence (Fig. 3). Previous evidence (Zhang et al., 2015) also showed that the effectiveness of K on YS disorder was higher than that of P.
Zhang et al. (2015) showed that fruit yield in the 2nd and 3rd trusses decreased significantly at EC 0.6 dS·m−1 compared with that at EC 0.9 or EC 1.2 because plants needed more mineral elements during the fruit enlargement and ripening stages (Ishihara et al., 2007; Terabayashi et al., 2004b). A constantly low concentration during the entire culture period such as at EC 0.6 could not satisfy the rapidly increased requirement for nutrients for the growth of the full fruit load (Zhang et al., 2015). In the present study, the reason why the total yield at EC 0.6/0.9 was significantly improved was probably that the extent of mineral nutrient elemental uptake was the same during fruit enlargement and ripening (data not shown). Because the K content of leaves at EC 0.6/0.9 was significantly higher than at EC 0.6 (Table 3), YS index was also decreased greatly at EC 0.6/0.9, but it could not reach that at EC 0.9. It can be assumed that higher yield and less YS disorder would be realized by increasing the nutrient solution concentration from EC 0.6 to EC 1.2 or EC 0.9+P+K during the reproductive stage (5 to 12 as shown in Table 1). Additionally, stem length, stem diameter, and shoot fresh weight at EC 0.6/0.9 were significantly lower than those at EC 0.9 (Table 2). For the mineral elemental uptake, NO3-N uptake at EC 0.6/0.9 remained at a higher level than at EC 0.9 during the reproductive stage (data not shown), although the fertigation concentrations were identical (Table 1). This might have resulted from mineral elemental starvation during the flowering stage and the plantʼs ability to recover to a normal growth pattern (Pujos and Morard, 1997). The present study indicated that intensive NO3-N uptake during the fruit enlargement stage promoted total fruit yield at EC 0.6/0.9.
The results showed that fruit yield was improved and the extent of YS disorder was reduced by increasing the concentration of nutrient solution during the fruit enlargement and ripening stages. Total yield and YS index at EC 0.6+KNO3 and EC 0.6/0.9 almost reached the levels at EC 0.9, but were still significantly lower than those at EC 0.9+P+K. It was not shown that lower-N-concentration nutrient solution combined with K supplementation (EC 0.6+KNO3) achieved a yield comparable to that at EC 0.9+P+K treatment in the ELVS culture system. However, it is suggested that the yield may be increased when lower-N (5.3 me·L−1) nutrient solution is applied, if P and K concentrations are further modified to enhance the uptake.
Literature Cited
- Endo, M., C. Kuwabara, Y. Kiriiwa and A. Nukaya. 2007. Cultivation of tomatoes with extremely small volume of substrates in connected pot trays. Hort. Res. (Japan) 6 (Suppl. 2): 280 (In Japanese).
- Helyes, L., J. Dimeny, A. Bocs, G. Bocs, G. Schober and Z. Pek. 2009. The effect of water and potassium supplement on yield and lycopene content of processing tomato. Acta Hort. 823: 103–108.
- Hohjo, M. 2001. The growing technique for production of high quality tomatoes by controlling nutrient solution in NFT system. Tech. Bull. Fac. Hort. Chiba Univ. 55: 123–153 (In Japanese with English abstract).
- Ishihara, Y., H. Hitomi and Y. Yamaki. 2007. Effect of composition of an improved nutrient solution for a closed hydroponic system on nutrient absorption by tomatoes. J. Japan. Soc. Hort. Sci. 6: 391–397 (In Japanese with English abstract).
- Kiriiwa, Y. 2008. Consolidated pot tray for tomato low growing stage and dense planting cultivation. Shisetsu-to-Engei 141: 10–16 (In Japanese).
- Papadopoulos, A. P. 1991. Nutrition requirements. p. 15–24. In: A. P. Papadopoulos (ed.). Growing greenhouse tomatoes in soil and soilless media. Communications Branch, Agriculture Canada, Ottawa.
- Pujos, A. and P. Morard. 1997. Effect of potassium deficiency on tomato growth and mineral nutrition at the early production stage. Plant Soil 189: 189–196.
- Taber, H., P. Perkins-Veazie, S. Lil, W. White, S. Rodermel and Y. Xu. 2008. Enhancement of tomato fruit lycopene by potassium is cultivar dependent. HortScience 43: 159–165.
- Tamai, D. 2014. The practical cultivation and technologist training in tomato low nod order pinching and high density planting cultivation. Shisetsu-to-Engei 165: 62–65 (In Japanese).
- Terabayashi, S., T. Asaka, A. Tomaturi, S. Date and Y. Fujime. 2004a. Effect of the limited supply of nitrate and phosphate on nutrient uptake and fruit production of tomato in hydroponic culture. Hort. Res. (Japan) 3: 195–200 (In Japanese with English abstract).
- Terabayashi, S., I. Muramatsu, S. Tokutani, M. Ando, E. Kitagawa, T. Shigemori, S. Date and Y. Fujime. 2004b. Relationship between the weekly nutrient uptake rate during fruiting stages and fruit weight of tomato grown hydroponically. J. Japan. Soc. Hort. Sci. 73: 324–329.
- Zhang, Y., Y. Kiriiwa and A. Nukaya. 2015. Influence of nutrient concentration and composition on the growth, uptake patterns of nutrient elements and fruit coloring disorder for tomatoes grown in extremely low-volume substrate. Hort. J. 84: 37–45.

