ORIGINAL ARTICLES
Genetic Research on Fruit Color Traits of the Bitter Gourd (Momordica charantia L.)
2017 Volume 86 Issue 2 Pages 238-243

Details
2017 Volume 86 Issue 2 Pages 238-243
The objective of this study was to determine the genetic model of fruit color in the bitter gourd (Momordica charantia L.). Six generations (P1, P2, F1, F2, BCP1, and BCP2) in the hybrid set “MS 41 × MS 47” were used to estimate the genetic effects via generation mean analysis (GMA). The fruit color of the F1 population was green implying the green color was dominant over the white color. The fruit color of the F2 population showed a continuous distribution from white to dark green indicating this trait was controlled by quantitative genes. Genetic analyses using the Royal Horticultural Society scoring system (RHS score) fitted the three parameters model (χ23 = 1.59, P = 0.6607) and showed significant to highly significant additive and dominance effects, respectively. The GMA results of the six parameters model revealed a significant additive effect on chlorophyll b concentration. Chlorophyll a and total chlorophyll concentrations were nonsignificant in all parameters. The magnitudes of additive and additive × additive gene effects were larger than those of the dominance and dominance × dominance gene effects, which revealed that additive genes were more important in the contribution to chlorophyll concentrations. Broad-sense heritability estimates for color traits were 0.39, 0.611, 0.470, and 0.460 for concentrations of chlorophyll a, chlorophyll b, total chlorophyll, and RHS score, respectively. In contrast to previous findings, with the GMA analysis we believe that the genetic model of fruit color in bitter gourd is clearly a quantitative model.
The bitter gourd (Momordica charantia L.) an important cucurbitaceous crop in eastern and southern Asia. It is often consumed as a vegetable in the daily diet in these areas (Rubatzky and Yamaguchi, 1997). Although its origin is uncertain, areas of eastern India and southern China are thought to be possible native regions (Raj et al., 1993). The major editable portion of the bitter gourd is the immature fruit. Immature bitter gourd fruits are green or white. There is a broad spectrum for color of the green fruit—from light green to very dark green. Actually, there are many pigments in bitter gourd fruits e.g. chlorophylls, carotenoids, flavonoids, and so on (Behera et al., 2013; Gross, 1991; Rodriguez et al., 1976). The interaction of the pigments is responsible for the color changes at different developmental stages of the fruit. The major pigments of the immature fruit are chlorophylls (chlorophyll a and chlorophyll b) which affect the external color of bitter gourd fruits, ranging from white to very dark green. The color becomes orange when fruits are mature as chlorophyll concentrations reduce and carotenoids, flavonoids concentrations accumulate (Gross, 1991).
The inheritance of the fruit or mesocarp colors varied within different cucurbits. Paris (2000) reported the fruit color of squash was affected by two genes, one dominant, one recessive, and that their interactions governed the color at each stage of fruit growth. The flesh color of watermelon was controlled by two genes (Shimotsuma, 1963), but Gusmini and Wehner (2006) mentioned the genetic model of flesh color in the watermelon was affected by one gene or multiple genes that depended on the combinations of parents with different flesh colors. Cuevas et al. (2010a) found the inheritance of beta-carotene content in the cucumber mesocarp was controlled by two recessive genes which affected the phenotype of flesh color, but inheritance of beta-carotene content in the endocarp was dominated by one recessive gene. The color appearances of the mesocarp and endocarp were independent. As for inheritance of mesocarp color in melon (Cucumis pepo L.), Cuevas et al. (2010b) evaluated the mesocarp color of segregating generations that fitted a two-gene recessive epistatic model.
Only a few studies about the inheritance of fruit color in the bitter gourd have been reported and three of them (Dalamu et al., 2012; Hu et al., 2002; Srivastava and Nath, 1972) concluded that the green color was monogenically dominant over the white color. Srivastava and Nath (1972) analyzed two F2 populations from two hybrid combinations with green fruit and white fruit parents that found immature fruit color of the bitter gourd was controlled by one nucleus gene with no cytoplasmic factor involved. Hu et al. (2002) and Dalamu et al. (2012) reached similar conclusions about the expressions of fruit color in bitter gourds. However, Hu et al. (2002) also found the color of some fruits from F1 and backcross populations was lighter than that of the parents. They speculated the light green colors were probably affected by incomplete dominance or modifiers. Hence, the fruits of an F2 population derived from pure line parents showed a green color gradient.
In order to further clarify the genetic puzzle of the fruit color in the bitter gourd, the present study initiated a series of crosses, from the parents, F1, F2, to BCP1 and BCP2, and estimated the concentrations of chlorophylls and color appearance in the fruits analyzed by using generation mean analyses and broad-sense heritability estimation techniques to clarify the possible genetical mechanism for the coloring of bitter gourd fruits.
A white fruit bitter gourd line MS 41 (maternal parent, P1) was crossed with a green fruit line MS 47 (paternal parent, P2). Both parents were inbred lines that had been selfed for six generations. The F1 plants were self-pollinated to produce the F2 population. Then, the F1 plants were used as paternal parents which were backcrossed with P1 and P2 plants to generate BCP1 and BCP2 generations, respectively. Seeds from each generation, from parents, F1, F2, BCP1, and BCP2 were germinated and raised in a net-house at Chinan Branch, Kaohsiung District Agricultural Research and Extension Station in the summer of 2013.
Experimental designThe experiment was a random complete block design (RCBD) with four replications. There were 153 plants for P1, 139 plants for P2, 139 plants for F1, 216 plants for F2, 200 plants for BCP1, and 201 plants for BCP2 in the study. The planting density was 1.2 m × 0.5 m. Standard fertilization programs and pest control practices as recommended by the government for commercial bitter gourd production in Taiwan were followed.
Fruit color classification and chlorophyll concentration analysisThe fruits from the second and third fruit-set were harvested from each plant at 14 days after pollination to investigate the external color and chlorophyll concentrations. Fruits were collected from June 11 to July 12, 2013. The fruits were classified into 10 color groups from white (as 1) to the darkest green (as 10) using Royal Horticultural Society (RHS) color charts (5th Edition, 2007). The corresponding codes for RHS color charts are as follows: 1 = RHS-155B, 2 = RHS-157A, 3 = RHS-150D, 4 = RHS-145C, 5 = RHS-145B, 6 = RHS-139D, 7 = RHS-144B, 8 = RHS-143A, 9 = RHS-137C, and 10 = RHS-137A.
Chlorophyll concentrations were determined according to the method of Arnon (1949). Two pulp samples for chlorophyll determination were collected from the middle of each fruit at opposite positions. The inner sponge-like pulp tissues were removed and all other portions were used for analysis. 0.5 g pulp was ground with 5 mL 100% acetone with a cold mortar and pestle. Then, the extract was centrifuged at 3024 × g for 5 min to clarify it. 0.05 mL of the upper solution of centrifuged extract was added to 0.95 mL of 80% aqueous acetone. Absorption was measured at 663 nm and 645 nm using an ultraviolet-visible spectrophotometer (UV-1601; Shimadzu Corporation, Japan). The chlorophyll concentration was calculated as follows:
Total chlorophyll = Chlorophyll a + b,
V = volume of chlorophyll extract (0.05 mL)
Estimation of genetic parameters and generation mean analysis (GMA)The means of populations for the six generations (P1, P2, F1, F2, BCP1, and BCP2) were used to evaluate the types of gene action. The calculations of three parameters, i.e., mean of F2 population (m), additive effects (a), and dominance effects (d) were described by Hayman (1958). Fitness of the three parameters model was determined by the Chi-square (χ2) test with 3 degrees of freedom.
When the χ2 value was nonsignificant (P > 0.05), it indicated the trait fitted for the three parameters model. If the χ2 value of the three parameters model was significant, then the six parameters model was computed. Six parameters of genetic effects were estimated for additive (a), dominance (d), additive × additive (aa), additive × dominance (ad), dominance × dominance (dd), and mean of F2 population (m), and were tested for significance using an unpaired t-test. The expected genetic variance of the six populations was estimated by the procedure of Hayman (1958). Broad-sense heritability (h2B) was evaluated by the data of four fruit color-related traits gained from GMA, which was calculated by the method of Mahmud and Kramer (1951).
The fruit colors of six generations are shown in Figure 1. The means of chlorophyll a, chlorophyll b, total chlorophyll, and RHS scores for the six generations of the bitter gourd hybrid set are presented in Table 1. Concentrations of chlorophyll (a, b, and total) and RHS scores were significantly different between the two parents. The values of all fruit color-related traits derived from the cross-progenies (F1, F2, BCP1, and BCP2) were scattered and distributed between the two parents.

Fruit colors of parents (P1 (A) and P2 (B)), F1 (C), F2 (D), and backcross progenies of BCP1 (E) and BCP2 (F) in the hybrid set “MS 41 × MS 47”.

Means of chlorophyll concentrations and RHS scores of the six generations in the bitter gourd hybrid set “MS 41 × MS 47”.
The concentrations of chlorophyll a, chlorophyll b, and total chlorophyll of the F1 population were significantly higher than those of the white-colored parent (P1) and lower than that of the green-colored parent (P2). The average RHS score of F1 population reached 6.8, which was very close to the mean of the green parent, P2, revealing that green fruit color was dominant over white color. The fruit colors of F2 population were scattered from white (RHS score = 1) to dark green (RHS score = 10) with continuous changes (Table 2) that implied the fruit color of bitter gourd was a quantitative trait that corresponded to actual fruit colors (Fig. 1D).

The frequency distribution of RHS scores for the six generations in the bitter gourd hybrid set “MS 41 × MS 47”.
The analysis of genetic effect estimates of the three parameters model in four fruit color-related traits are presented in Table 3. The χ2 values indicated significant effects for chlorophyll a (χ23 = 10.06, P = 0.0181), chlorophyll b (χ23 = 10.27, P = 0.0164), and total chlorophyll (χ23 = 10.14, P = 0.0174) that revealed that epistasis was present and estimations of the six parameters model were necessary. The Chi-square value of the RHS score showed a nonsignificant effect (χ23 = 1.59, P = 0.6607) which indicated the heritance of the RHS score fitted the three parameters model. The parameter of a (additive) and d (dominance) showed significant and highly significant effects, respectively.
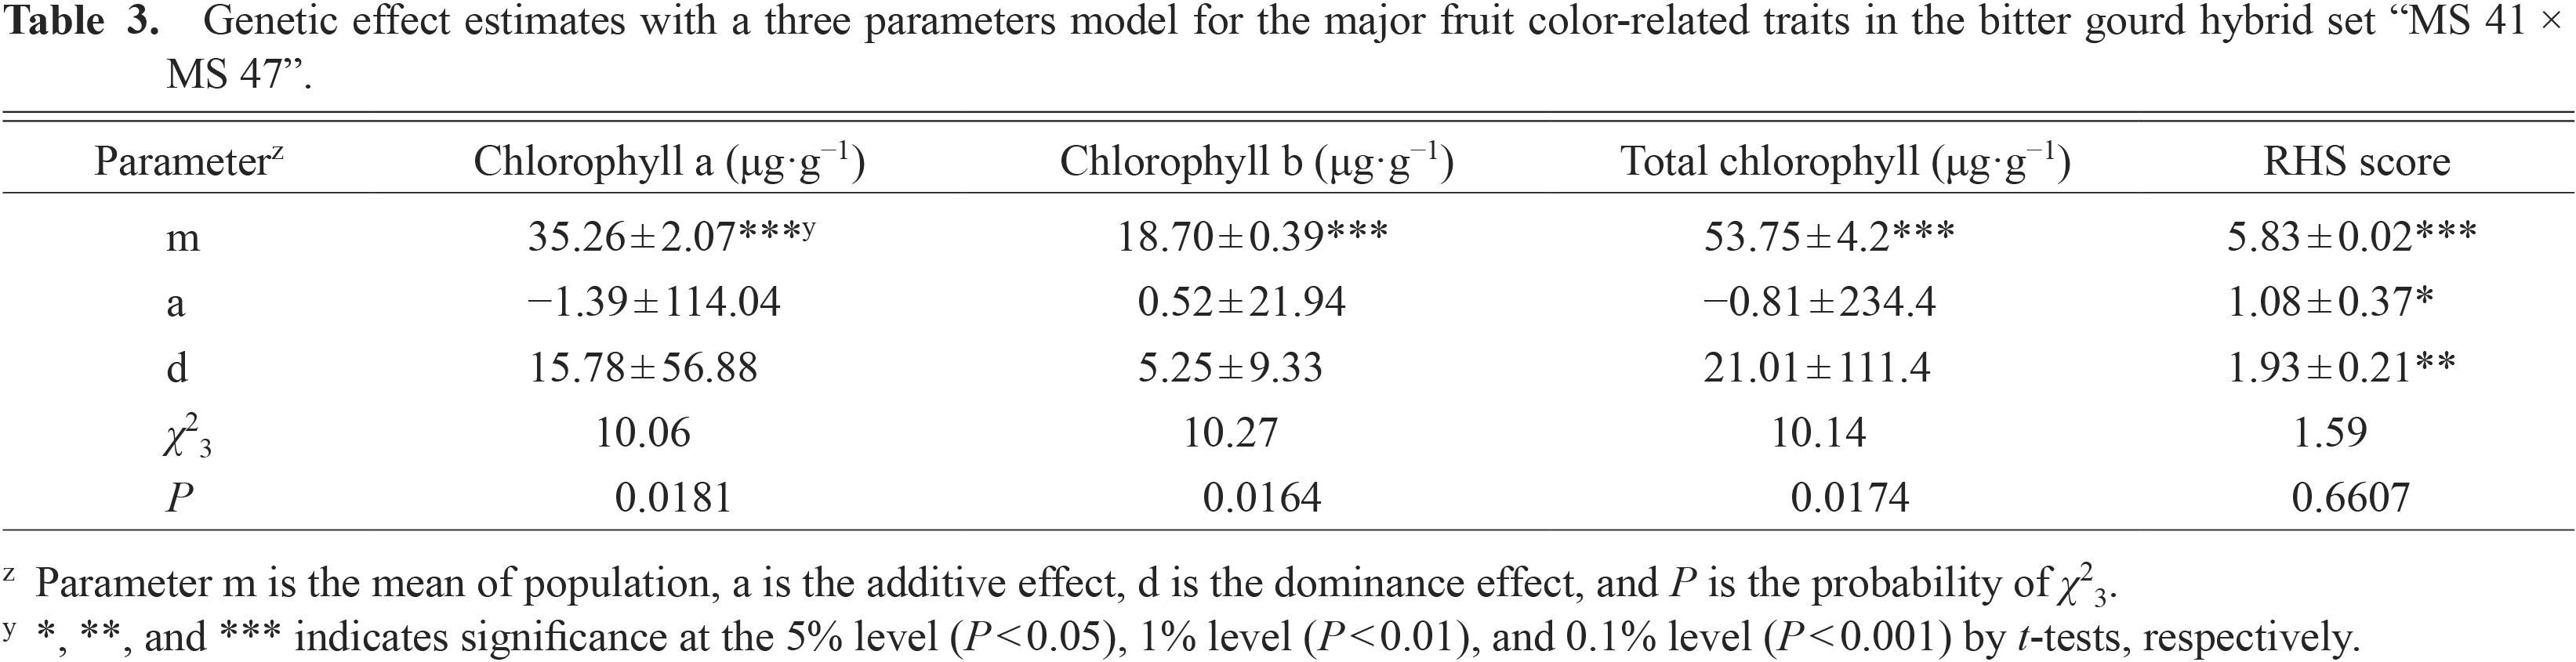
Genetic effect estimates with a three parameters model for the major fruit color-related traits in the bitter gourd hybrid set “MS 41 × MS 47”.
Results of six parameters analysis (Table 4) showed that nonsignificant effects for parameters of a (additive), d (dominance), aa (additive × additive), ad (additive × dominance), and dd (dominance × dominance) in chlorophyll a and total chlorophyll concentrations. However, the chlorophyll b concentration showed a significant effect on additive effect (P < 0.05, by t-test) which revealed inheritance of chlorophyll b concentration was controlled mainly by additive factors.

Genetic effect estimates with a six parameters model for the major fruit color-related traits in the bitter gourd hybrid set “MS 41 × MS 47”.
The variances of genetic components and heritability are presented in Table 5. The broad-sense heritability (h2B) for chlorophyll a, chlorophyll b, total chlorophyll concentrations, and RHS score were 0.394, 0.611, 0.470, and 0.460, respectively, with chlorophyll b being the highest.

Variance (σ2) estimates with a six parameters model for major fruit color-related traits and broad-sense heritability in the bitter gourd hybrid set “MS 41 × MS 47”.
Bitter gourd fruits contain a variety of pigments such as chlorophylls, carotenoids, and flavonoids (Behera et al., 2013; Gross, 1991). The major pigments of immature fruit are chlorophylls, whose concentrations affect the coloring of green bitter gourds.
Hu et al. (2002) and Srivastava and Nath (1972) reported that the green color in bitter gourd fruits was dominant over the white color and was affected by only one gene. The present study also showed green color was dominant, but did not support the one gene theory (Table 2). The results of chlorophyll concentrations and RHS scores of P1, P2, and F1 populations indicated the green fruit color of bitter gourds was dominant over the white color (Table 1) but these four traits were not only affected by dominance since the color of F1 progenies was intermediate between the two parents (Shalaby, 2013). The green fruits of the F2 population showed various green color levels, and analysis of the segregation pattern of the F2 population indicated RHS scores (Table 2) did not fit the model of single, two, or three genes, but was a quantitative one. The image of the F2 population (Fig. 1D) provided further clear evidence. Srivastava and Nath (1972) examined two F2 populations from two cross combinations of green fruit and white fruit parents. The plants of the F2 population with green fruits and white fruits were segregated at a ratio of 3:1. Furthermore, backcross progenies of F1 and white fruit parents produced plants with green fruit and white fruit at a ratio of 1:1, and a backcross population of F1 and green fruit parents did not produce any white fruit plant. The results certainly indicated green fruit was dominant over white fruit by one nucleus gene and with no cytoplasmic factor involvement among these two hybrid combinations. However, in this report, the fruit color was only indicated as green or white, and no detail of green color level was described. The same conclusion was reported by Dalamu et al. (2012), who analyzed two crosses of white fruit and green fruit parents. Hu et al. (2002) also concluded that the green fruit of bitter gourds was dominant to white fruit via analysis of F2 populations of two crosses. The ratios of green fruit and white fruit were examined and fitted the ratio of 3:1 in F2 populations of both crosses. However, the χ2 value in one of the F2 populations was higher (χ21,0.05 = 3.24) which was very close to the χ2 value at P = 0.05 (3.84). This data implied that the expression of fruit color was unstable between different populations. Meanwhile, Hu et al. (2002) also found the green color of fruit from backcross populations was lighter than green fruit parents. They deduced that green fruit had incomplete dominance over white fruit or modifier effects. In addition, the fruit color expression of backcross populations (BCP1 and BCP2) did not fit the specific ratio for a single gene and the difference between BCP1 and BCP2 (74.2) was close to half the parental difference (86.5), which matched the description of Hill et al. (1998): the difference between BCP1 and BCP2 should be approximately half the parental difference when epistasis is absent. The RHS score of the F2 population was 5.8 which was close to half of the difference between F1 and the mid-parent (mean of two parents) that indicated the dominance effect was present (Hill et al., 1998). The chlorophyll a, chlorophyll b, and total chlorophyll concentrations of the F2 population also showed continuous changes (data not shown). These results implied the inheritance of fruit color and chlorophyll concentrations were controlled by more than three genes, that is, the four color-related traits all were quantitative traits.
Estimation of genetic parametersIn this experiment, the χ2 value of the three parameters model for RHS score showed nonsignificant effects (Table 3) which indicated the inheritance of the RHS score fitted the simple additive-dominance model and that epistasis was absent. The RHS score was influenced by additive and dominant effects, which were significant and highly significant effects, respectively. The results verified the previous conjectures of fruit color classification in that fruit color of bitter gourds involved additive and dominance factors. For the chlorophyll concentrations, analysis results indicated non-allelic interactions were present in the three traits. The analysis of the six parameters model for chlorophyll b concentration was significant for additive effect (a) that indicated additive factors were involved in the expression of chlorophyll b concentration. The estimates of additive (a) and additive × additive interaction (aa) were converse which indicated duplicating type epistasis (Jatothu et al., 2013). The results of the six parameters model showed nonsignificant effects for additive (a), dominance (d), and their interactions (aa, ad, dd) in chlorophyll a and total chlorophyll that implied other interactions of epistasis effects were present. The values of additive effects (a) were relatively larger than dominance effects (d) for concentrations of chlorophyll a and total chlorophyll that indicated additive effects were more important on the inheritance of chlorophyll a and total chlorophyll concentrations (Table 4). Additive effects of all chlorophyll concentrations were negative, indicating F1 population bias from the parents with lower chlorophyll concentrations (P1). The dominance effects (d) of all chlorophyll concentrations of the F1 generation were close to the higher chlorophyll concentration parent (P2).
Regarding additive × additive effects (aa), positive values for three types of chlorophyll concentrations represented the additive × additive effects and were directed to the better parent (P2). The effects of dominance × dominance (dd) were negative values for chlorophyll concentrations implying the dominance × dominance effects were close to the parent with the lower value (P1) in this experiment. In all traits, dominance (d) and dominance × dominance gene effects exhibited opposite signs, indicating duplicating type epistasis (Jatothu et al., 2013). When the epistasis effects were the duplicating type, the mean of F1 was close to the mid-parent and the mean of F2 would be distant from the midparent. The duplicating epistasis inhibits the heterosis of F1. The concentrations of chlorophyll a, b, and total chlorophyll on F1, F2 matched this model (Hayman, 1958). The magnitudes of the dominance and dominance × dominance interactions were smaller than the additive and additive × additive interactions. This means that dominant genes played minor roles in the inheritance of chlorophyll concentrations.
Heritability estimationBroad-sense heritability (h2B) presents the ratio of genetic variance over phenotypic variance in a quantitative trait which estimates the contribution of genetic components (Warner, 1952). The heritability estimates in the broad-sense were higher for chlorophyll b concentration, but the chlorophyll a, total chlorophyll, and RHS score were low. The trait with high h2B suggested that selection in an early generation may improve the phenotype effectively. Moreover, Warner (1952) reported that high heritability in the F2 made effective selection on an individual plant basis possible.
In this study, we presented the results of GMA for a genetic model of fruit color traits in the bitter gourd and found the coloring was controlled by more than three genes which had dominance and additive effects. According to an inheritance model in which dark green fruit hybrids should be produced by green or dark green parents. A green fruit hybrid is suggested to cross from a green fruit parent and a green or white fruit parent, while a white fruit hybrid should be a cross of two white parents. The expressions of chlorophyll had complex interactions, i.e., the fruit color of the bitter gourd was a quantitative trait. The results of this research were different from past findings, and the discrepancies were verified through GMA, a three parameters model, and a six parameters model, which showed that the genetic model of fruit color in the bitter gourd was clearly a quantitative model.