ORIGINAL ARTICLES
Identification of Flavonoids in Leaves of a Labile Bicolor Flowering Dahlia (Dahlia variabilis) ‘Yuino’
2018 Volume 87 Issue 1 Pages 140-148

Details
2018 Volume 87 Issue 1 Pages 140-148
Bicolor flowering dahlias are a group of cultivars that produce inflorescences with bicolored petals characterized by a colored basal part and a white tip. However, they frequently produce single-colored petals, even if they are vegetatively propagated. In a previous study, strong relationships between inflorescence color and leaf phenotype were observed in a red–white bicolor flowering dahlia ‘Yuino’; red petal-producing individuals accumulate flavonoids in leaves, whereas only bicolor petal-producing individuals tend not to accumulate them in leaves. Flavonoids in leaves are assumed to be chalcones. In this study, we investigated flavonoids in the leaves of ‘Yuino’ by nuclear magnetic resonance analysis and identified six caffeoyl esters, four flavonol derivatives, and three novel butein derivatives in the flavonoid-rich leaves of ‘Yuino’. The three novel compounds were butein 4',4-O-di-[2-O-(β-glucopyranosyl)-β-glucopyranoside], butein 4'-O-[2-O-(β-glucopyranosyl)-β-glucopyranoside]-4-O-β-glucopyranoside, and butein 4'-[6-O-(3-hydroxy-3-methylglutaryl)-β-glucopyranoside]-4-O-β-glucopyranoside. On the other hand, only caffeoyl esters were detected in flavonoid-poor leaves. These data demonstrated that flavonoid-rich leaves accumulated the flavonoids of butein and flavonol derivatives. The common enzyme for the biosynthesis of butein and flavonol derivatives is chalcone synthase; thus, the importance of chalcone synthase for phenotypic lability in ‘Yuino’ was confirmed.
Dahlia (Dahlia variabilis) is popular cut flower or garden plant because of the wide variation in its flower traits, such as shapes, sizes, and colors. In particular, the flower colors of cultivars of this species are diversified, and several cultivars have red, purple, pink, yellow, ivory white, black, variegated, and bicolor petals. Bicolor dahlia cultivars are a group of cultivars that produce inflorescences with petals exhibiting a colored base and a white tip. The prominent common characteristic of bicolor dahlia cultivars is the lability or instability of petal colors; in addition to original bicolor petals, they frequently produce single-colored petals without a white tip regardless of whether they are vegetatively propagated. This lability of petal color prevents uniform production of cut or pot flowers of bicolor dahlias.
In our previous study (Ohno et al., 2016), strong relationships between inflorescence colors and leaf flavonoid accumulation were evident, namely, red petal-producing individuals accumulated flavonoids in leaves, whereas only bicolor petal-producing individuals tended not to accumulate them in leaves. This suggested that the phenotypic lability of bicolor dahlias was not only limited in petal colors, but also in leaves. At that time, the flavonoids were presumed to be chalcone derivatives based on the absorption spectra of each peak. However, the flavonoids accumulating in flavonoid-rich leaves can provide information to identify the gene or pathway that is important for the lability of petal color. Thus, in the present study, to confirm that leaves accumulated flavonoids and to reveal that types of compounds that are accumulated in leaves, we identified flavonoids and caffeoyl esters accumulated in leaves by nuclear magnetic resonance (NMR) analysis.
The red–white bicolor flowering dahlia cultivar ‘Yuino’ was used for the present experiment. The cuttings of ‘Yuino’ were grown in the experimental field or greenhouse at Kyoto University (Kyoto, Japan). For NMR analysis, the leaves of the ‘Yuino’ R-line, which tend to produce red petals and to accumulate flavonoids in leaves with high frequency, retaining this characteristic through vegetative propagation (Ohno et al., 2016), were used.
Isolation and purification of A–LThe freeze-dried leaves of ‘Yuino’ R-line (Ohno et al., 2016) (80 g) were immersed in methanol–water (1:1, v/v) (5 L) at room temperature for 1 day and extracted. A–L shown in Figure 1A were isolated and purified by paper chromatography (PC) and a SephadexTM LH-20 (GE Healthcare Japan, Tokyo, Japan) column (35 × 300 mm) chromatography (CC). The amounts of purified A–L obtained from the leaves were as follows: A (7 mg), mixture of B-1 and B-2 (9 mg), C (0.5 mg), D (0.5 mg), E (9 mg), F (6 mg), G (12 mg), H (0.5 mg), I (18 mg), J (2 mg), K (3 mg), and L (7 mg).
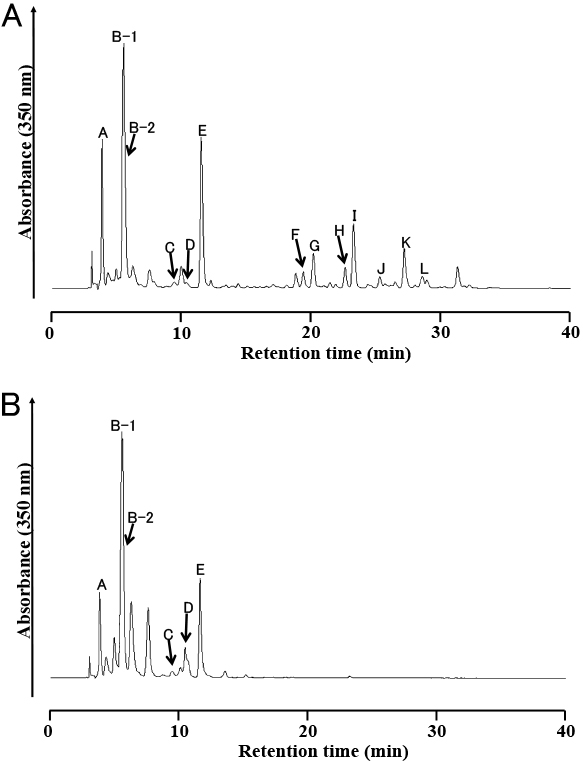
High-performance liquid chromatography profile of leaf extracts in (A) flavonoid-rich leaves and (B) flavonoid-poor leaves. Each compound was identified using nuclear magnetic resonance analyses.
TLC was performed on plastic-coated cellulose sheets (Merck, Darmstadt, Germany) using seven mobile phases: 1) BAW (n-BuOH-HOAc-H2O, 4:1:2, v/v/v), 2) BuHCl (n-BuOH-2N HCl, 1:1, v/v, upper layer), 3) AHW (HOAc-HCl-H2O, 15:3:82, v/v/v), 4) 1% HCl for polyphenols with ultraviolet light and BAW, 5) EAA (EtOAc-HOAc-H2O, 3:1:1, v/v/v), 6) ETN (EtOH-NH4OH-H2O, 16:1:3, v/v/v), and 7) EFW (EtOAc-HCOOH-H2O, 5:2:1, v/v/v) for sugars with aniline hydrogen phthalate spray reagent (Harborne, 1984; Tatsuzawa and Hosokawa, 2016).
High-performance liquid chromatography (HPLC) analysisAnalytical HPLC was performed on an LC 10A system (Shimadzu, Kyoto, Japan) using a Waters C18 (4.6 × 250 mm, Nihon Waters K. K., Tokyo, Japan) column at 40°C with a flow rate of 1 mL·min−1 and monitoring at 350 nm for polyphenols. The eluant was applied as a linear gradient elution for 40 min from 20% to 85% solvent B (1.5% H3PO4, 20% HOAc, 25% MeCN in H2O) in solvent A (1.5% H3PO4 in H2O) with 5 min of re-equilibration at 20% solvent B (method 1). The other eluant for 3-hydroxy-3-methylglutaric acid was applied as an isocratic elution of solvent A for 10 min and monitoring at 210 nm (Tatsuzawa and Hosokawa, 2016) (method 2).
Spectroscopic analysesUltraviolet–visible spectra of flavonoids were recorded in MeOH, MeOH + NaOMe, MeOH + AlCl3, MeOH + AlCl3 + HCl, MeOH + NaOAc, and MeOH + NaOAc + H3BO3 (from 200 to 500 nm) using a UV-Vis Multi-Purpose Spectrophotometer (MPS-2450; Shimadzu). High-resolution fast-atom bombardment mass (FAB-MS) spectra were determined on a JEOL JMS–700 Mass spectrometer (JEOL, Ltd., Tokyo, Japan) operating in the positive ion mode using a 1:1 mixture of dithiothreitol and 3-nitrobenzyl alcohol as a matrix. 1H (400 MHz) and 13C (100 MHz) NMR spectra were measured on a JEOL AL–400 NMR spectrometer (JEOL, Ltd.) using CD3OD-d4 and/or dimethyl sulfoxide (DMSO)-d6 as a solvent. Chemical shifts are reported on the δ-scale from tetramethylsilane as the internal standard, and coupling constants (J) are in Hz.
Over 30 peaks at 350 nm were obtained in the methanol–water (1:1, v/v) extracts from the freeze-dried flavonoid-rich leaves of ‘Yuino’ by HPLC analysis (Fig. 1A). However, most peaks after 15 min of retention time were not detected from freeze-dried flavonoid-poor leaves (Fig. 1B). We eventually identified 13 of these peaks from freeze-dried flavonoid-rich leaves, and the percentages of the identified peaks calculated as the total contents were 8.3% (A), 15.7% (B-1), 7.8% (B-2), 0.6% (C), 1.2%(D), 6.8% (E), 1.8% (F), 8.4% (G), 1.6% (H), 8.0% (I), 1.3% (J), 9.8% (K), and 3.1% (L) (Fig. 1A). Compounds were extracted from 80-g freeze-dried flavonoid-rich leaves of ‘Yuino’ in 5-L methanol–water, followed by isolation using PC and SephadexTM LH-20 CC, and then analyzed by NMR. The chromatographic and spectroscopic properties of A–L are summarized below.
Known compounds 3-O-[(trans)-Caffeoyl]-glucaric acid (A)Pale Brown powder: TLC: UV; blue, UV+NH3, bright blue, (Rf-values) BAW 0.53, BuHCl 0.48, 1% HCl 0.60, AHW 0.76; HPLC; tR(min) 3.8 (method 1), PDA [λmax(nm)] 328, 301sh, FAB-MS m/z 373 [M+H]+ (calc. for C15H17O11), HR-FAB-MS (calc. 373.0771, found: 373.0782); 1H-NMR(CD3OD-d4, int TMS, 400 MHz): Caffeic acid, δ7.04(d, J=1.7 Hz, H-2), 6.77(d, J=8.2 Hz, H-5), 6.94(dd, J=1.7, 8.2 Hz, H-6), 6.28(d, J=15.9 Hz, H-7(α)), 7.60(d, J=15.9 Hz, H-8(β)), Glucaric acid, 4.53(d, J=1.7 Hz, H-2’(5’)), 5.64(dd, J=1.7, 8.5 Hz, H-3’(4’)), 4.33(dd, J=1.4, 8.5 Hz, H-4’(3’)), 4.41(brs, H-5’(2’)); 13C-NMR(CD3OD-d4, int TMS, 100 MHz): Caffeic acid, δ128.2(C-1), 116.4(C-2), 147.2(C-3), 149.9(C-4), 117.2(C-5), 123.9(C-6), 114.9(C-7(α)), 148.4(C-8(β)), 168.9(C-9), Glucaric acid, 175.3(C-1’(6’)), 71.8(C-2’(5’)), 77.2(C-3’(4’)), 74.0(C-4’(3’)), 73.1(C-5’(2’)), 176.0(C-6’(1’)).
2-O-[(trans)-Caffeoyl]-glucaric acid (B-1)Pale brown powder: TLC: UV; blue, UV+NH3, bright blue, (Rf-values) BAW 0.52, BuHCl 0.53, 1% HCl 0.57, AHW 0.77; HPLC; tR(min) 5.5 (method 1), PDA [λmax(nm)] 328, 301sh, FAB-MS m/z 373 [M+H]+ (calc. for C15H17O11), HR-FAB-MS (calc. for C15H17O11: 373.0771. found: 373.0784); 1H-NMR(CD3OD-d4, int TMS, 400 MHz): Caffeic acid, δ7.04(d, J=2.0 Hz, H-2), 6.77(d, J=8.3 Hz, H-5), 6.94(dd, J=2.0, 8.3 Hz, H-6), 6.31(d, J=15.9 Hz, H-7(α)), 7.58(d, J=15.9 Hz, H-8(β)), Glucaric acid, 5.37(d, J=2.2 Hz, H-2’(5’)), 4.56(dd, J=2.2, 7.7 Hz, H-3’(4’)), 4.06(brd, J=7.7 Hz, H-4’(3’)), 4.10(brs, H-5’(2’)); 13C-NMR(CD3OD-d4, int TMS, 100 MHz): Caffeic acid, δ128.0(C-1), 115.1(C-2), 146.8(C-3), 149.8(C-4), 116.5(C-5), 122.9(C-6), 115.8(C-7(α)), 146.9(C-8(β)), 169.1(C-9), Glucaric acid, 171.8(C-1’(6’)), 74.0(C-2’(5’)), 72.9(C-3’(4’)), 74.0(C-4’(3’)), 72.2(C-5’(2’)), 175.9(C-6’(1’)).
5-O-[(trans)-Caffeoyl]-quinic acid (B-2) (neochlorogenic acid)Pale brown powder: TLC: UV; blue, UV+NH3, bright blue, (Rf-values) BAW 0.58, BuHCl 0.62, 1% HCl 0.57, AHW 0.77; HPLC; tR(min) 5.6 (method 1), PDA [λmax(nm)] 326, 300sh, FAB-MS m/z 355 [M+H]+ (calc. for C16H19O9), HR-FAB-MS (calc. for C16H19O9: 355.1029. found: 355.1015); 1H-NMR(CD3OD-d4, int TMS, 400 MHz): Caffeic acid, δ7.09(d, J=2.0 Hz, H-2), 6.79(d, J=8.3 Hz, H-5), 6.98(dd, J=2.0, 8.3 Hz, H-6), 6.38(d, J=15.9 Hz, H-7(α)), 7.70(d, J=15.9 Hz, H-8(β)), Quinic acid, 2.13(brd, J=13.1 Hz, H-2’a), 1.96(dd, J=9.5, 13.1 Hz, H-2’b), 4.14(ddd, J=4.1, 8.9, 8.9 Hz, H-3’), 3.66(dd, J=3.2, 8.3 Hz, H-4’), 5.36(m, H-5’), 2.20(m, H-6’a), 2.17(m, H-6’b); 13C-NMR(CD3OD-d4, int TMS, 100 MHz): Caffeic acid, δ127.8(C-1), 115.2(C-2), 146.9(C-3), 149.5(C-4), 116.5(C-5), 123.3(C-6), 114.3(C-7(α)), 148.2(C-8(β)), 168.5(C-9), Quinic acid, 74.0(C-1’), 41.4(C-2’), 68.5(C-3’), 74.7(C-4’), 73.0(C-5’), 36.8(C-6’), 171.8(C-7’).
4-O-[(trans)-Caffeoyl]-quinic acid (C) (cryptochlorogenic acid)HPLC; tR(min) 9.5 (method 1), PDA [λmax(nm)] 325, 300sh. [This compound was identified by direct comparison with a commercial standard (SIGMA-ALDRICH Co., St. Louis, MO, USA)].
3-O-[(trans)-Caffeoyl]-quinic acid (D) (chlorogenic acid)HPLC; tR(min) 10.5 (method 1), PDA [λmax(nm)] 325, 300sh. [This compound was identified by direct comparison with a commercial standard (Wako Pure Chemical Industries, Ltd, Osaka, Japan)].
2-O-[(trans)-Caffeoyl]-glyceric acid (E)Brown powder: TLC: UV; blue, UV+NH3, bright blue, (Rf-values) BAW 0.76, BuHCl 0.75, 1% HCl 0.38, AHW 0.66; HPLC; tR(min) 11.7 (method 1), PDA [λmax(nm)] 327, 301sh, HR-FAB-MS; [M+H]+ (calc. for C12H13O7: 269.0661. found: 269.0653); FAB-MS m/z 269 [M+H]+ (calc. for C12H13O7), HR-FAB-MS (calc. 269.0661, found: 269.0653); 1H-NMR(CD3OD-d4, int TMS, 400 MHz): Caffeic acid, δ7.07(d, J=2.0 Hz, H-2), 6.78(d, J=8.0 Hz, H-5), 6.97(dd, J=2.0, 8.0 Hz, H-6), 6.37(d, J=15.9 Hz, H-7(α)), 7.66(d, J=15.9 Hz, H-8(β)), Glyceric acid, 5.15(t, J=4.3 Hz, H-2’), 3.98(d, J=4.3 Hz, H-3’); 1H-NMR(DMSO-d6, int TMS, 400 MHz): Caffeic acid, δ7.08(d, J=2.0 Hz, H-2), 6.79(d, J=8.0 Hz, H-5), 7.02(dd, J=2.0, 8.0 Hz, H-6), 6.32(d, J=15.8 Hz, H-7(α)), 7.56(d, J=15.8 Hz, H-8(β)), Glyceric acid, 4.79(t, J=4.4 Hz, H-2’), 3.80(d, J=4.4 Hz, H-3’); 13C-NMR(DMSO-d6, int TMS, 100 MHz): Caffeic acid, δ125.4(C-1), 114.7(C-2), 145.5(C-3), 148.5(C-4), 115.7(C-5), 121.4(C-6), 113.5(C-7(α)), 145.7(C-8(β)), 166.1(C-9), Glyceric acid, 169.8(C-1’), 74.1(C-2’), 60.9(C-3’).
Quercetin 3-O-[(6-O-rhamnosyl)-galactoside] (H)HPLC; tR(min) 22.6 (method 1), PDA [λmax(nm)] 354, 307sh, 266. [This compound was identified by direct comparison with an authentic standard (Tatsuzawa et al., 2015)].
Quercetin 3-O-[(6-O-rhamnosyl)-glucoside] (rutin) (I)Pale yellow powder: UV: λmax(nm) in MeOH 356, 286sh, 266sh, 255; +NaOMe 373, 322, 270; +AlCl3 416, 273; +AlCl3/HCl 398, 358, 298sh, 268; +NaOAc 356, 265sh, 257; +NaOAc/H3BO3 375, 261. TLC: UV; dark brown, UV+NH3, yellow, (Rf-values) BAW 0.58, BuHCl 0.52, 1% HCl 0.18, AHW 0.54; HPLC (method 1); tR(min) 23.2, PDA [λmax(nm)] 354, 300sh, 263, HR-FAB-MS; [M+H]+ calc. for C27H31O16: 611.1612. found: 611.1605. FAB-MS m/z 611 [M+H]+ (calc. for C27H31O16), HR-FAB-MS (calc. 611.1612, found: 611.1605); 1H-NMR(CD3OD-d4, int TMS, 400 MHz): Quercetin, δ6.20(d, J=2.2 Hz, H-6), 6.39(d, J=2.2 Hz, H-8), 7.67(d, J=2.2, 8.0 Hz, H-2’), 6.87(d, J=8.6 Hz, H-5’), 7.63(dd, J=2.2, 8.6 Hz, H-6’), Glucose, 5.11(d, J=7.6 Hz, H-1), 3.45(t, J=7.8 Hz, H-2), 3.42(t, J=8.3 Hz, H-3), 3.27(t, J=8.3 Hz, H-4), 3.44(m, H-5), 3.37(m, H-6a), 3.80(dd, J=1.0, 11.0 Hz, H-6b), Rhamnose, 4.52(d, J=1.5 Hz, H-1), 3.64(dd, J=1.7, 3.4 Hz, H-2), 3.54(dd, J=3.4, 9.5 Hz, H-3), 3.28(t, J=9.5 Hz, H-4), 3.44(m, H-5), 1.12(d, J=6.1 Hz, -CH3); 1H-NMR(DMSO-d6, int TMS, 400 MHz): Quercetin, δ6.20(d, J=2.0 Hz, H-6), 6.40(d, J=2.0 Hz, H-8), 7.54(s, 8.0 Hz, H-2’), 6.86(d, J=8.7 Hz, H-5’), 7.55(brd, J=8.7 Hz, H-6’), Glucose, 5.35(d, J=7.8 Hz, H-1), 3.25(t, J=8.8 Hz, H-2), 3.28(t, J=9.0 Hz, H-3), 3.10(m, H-4), 3.24(m, H-5), 3.30(m, H-6a), 3.71(brd, J=10.5 Hz, H-6b), Rhamnose, 4.40(brs, H-1), 3.41(brs, H-2), 3.25(m, H-3), 3.09(t, J=9.3 Hz, H-4), 3.26(m, H-5), 1.00(d, J=6.1 Hz, -CH3); 13C-NMR(DMSO-d6, int TMS, 100 MHz): Quercetin, δ156.8(C-2), 133.5(C-3), 177.5(C-4), 161.4(C-5), 99.0(C-6), 164.5(C-7), 93.9(C-8), 156.7(C-9), 104.1(C-10), 121.3(C-1’), 116.4(C-2’), 148.6(C-3’), 144.9(C-4’), 115.4(C-5’), 121.8(C-6’), Glucose, 101.4(C-1), 76.6(C-2), 76.0(C-3), 70.2(C-4), 74.3(C-5), 67.2(C-6), Rhamnose, 100.9(C-1), 70.5(C-2), 70.7(C-3), 72.0(C-4), 68.4(C-5), 17.9(-CH3).
Kaempferol 3-O-[(6-O-rhamnosyl)-galactoside] (J)Pale yellow powder: UV: λmax(nm) in MeOH 342, 289, 266; +NaOMe 363, 305, 273; +AlCl3 388, 353, 305, 273; +AlCl3/HCl 392, 344, 302, 274; +NaOAc 345, 319, 299, 268; +NaOAc/H3BO3 349, 294, 266. TLC: UV; brown, UV+NH3, yellow, (Rf-values) BAW 0.68, BuHCl 0.60, 1% HCl 0.30, AHW 0.66; HPLC (method 1); tR(min) 25.2, PDA [λmax(nm)] 347, 297sh, 265, FAB-MS m/z 595 [M+H]+ (calc. for C27H31O15), HR-FAB-MS (calc. 595.1663, found: 595.1656); 1H-NMR(CD3OD-d4, int TMS, 400 MHz): Kaempferol, δ6.21(d, J=2.0 Hz, H-6), 6.40(d, J=2.0 Hz, H-8), 8.10(d, J=9.0 Hz, H-2’,6’), 6.88(d, J=9.0 Hz, H-3’,5’), Galactose, 5.04(d, J=7.8 Hz, H-1), 3.79(dd, J=7.8, 9.6 Hz, H-2), 3.49(dd, J=3.4, 9.6 Hz, H-3), 3.76(d, J=3.4 Hz, H-4), 3.53(m, H-5), 3.62(m, H-6a), 3.72(dd, J=5.6, 10.3 Hz, H-6b), Rhamnose, 4.51(brs, H-1), 3.58(dd, J=2.0, 3.4 Hz, H-2), 3.53(m, H-3), 3.28(t, J=9.5 Hz, H-4), 3.38(dd, J=6.6, 9.6 Hz, H-5), 1.18(d, J=6.1 Hz, -CH3); 13C-NMR(CD3OD-d4, int TMS, 100 MHz): Kaempferol, δ161.7(C-2), 135.7(C-3), 179.6(C-4), 163.1(C-5), 100.2(C-6), 166.6(C-7), 95.0(C-8), 158.6(C-9), 105.2(C-10), 122.7(C-1’), 132.5(C-2’,6’), 116.2(C-3’,5’), 159.3(C-4’), Galactose, 105.6(C-1), 73.0(C-2), 75.1(C-3), 70.2(C-4), 75.4(C-5), 67.4(C-6), Rhamnose, 102.0(C-1), 72.1(C-2), 72.3(C-3), 73.9(C-4), 69.8(C-5), 18.0(-CH3).
Kaempferol 3-O-[(6-O-rhamnosyl)-glucoside] (K)Pale yellow powder: UV: λmax(nm) in MeOH 345, 292, 265; +NaOMe 368, 300, 273; +AlCl3 392, 351, 305, 273; +AlCl3/HCl 389, 345, 301, 273; +NaOAc 348, 266; +NaOAc/H3BO3 348, 266. TLC: UV; brown, UV+NH3, yellow, (Rf-values) BAW 0.66, BuHCl 0.62, 1% HCl 0.24, AHW 0.63; HPLC (method 1); tR(min) 27.1, PDA [λmax(nm)] 347, 297sh, 265, HR-FAB-MS (calc. 595.1663, found: 595.1665); 1H-NMR(CD3OD-d4, int TMS, 400 MHz): Kaempferol, δ6.21(d, J=2.0 Hz, H-6), 6.40(d, J=2.0 Hz, H-8), 8.06(d, J=9.0 Hz, H-2’,6’), 6.89(d, J=9.0 Hz, H-3’,5’), Glucose, 5.12(d, J=7.3 Hz, H-1), 3.42(t, J=8.0 Hz, H-2), 3.40(t, J=8.0 Hz, H-3), 3.23(m, H-4), 3.44(m, H-5), 3.36(m, H-6a), 3.80(brd, J=10.5 Hz, H-6b), Rhamnose, 4.51(brs, H-1), 3.63(dd, J=1.5, 3.4 Hz, H-2), 3.52(dd, J=3.4, 9.6 Hz, H-3), 3.27(m, H-4), 3.46(m, H-5), 1.12(d, J=6.4 Hz, -CH3); 13C-NMR(CD3OD-d4, int TMS, 100 MHz): Kaempferol, δ161.6(C-2), 135.5(C-3), 179.4(C-4), 163.1(C-5), 100.2(C-6), 166.6(C-7), 95.1(C-8), 158.7(C-9), 105.6(C-10), 122.8(C-1’), 132.4(C-2’,6’), 116.2(C-3’,5’), 159.4(C-4’), Glucose, 104.7(C-1), 75.8(C-2), 78.2(C-3), 71.5(C-4), 77.3(C-5), 68.6(C-6), Rhamnose, 102.5(C-1), 72.1(C-2), 72.3(C-3), 73.9(C-4), 69.8(C-5), 18.0(-CH3).
Novel compoundsThe acid hydrolysis of F, G, and L yielded butein [Rt (min) 36.0, method 1] as their aglycone and glucose (Rf-values: BAW 0.32, EAA 0.22, ETN 0.50, EFW 0.19) as their sugar (Harborne, 1984). Moreover, 3-hydroxy-3-metylglutaric acid [Rt (min) 6.8, method 2] was detected in the hydrolysate of L. The aglycone, sugar, and acid were identified by direct comparison with commercial standards.
The structures of F, G, and L were confirmed based on the analyses of their 1H (400 MHz), 13C (100 MHz), and two-dimensional [correlation spectroscopy (COSY), nuclear Overhauser spectroscopy (NOESY), 1H–13C heteronuclear multiple-quantum correlation spectroscopy (HMQC), and 1H–13C heteronuclear multiple-bond correlation (HMBC)] NMR spectra in CD3OD-d4 and DMSO-d6, as well as their high-resolution FAB-MS (HR-FAB-MS) (LMS–700; JEOL Ltd.).
Butein 4'-O-[2-O-(β-glucopyranosyl)-β-glucopyranoside]-4-O-β-glucopyranoside (G)Bright yellow powder: UV: λmax(nm) in MeOH 365, 318, 260; +NaOMe 365, 318sh, 260; +AlCl3 424, 382, 319, 269; +AlCl3/HCl 422, 382, 319, 269; +NaOAc 365, 318, 260; +NaOAc/H3BO3 365, 318, 260. TLC: UV; brown, UV+NH3, orange, (Rf-values) BAW 0.37, BuHCl 0.17, 1% HCl 0.12, AHW 0.50; HPLC (method 1); tR(min) 20.1, PDA [λmax(nm)] 369, 316sh, HR-FAB-MS; [M+H]+ calc. for C33H43O20: 759.2348. found: 759.2349; 1H-NMR(CD3OD-d4, int TMS, 400 MHz): Butein, δ7.28(brs, H-2), 7.24(d, J=8.2 Hz, H-5), 7.21(dd, J=2.0, 8.2 Hz, H-6), 7.66(d, J=15.4 Hz, H-7(α)), 7.77(d, J=15.4 Hz, H-8(β)), 6.62(d, J=2.2 Hz, H-3’), 6.70(dd, J=2.2, 9.0 Hz, H-5’), 8.06(d, J=9.0 Hz, H-6’), Glucose A, 5.24(d, J=7.0 Hz, H-1), 3.69(t, J=9.0 Hz, H-2), 3.44(m, H-3), 3.39(m, H-4), 3.50(m, H-5), 3.71(m, H-6a), 3.91(dd, J=4.6, 12.0 Hz, H-6b), Glucose B, 4.89(d, J=7.6 Hz, H-1), 3.50(t, J=8.0 Hz, H-2), 3.49(t, J=8.3 Hz, H-3), 3.47(m, H-4), 3.61(m, H-5), 3.69(m, H-6a), 3.73(m, H-6b), Glucose C, 4.66(d, J=7.8 Hz, H-1), 3.23(t, J=8.3 Hz, H-2), 3.29(m, H-3), 3.38(m, H-4), 3.47(m, H-5), 3.60(m, H-6a), 3.73(m, H-6b); 1H-NMR(DMSO-d6, int TMS, 400 MHz): Butein, δ7.45(d, J=1.7 Hz, H-2), 7.16(d, J=8.5 Hz, H-5), 7.30(dd, J=1.7, 8.5 Hz, H-6), 7.73(d, J=15.4 Hz, H-7(α)), 7.87(d, J=15.4 Hz, H-8(β)), 6.60(d, J=2.2 Hz, H-3’), 6.66(dd, J=2.2, 8.8 Hz, H-5’), 8.29(d, J=8.8 Hz, H-6’), Glucose A, 5.19(d, J=7.2 Hz, H-1), 3.52(t, J=8.0 Hz, H-2), 3.48(m, H-3), 3.32(t, J=9.0 Hz, H-4), 3.36(m, H-5), 3.47(m, H-6a), 3.73(brd, J=11.0 Hz, H-6b), Glucose B, 4.82(d, J=7.1 Hz, H-1), 3.34(t, J=8.0 Hz, H-2), 3.31(t, J=9.0 Hz, H-3), 3.25(t, J=8.5 Hz, H-4), 3.20(m, H-5), 3.38(m, H-6a), 3.70(m, H-6b), Glucose C, 4.48(d, J=8.0 Hz, H-1), 3.00(t, J=8.3 Hz, H-2), 3.18(m, H-3), 3.15(m, H-4), 3.34(m, H-4), 3.34(m, H-5), 3.42(m, H-6a), 3.50(m, H-6b); 13C-NMR(DMSO-d6, int TMS, 100 MHz): Butein, δ129.1(C-1), 115.6(C-2), 147.0(C-3), 147.9(C-4), 115.9(C-5), 119.1(C-6), 144.6(C-7), 122.0C-8), 192.0(C-9), 114.7(C-1’), 163.3(C-2’), 103.4(C-3’), 165.1(C-4’), 108.3(C-5’), 132.5(C-6’), Glucose A, 101.5(C-1), 82.6(C-2), 75.6(C-3), 69.1(C-4), 76.8(C-5), 60.6(C-6), Glucose B, 104.5(C-1), 73.1(C-2), 75.7(C-3), 69.4(C-4), 77.2(C-5), 60.4(C-6), Glucose C, 97.5(C-1), 74.6(C-2), 76.1(C-3), 69. 7(C-4), 76.7(C-5), 60.4(C-6).
The molecular ion [M+H]+ of G was observed at m/z 759 (C33H43O20), indicating that G comprised butein with three molecules of glucose. The elemental components were confirmed by measuring its HR-FAB-MS. The structure was elucidated based on the analysis of its NMR spectra. The chemical shifts of six aromatic protons and two trans-olefinic protons of the butein moiety with their coupling constants were analyzed. Chemical shifts in the sugar moieties were observed in the region of δ 5.19–3.00 (DMSO-d6) and δ 5.24–3.23 (CD3OD-d4), where three anomeric protons were present at δ 5.19 (d, J = 7.2 Hz, glucose A), δ 4.48 (d, J = 8.0 Hz, glucose C), and δ 4.82 (d, J = 7.1 Hz, glucose B) (DMSO-d6) and at δ 5.24 (d, J = 7.0 Hz, glucose A), δ 4.66 (d, J = 7.8 Hz, glucose C), and δ 4.89 (d, J = 7.6 Hz, glucose B) (CD3OD-d4). Based on the observed coupling constants, glucoses were assumed to be in the β-pyranose form. Based on the results analyses of their COSY spectra analysis, the characteristic methine proton signal [δ 3.52 (DMSO-d6) and δ 3.69 (CD3OD-d4)] shifted to a lower magnetic field was assigned to the H-2 proton of glucose A (Fossen and Andersen, 2006). This result indicated that the OH-2 of glucose A must be glycosylated with a sugar. The NOESY spectra (DMSO-d6 and CD3OD-d4) were used to determine the sites of attachment of the sugars and butein moieties. The signal of the H-1 (δ 5.19: DMSO-d6 and δ 5.24: CD3OD-d4) proton of glucose A, H-1 (δ 4.48: DMSO-d6 and δ 4.66: CD3OD-d4) proton of glucose C, and H-1 (δ 4.82: DMSO-d6 and δ 4.89: CD3OD-d4) proton of glucose B were correlated with the signals of the H-3' and H-5' (δ 6.60 and 6.66: DMSO-d6 and δ 6.62 and 6.70: CD3OD-d4) protons of butein, H-2 (δ 3.52: DMSO-d6 and δ 3.69: CD3OD-d4) proton of glucose A and H-5 (δ 7.16: DMSO-d6 and δ 7.24: CD3OD-d4) proton of butein in the NOESY spectrum, respectively. These characteristic features revealed that the OH-4' position of butein, OH-2 position of glucose A and OH-4 position of butein are bonded to glucose A, glucose C, and glucose B, respectively. Consequently, the structure of G was determined to be butein 4'-O-[2-O-(β-glucopyranosyl)-β-glucopyranoside]-4-O-β-glucopyranoside (Fig. 2), which is a newly identified flavonoid in plants (Andersen and Jordheim, 2006; Harborne and Baxter, 1999; Veitch and Grayer, 2008, 2011). This structure was also confirmed by the analysis of its 13C, including the 1H-13C HMQC and 1H-13C HMBC spectra.
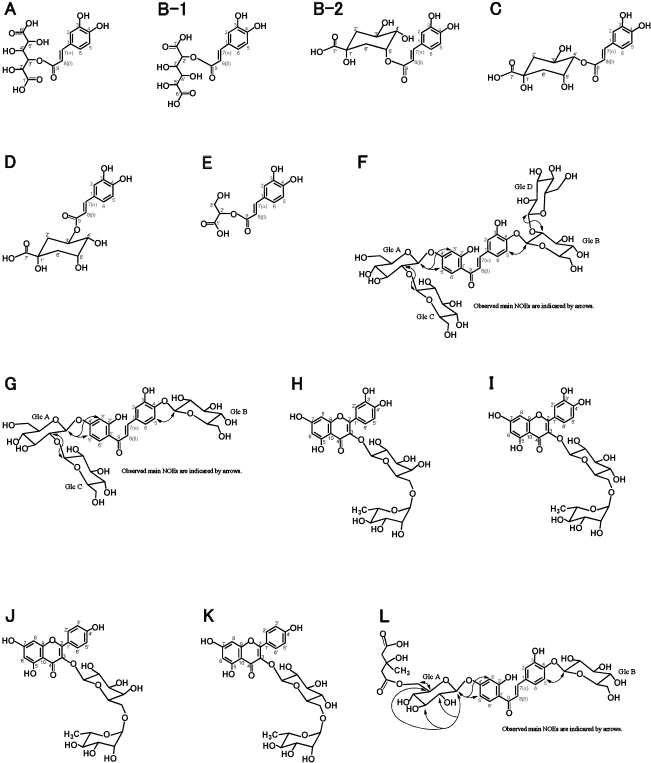
Structures of flavonoids and caffeoyl esters in leaves. A, 3-O-[(trans)-caffeoyl]-glucaric acid; B-1, 2-O-[(trans)-caffeoyl]-glucaric acid; B-2, 5-O-[(trans)-caffeoyl]-quinic acid (neochlorogenic acid); C, 4-O-[(trans)-caffeoyl]-quinic acid (cryptochlorogenic acid); D, 3-O-[(trans)-caffeoyl]-quinic acid (chlorogenic acid); E, 2-O-[(trans)-caffeoyl]-glyceric acid; F, butein 4',4-O-di-[2-O-(β-glucopyranosyl)-β-glucopyranoside]; G, butein 4'-O-[2-O-(β-glucopyranosyl)-β-glucopyranoside]-4-O-β-glucopyranoside; H, quercetin 3-O-[6-O-(rhamnosyl)-galactoside]; I, quercetin 3-O-[6-O-(rhamnosyl)-glucoside] (rutin); J, kaempferol 3-O-[6-O-(rhamnosyl)-galactoside]; K, kaempferol 3-O-[6-O-(rhamnosyl)-glucoside]; L, butein 4'-[6-O-(3-hydroxy-3-methylglutaryl)-β-glucopyranoside]-4-O-β-glucopyranoside.
Bright yellow powder: UV: λmax(nm) in MeOH 360, 311, 283sh, 259sh; +NaOMe 360, 278sh, 259sh; +AlCl3 416, 368, 315, 267sh; +AlCl3/HCl 416, 364, 312, 265sh; +NaOAc 361, 313, 280sh, 259sh; +NaOAc/H3BO3 361, 313, 280sh, 259sh. TLC: UV; brown, UV+NH3, orange, (Rf-values) BAW 0.29, BuHCl 0.10, 1% HCl 0.33, AHW 0.71; HPLC (method 1); tR(min), 19.4, PDA [λmax(nm)] 369, 316sh, HR-FAB-MS; [M+H]+ calc. for C39H53O25: 921.2876. found: 921.2887; 1H-NMR(CD3OD-d4, int TMS, 400 MHz): Butein, δ7.31(d, J=2.2 Hz, H-2), 7.29(d, J=8.4 Hz, H-5), 7.22(dd, J=2.2, 8.4 Hz, H-6), 7.69(d, J=15.4 Hz, H-7(α)), 7.79(d, J=15.4 Hz, H-8(β)), 6.62(d, J=2.2 Hz, H-3’), 6.70(dd, J=2.2, 9.0 Hz, H-5’), 8.08(d, J=9.0 Hz, H-6’), Glucose A, 5.25(d, J=7.3 Hz, H-1), 3.72(t, J=9.0 Hz, H-2), 3.47(m, H-3), 3.40(m, H-4), 3.48(m, H-5), 3.75(m, H-6a), 3.93(brd, J=12.0 Hz, H-6b), Glucose B, 4.93(d, J=7.8 Hz, H-1), 3.80(t, J=8.7 Hz, H-2), 3.70(m, H-3), 3.47(m, H-4), 3.60(m, H-5), 3.69(m, H-6a), 3.90(brd, J=12.0 Hz, H-6b), Glucose C, 4.66(d, J=7.8 Hz, H-1), 3.22(t, J=8.4 Hz, H-2), 3.30–3.90(H-3, H-4, H-5, H-6a, H-6b), Glucose D, 4.76(d, J=7.8 Hz, H-1), 3.27(t, J=8.4 Hz, H-2), 3.30–3.90(H-3, H-4, H-5, H-6a, H-6b); 1H-NMR(DMSO-d6, int TMS, 400 MHz): Butein, δ7.48(d, J=1.7 Hz, H-2), 7.18(d, J=8.6 Hz, H-5), 7.33(dd, J=1.7, 8.6 Hz, H-6), 7.74(d, J=15.4 Hz, H-7(α)), 7.88(d, J=15.4 Hz, H-8(β)), 6.61(d, J=2.2 Hz, H-3’), 6.67(dd, J=2.2, 9.3 Hz, H-5’), 8.30(d, J=9.3 Hz, H-6’), Glucose A, 5.19(d, J=7.1 Hz, H-1), 3.51(m, H-2), 3.10–3.80(H-3, H-4, H-5, H-6a, H-6b), Glucose B, 4.99(d, J=7.3 Hz, H-1), 3.62(t, J=8.9 Hz, H-2), 3.10–3.80(H-3, H-4, H-5, H-6a, H-6b), Glucose C, 4.48(d, J=7.8 Hz, H-1), 3.00(t, J=8.4 Hz, H-2), 3.13(m, H-3), 3.10–3.80(H-4, H-5, H-6a, H-6b), Glucose D, 4.62(d, J=7.8 Hz, H-1), 3.02(t, J=8.7 Hz, H-2), 3.17(m, H-3), 3.10–3.80(H-4, H-5, H-6a, H-6b); 13C-NMR(DMSO-d6, int TMS, 100 MHz): Butein, δ129.6 (C-1), 115.4(C-2), 147.1(C-3), 147.9(C-4), 116.2(C-5), 119.4(C-6), 144.8(C-7), 122.5(C-8), 192.3(C-9), 114.9(C-1’), 163.6(C-2’), 103.6(C-3’), 165.3(C-4’), 108.6(C-5’), 132.7(C-6’), Glucose A, 100.0(C-1), 82.8(C-2), 76.3(C-3), 69.5(C-4), 77.0(C-5), 60.6(C-6), Glucose B, 104.7(C-1), 81.8(C-2), 76.3(C-3), 69.3(C-4), 77.0(C-5), 60.6(C-6), Glucose C, 98.2(C-1), 74.8(C-2), 75.9(C-3), 69. 6(C-4), 77.0(C-5), 60.6(C-6), Glucose D, 104.0(C-1), 74.5(C-2), 75.9(C-3), 69.6(C-4), 77.0(C-5), 60.6(C-6).
The molecular ion [M+H]+ of F was observed at m/z 921 (C39H53O25), indicating that F comprised butein with four molecules of glucose. The elemental components were confirmed by measuring its HR-FAB-MS. The structure was elucidated based on the analysis of its NMR spectra according to the same process as described above for the structure determination of G. The 1H NMR spectra of F was similar to that of G, except for the additional signals of glucose D and OH-2 of glucose B. The chemical shift (δ 3.62; DMSO-d6 and δ 3.80; CD3OD-d4) of the methine proton of glucose B was shifted to a magnetic field lower than those of G, indicating that OH-2 of glucose B was glycosylated with glucose D in G. Moreover, the signal of the H-1 (δ 5.19: DMSO-d6 and δ 5.25: CD3OD-d4) proton of glucose A, H-1 (δ 4.48: DMSO-d6 and δ 4.66: CD3OD-d4) proton of glucose C, H-1 (δ 4.99: DMSO-d6 and δ 4.93: CD3OD-d4) proton of glucose B, and H-1 (δ 4.62: DMSO-d6 and δ 4.76: CD3OD-d4) proton of glucose D were correlated with the signals of the H-3' and H-5' (δ 6.61 and 6.67: DMSO-d6 and δ 6.62 and 6.70: CD3OD-d4) protons of butein, H-2 (δ 3.51: DMSO-d6 and δ 3.72: CD3OD-d4) proton of glucose A, H-5 (δ 7.18: DMSO-d6 and δ 7.29: CD3OD-d4) proton of butein, and H-2 (δ 3.62: DMSO-d6 and δ 3.80: CD3OD-d4) proton of glucose B in the NOESY spectrum, respectively. Therefore, the structure of F was determined to be butein 4',4-O-di-[2-O-(β-glucopyranosyl)-β-glucopyranoside] (Fig. 2), which is a newly identified flavonoid in plants (Andersen and Jordheim, 2006; Harborne and Baxter, 1999; Veitch and Grayer, 2008, 2011). This structure was also confirmed by the analysis of its 13C NMR spectra.
Butein 4'-[6-O-(3-hydroxy-3-methylglutaryl)-β-glucopyranoside]-4-O-β-glucopyranoside (L)Yellow powder: UV: λmax(nm) in MeOH 364, 317, 259; +NaOMe 364, 317sh, 259; +AlCl3 422, 377, 320, 266; +AlCl3/HCl 421, 378, 320, 266; +NaOAc 364, 317, 259; +NaOAc/H3BO3 364, 317, 259. TLC: UV; brown, UV+NH3, orange, (Rf-values) BAW 0.50, BuHCl 0.37, 1% HCl 0.04, AHW 0.37; HPLC (method 1); tR(min) 28.4, PDA [λmax(nm)] 368, 318sh, HR-FAB-MS; [M+H]+ calc. for C33H41O19: 741.2242. found: 741.2246; 1H-NMR(CD3OD-d4, int TMS, 400 MHz): Butein, δ7.46(d, J=2.0 Hz, H-2), 7.23(d, J=8.8 Hz, H-5), 7.19(dd, J=2.0, 8.8 Hz, H-6), 7.73(d, J=15.4 Hz, H-7(α)), 7.78(d, J=15.4 Hz, H-8(β)), 6.30(d, J=2.4 Hz, H-3’), 6.74(dd, J=2.4, 8.8 Hz, H-5’), 8.14(d, J=8.8 Hz, H-6’), Glucose A, 5.02(d, J=7.2 Hz, H-1), 3.49(t, J=8.1 Hz, H-2), 3.47(t, J=8.1, H-3), 3.41(t, J=8.3, H-4), 3.74(m, H-5), 4.19(dd, J=6.8, 11.9 Hz, H-6a), 4.48(dd, J=2.0, 11.9 Hz, H-6b), Glucose B, 4.92(d, J=7.2 Hz, H-1), 3.44(t, J=8.3 Hz, H-2), 3.35(m, H-3), 3.27(m, H-4), 3.35(m, H-5), 3.72(dd, J=5.4, 12.0 Hz, H-6a), 3.91(dd, J=2.0, 12.0 Hz, H-6b), 3-hydroxy-3-methylglutaric acid, 2.54(d, J=15.5 Hz, H-2a), 2.37(d, J=15.5 Hz, H-2b), 2.64(brs, H-4a and b), 1.30(s, -CH3); 1H-NMR(DMSO-d6, int TMS, 400 MHz): Butein, δ7.07(m, H-2), 7.08(brs, H-5), 7.06(brd, J=8.3 Hz, H-6), 7.67(d, J=15.4 Hz, H-7(α)), 7.90(d, J=15.4 Hz, H-8(β)), 6.70(d, J=2.2 Hz, H-3’), 6.74(dd, J=2.2, 9.0 Hz, H-5’), 8.17(d, J=9.0 Hz, H-6’), Glucose A, 4.92(d, J=7.3 Hz, H-1), 3.28(t, J=8.8 Hz, H-2), 3.20(m, H-3), 3.45(m, H-4), 3.70(m, H-5), 3.89(dd, J=8.7, 11.9 Hz, H-6a), 4.48(brd, J=11.9 Hz, H-6b), Glucose B, 4.89(d, J=7.6 Hz, H-1), 3.31(t, J=8.1 Hz, H-2), 3.29(m, H-3), 3.10(t, J=9.1 Hz, H-4), 3.14(m, H-5), 3.46(m, H-6a), 3.71(brd, J=11.9 Hz, H-6b), 3-hydroxy-3-methylglutaric acid, 2.26(d, J=15.6 Hz, H-2a), 2.18(d, J=15.6 Hz, H-2b), 2.51(brs, H-4a and b), 1.21(s, -CH3); 13C-NMR(DMSO-d6, int TMS, 100 MHz): Butein, δ129.1(C-1), 115.2(C-2), 144.7(C-3), 148.1(C-4), 115.2(C-5), 119.4(C-6), 143.3(C-7), 120.9C-8), 191.5(C-9), 115.2(C-1’), 163.4(C-2’), 104.6(C-3’), 164.2(C-4’), 108.3(C-5’), 131.9(C-6’), Glucose A, 101.1(C-1), 73.0(C-2), 75.0(C-3), 69.2(C-4), 76.1(C-5), 63.9(C-6), Glucose B, 100.9(C-1), 73.0(C-2), 75.0(C-3), 69.2(C-4), 76.1(C-5), 61.3(C-6), 3-hydroxy-3-methylglutaric acid, 176.0(C-1), 48.3(C-2), 69.7(C-3), 46.8(C-4), 171.0(C-5), 27.9(-CH3).
The molecular ion [M+H]+ of L was observed at m/z 741 (C33H41O19), indicating that L comprised butein with two molecules of glucose and one molecule of 3-hydroxy-3-methylglutaric acid. The elemental components were confirmed by measuring its HR-FAB-MS, and the mass data are summarized in this section. The structure was elucidated based on the analysis of the NMR spectra according to the same process as described above for the structural determination of G. The 1H NMR spectra of L was similar to those of G, except for the additional signals of 3-hydroxy-3-methylglutaric acid and without the glucose C moieties. The chemical shift (δ 3.89 H-6a and 4.48 H-6b; DMSO-d6 and δ 4.19 H-6a and 4.48 H-6b; CD3OD-d4) of methylene protons of glucose A were shifted to a magnetic field lower than those of G, indicating that the OH-6 of glucose A was acylated with 3-hydroxy-3-methylglutaric acid in L. Therefore, the structure of L was determined to be butein 4'-[6-O-(3-hydroxy-3-methylglutaryl)-β-glucopyranoside]-4-O-β-glucopyranoside (Fig. 2), which is a newly identified flavonoid in plants (Andersen and Jordheim, 2006; Harborne and Baxter, 1999; Veitch and Grayer, 2008, 2011). This structure was also confirmed by the analysis of its 13C NMR spectra.
In our previous report (Ohno et al., 2016), ‘Yuino’ leaves were classified into two types: flavonoid-rich leaves and flavonoid-poor leaves, and a relationship between petal colors and leaf flavonoid accumulation was evident, namely red petal-producing individuals accumulated flavonoids in leaves, whereas only bicolor petal-producing individuals tended not to accumulate them in leaves. At that time, the flavonoids in the leaves of ‘Yuino’ were presumed to be chalcone-like compounds using photodiode array analysis. Thus, in this study, to confirm this assumption and to identify each flavonoid compound in leaves of ‘Yuino’, we performed NMR analysis.
By analysis at 350 nm using HPLC, more than 30 peaks were detected from flavonoid-rich leaves (Fig. 1A), whereas only peaks before 15 min of retention time were detected from flavonoid-poor leaves (Fig. 1B). The structures of known compounds were determined by comparing their spectroscopic and/or chromatographic data with values in the literature and were identified as 3-O-[(trans)-caffeoyl]-glucaric acid (A) (Maas et al., 2009; Nagels et al., 1982), 2-O-[(trans)-caffeoyl]-glucaric acid (B-1) (Strack et al., 1987), 5-O-[(trans)-caffeoyl]-quinic acid (neo-chlorogenic acid) (B-2) (Liu et al., 2013), 4-O-[(trans)-caffeoyl]-quinic acid (crypto-chlorogenic acid) (C) (Tatsuzawa et al., 2015), 3-O-[(trans)-caffeoyl]-quinic acid (chlorogenic acid) (D) (Tatsuzawa et al., 2015), 2-O-[(trans)-caffeoyl)-glyceric acid (E) (Hahn and Nahrstedt, 1993), quercetin 3-O-[6-O-(rhamnosyl)-galactoside] (H) (Tatsuzawa et al., 2015), quercetin 3-O-[6-O-(rhamnosyl)-glucoside] (rutin) (I) (Tatsuzawa et al., 2015), kaempferol 3-O-[6-O-(rhamnosyl)-galactoside] (J) (Tatsuzawa et al., 2015), and kaempferol 3-O-[6-O-(rhamnosyl)-glucoside] (K) (El-Sherbeni et al., 2014) (Fig. 2). The structures of novel compounds were determined to be butein 4',4-O-di-[2-O-(β-glucopyranosyl)-β-glucopyranoside] (F), butein 4'-O-[2-O-(β-glucopyranosyl)-β-glucopyranoside]-4-O-β-glucopyranoside (G), and butein 4'-[6-O-(3-hydroxy-3-methylglutaryl)-β-glucopyranoside]-4-O-β-gluco-pyranoside (L) (Fig. 2). These flavonoids were different from those isolated from the leaves of Dahlia tenuicaulis (5,7,4'-trimethoxyflavanone, 5-hydroxy-7,4'-dimethoxyflavanone, 2'-hydroxy-4,4,6'-trimethoxy-chalcone, and 5,7,4'-trimethoxyflavan-4-ol) (Lam and Wrang, 1975). These data demonstrated that flavonoid-rich leaves, but not flavonoid-poor leaves, have the potential to synthesize butein and flavonol derivatives.
Butein is a type of bright yellow chalcone. Both butein and flavonol are formed by the condensation of three molecules of malonyl-coenzyme A (CoA) with one molecule of 4-coumaroyl-CoA. The enzymes presumably involved in butein synthesis are chalcone synthase (CHS), chalcone reductase, and chalcone 3-hydroxylase (Ohno et al., 2011a; Schlangen et al., 2010), whereas those involved in flavonol synthesis are CHS, chalcone isomerase, flavanone 3-hydroxylase, and flavonol synthase (Winkel-Shirley, 2001). Thus, common steps to biosynthesis butein and flavonol are chalcone biosynthsis and its upstream. Therefore, it was implied that CHS and/or upstream phenylpropanoid pathway enzyme activity was lost in flavonoid-poor leaves. In fact, in flavonoid-poor leaves, the expression of DvCHS2, which encodes the abundantly expressed CHS in leaves, was silenced by post-transcriptional gene silencing (PTGS) (Ohno et al., submitted). This suggested that the loss of buteins and flavonols in flavonoid-poor leaves resulted from the PTGS of DvCHS2. The PTGS of DvCHS2 is also important for bicolor formation and lability of petal colors in bicolor flowering cultivars (Ohno et al., 2011b; Ohno et al., submitted). Therefore, the data obtained in the present study supports the importance of PTGS of DvCHS2 in the phenotypic lability of the bicolor flowering dahlia ‘Yuino’.