ORIGINAL ARTICLES
Predicted Effects of Climate Change on Winter Chill Accumulation by Temperate Trees in South Korea
2018 Volume 87 Issue 2 Pages 166-173

Details
2018 Volume 87 Issue 2 Pages 166-173
This study was conducted to understand the characteristics of winter chill accumulation in South Korea and to predict its fluctuations due to global climate change. Using climate data for 30 regions and previously established models, we estimated winter chill accumulation for those regions and predicted future changes. The temperature range from 0–7.2°C is considered effective for breaking endodormancy, so an average of 1750 chilling hours was supplied per winter between 1999 and 2015. The 30 study regions were divided into five groups based on temperature distribution. Groups 1 and 2 had fewer and more than 830 annual hours at temperatures of 0–3.6°C, respectively. Groups 3, 4, and 5 had 950–1310, 1310–1515, and more than 1515 hours, respectively, at temperatures below 0°C. The number of hours the groups was exposed to the effective temperature range for breaking endodormancy under the projected elevated temperature conditions decreased from group 5 to group 1; the loss of effective hours was in the same order. As a result, winter chill accumulation abruptly decreased from group 5 to group 1 under elevated climatic temperature conditions. The delay in the start of winter chill accumulation increased from groups 4 and 5 to group 1, and the end came earlier in the same order; groups 4 and 5 showed very similar changes at the start and end of chill accumulation. Under elevated temperature conditions, chilling accumulation is expected to start later and end earlier in all regions. These changes will be accelerated with a greater rise in regional temperatures, and elevated temperatures will lengthen the endodormancy of woody plants, but shorten the period of chilling accumulation. The results of this study can be used as fundamental data to establish plans for responses to climate change such as the selection and renewal of cultivars.
Global climate change is underway, which indicates that organisms need to acclimate to the changing environment. As plants are sessile organisms, they are effectively passive to environmental changes and, therefore, their acclimation to a new environment is critical for their survival (Dokoozlian, 1999; Dokoozlian et al., 1995; Lavee and May, 1997).
Plants can be divided into annual herbaceous plants and perennial woody plants. Annual herbaceous crop plants can easily be adapted to the changing climate by adjusting the time of their planting and harvesting. In contrast, perennial woody plants adapt less easily to the changes in climate since they have physiological cues with fixed timings (Luedeling et al., 2009). In particular, the physiological traits in perennial woody plants that are associated with chilling and endodormancy during winter are acknowledged as the system most vulnerable to climate change among the many agricultural systems (Blanke, 2008; Cannell et al., 1989). The annual growth cycle of a temperate woody plant starts with endodormancy breaking; therefore, negative effects of climate change on the physiology of endodormancy inevitably affect the subsequent growth processes (Guo et al., 2015; Jones et al., 2013; Luedeling et al., 2013).
Endodormancy regulation is of considerable ecological significance in nature and has important practical implications in horticulture when fruit crops are regulated to grow fruit outside their natural growing season (Sønsteby and Heide, 2014). A perennial woody plant must be exposed to chilling for a certain period of time to break endodormancy. The predicted and ongoing climate change may also strongly affect plant endodormancy relations due to the reduced chilling potential of warmer winters. Declining levels of winter chill units have thus been identified and symptoms of insufficient winter chill units such as irregular bud break and flowering, reduced shoot growth, and reduced fruit yields have been observed in a range of perennial fruit tree species in both Europe (Atkinson et al., 2013) and North America (Baldocchi and Wong, 2008).
The required length of the chilling period for each species is known as the chilling requirement. Various models, including the chill hour (CH) model (Weinberger, 1950), the Utah model (Richardson et al., 1974), and the dynamic model (Fishman et al., 1987a, b), have been developed to evaluate the chilling requirement in different species. The CH model is the simplest and most commonly used, and proposes that the chilling requirement can be measured as the number of hours within a temperature range of 0–7.2°C. This model is considered the most appropriate for comparing different species (Luedeling et al., 2009) and has been used as a standard model for studying various climate change-related issues (Alburquerque et al., 2008; Baldocchi and Wong, 2008; Ruiz et al., 2007).
Chilling requirements are species- and cultivar-specific and genetically determined (Atkinson et al., 2013). Therefore, understanding the chilling requirement is critical for evaluating plant responses to climate change (Londo and Johnson, 2014). Various studies have been conducted on chilling traits of fruit trees as these traits are directly related to productivity and economic feasibility; similar studies have also been performed on woody plants in forests (Heide, 1993; Myking and Heide, 1995). Many studies have focused on evaluating the chilling requirements of crop species (Campoy et al., 2012; Rahemi and Pakkish, 2009; Zhuang et al., 2016). In South Korea, various studies have been conducted to identify fruit tree varieties with low chilling requirements because temperate fruit trees are cultivated throughout the country (Kweon et al., 2013; Lee et al., 2015a, b).
Decreases in winter chilling create problems principally in regions with mild winters (Atkinson et al., 2013; Baldocchi and Wong, 2008). In South Korea, cultivation of subtropical fruit species that cannot maintain their perenniality in cold winters is expanding from the southern regions. Thus, countermeasures and response to mild winters need to be prepared. This study addressed two questions: 1) how many effective chilling hours are required to break endodormancy in South Korea? 2) How will chill accumulation change in the future? To answer these questions, we studied 480 endodormancy periods in 30 regions between 1999 and 2015; we then used these data and existing models to make predictions of future conditions. To increase the reliability of the results, we utilized proven models and statistical techniques rather than developing a new analysis method. The approaches and results from this study provide basic information to understand global climate change from the perspective of plants. Furthermore, the information may aid in the management of agricultural systems under global climate change.
We aimed to collect the most complete data for as many areas as possible. We examined climate data from the Korea Meteorological Administration (climate change scenario, http://www.climate.go.kr., april 15, 2016) and identified 30 regions with continuous hourly temperature data between 1999 and 2015. The study regions were evenly distributed across the country in regions with cultivated temperate woody plants, excluding some mountainous areas.
Estimation of chilling periodTo identify the annual chilling accumulation, we added the number of hours with temperatures between 0 and 7.2°C from September 1 until the end of the chilling period. We investigated the start, the end, and the duration of chilling accumulation associated with the timing of winter chilling accumulation. The start of chilling accumulation was the first day when the temperature dropped below 7.2°C. The end of chilling accumulation was the last day when the minimum daily temperature was below 7.2°C. To facilitate statistical analysis, we converted the start and end dates to the number of days after September 1. For example, October 30 is 60 days after September 1; hence, this date was converted to 60. The duration of chilling accumulation was calculated as the number of days between the start and the end of the chilling accumulation, taking into account leap years. To calculate the temperature distribution, the temperature was divided into five levels (< 0, 0–3.6, 0–7.2, 3.7–7.2, and >7.2°C) and we determined the number of hours accumulated at each level.
The representative concentration pathways (RCP) 8.5 climate change scenario provided by the Korea Meteorological Administration (2016) was used to estimate the changes in chilling accumulation due to elevated temperature. The RCP 8.5 scenario assumes that greenhouse gas emissions will continue along the current increase pattern, and predicts future temperatures by extrapolation from the trends in temperature elevation until 2010. The scenario predicts that temperature will increase by approximately 0.7°C per decade. Consequently, temperature is projected to increase in each decade from the 2020s to the 2090s by 1.5, 1.9, 2.7, 3.3, 4.0, 4.7, 5.3, and 6.0°C. These eight values of the elevated temperature were used as calibration points to derive regression equations, which applied elevated temperatures to temperature data between 1999 and 2015. Thus, the temperature-elevated condition described in the present study represents a contrast relative to the conditions between 1999 and 2015.
The elevated temperatures were applied to the hourly temperature data from 1999 to 2015 by applying the method of Midgley and Lötze (2011). Thus, for a given region, hourly temperature data of each year were used as temperature samples for the region. Thus, the number of standard samples in a region was 16 seasons from 1999–2000 to 2014–2015. For example, the temperature of a given region with a temperature elevation of 1.5°C was predicted by adding 1.5°C to the hourly temperature data of the existing 16 data sets to generate 16 predicted data sets. In the latter, the quantities and durations of chilling accumulation and dates when the chilling accumulation started and ended were investigated. The latest of the 16 dates when chilling accumulation was started in each region or the elevated temperature condition was designated the start date of chilling accumulation for that region or the elevated temperature condition. The end date of chilling accumulation was selected as the earliest date among the 16 dates when chilling accumulation ended. Duration of chilling accumulation was measured as the shortest of the 16 durations. The quantity of chilling accumulation was selected as the lowest among the 16 data sets. The investigation was performed using the above criteria in order to predict the most unfavorable conditions for chilling accumulation in temperate trees. These analyses based on the 16 data sets were repeated for each of the elevated temperatures (see above) and regions.
Statistical analysisThe 30 regions were classified into five groups using a hierarchical cluster analysis with Ward’s method, and the five temperature level classes (described above) were used as variables. The results are expressed as a dendrogram. Two discriminant analyses were performed to simplify the dividing criteria among the five groups. In the first discriminant analysis, all variables used in the cluster analysis were examined and a variable with the largest absolute standardized canonical discriminant function coefficient was selected; this variable is the most important variable distinguishing two groups. Previously selected variables were used in the second discriminant analysis. The results of these two steps, including discrimination variables and discrimination criteria, are expressed in the dendrogram. Multivariate analysis was conducted to compare the five groups, and Scheffe’s test (P ≤ 0.05) was used as a post-hoc analysis. Furthermore, linear regression analysis was used to identify the characteristics of chilling accumulation to the present time and to predict the dynamics of chilling accumulation characteristics under elevated temperatures.
We selected periods and regions that allowed analysis of as many areas as possible, for as long as possible, and finally selected 30 regions with no missing hourly temperature values within a season (Fig. 1).

Locations of the 30 study regions in South Korea. The regions were classified into five groups by a hierarchical cluster analysis using Ward’s method. Temperature distributions of each region between 1999 and 2015 were input as variables in the cluster analysis. Black ( ), red (
 ), green (
 ), blue (
 ), and pink (
 ) dots indicate groups 1, 2, 3, 4, and 5, respectively.
The annual chilling accumulation in South Korea averaged 1750.1 h from mid-October to the end of April or early May between 1999 and 2015. The level of chilling accumulation did not show a consistent trend with latitude (Fig. 2A). In contrast, indices related to the timing of chilling accumulation were significantly (P < 0.001) correlated with latitude (Fig. 2B–D). The start of chilling accumulation occurred 4.6 days earlier per degree increase in latitude, and the end of the chilling accumulation was delayed by approximately 3.5 days per degree increase in latitude. Consequently, a one-degree increase in latitude extended the chilling period by approximately 8 days. Some regions in middle latitudes had longer durations of chilling accumulation than regions of lower or higher latitudes, although this tendency did not have statistical significance. These results were likely due to differences in altitude, as the mid-latitude regions were located at higher altitudes than regions at other latitudes. These results suggest that the characteristics of chilling supply should not be categorized by latitude alone.
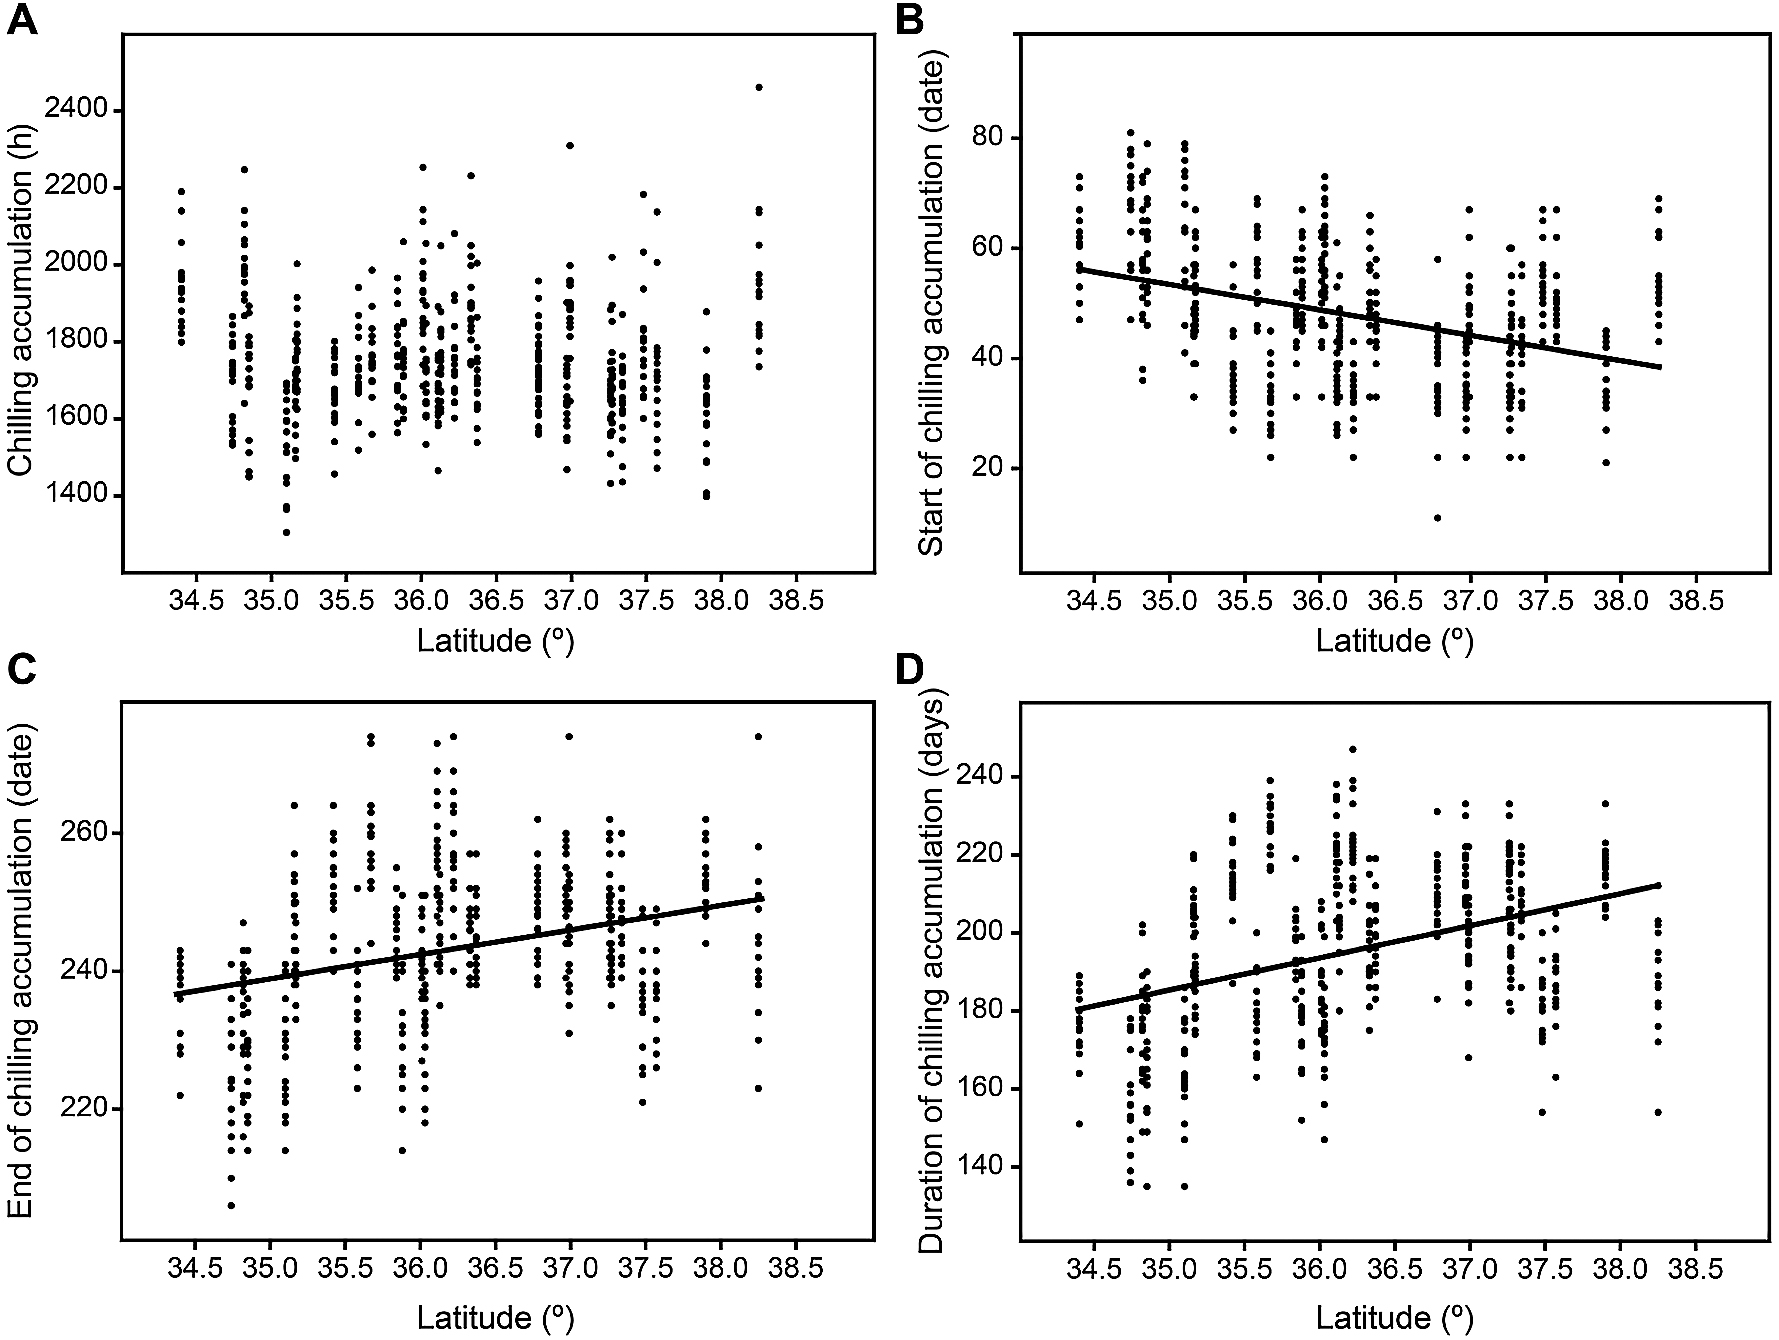
Characteristics of chilling accumulation by latitude in South Korea between 1999 and 2015. The start and the end of chilling accumulation are the first and last dates when the minimum daily temperature was below 7.2°C, starting from September 1. The duration of chilling accumulation was calculated as the number of days between the start and the end of chilling accumulation. Dots indicate annual data in each region (n = 480).
The 30 study regions were divided into five groups as described above (Fig. 3). The groups were classified according to the number of hours with temperatures lower than 0°C and the number of hours with temperatures in the range of 0–3.6°C. In summary, group 1 had ≤950 h of temperatures <0°C and ≤830 h of temperatures in the range of 0–3.6°C. Group 2 had ≤950 h of temperatures <0°C and >830 h of temperatures in the range of 0–3.6°C. Groups 3, 4, and 5 had 950–1310, 1310–1515, and >1515 h, respectively, of temperatures <0°C.

Dendrogram showing classification of the study regions by a hierarchical cluster analysis using Ward’s method. The number of hours at the five temperature levels (< 0, 0–3.6, 0–7.2, 3.7–7.2, and > 7.2°C) were input into the cluster analysis as variables. Groups were created as the result of discriminant analysis. The same variables as used in the cluster analysis were input into the discriminant analysis.
The comparisons of the chilling accumulations of these five groups between 1999 and 2015 revealed that the number of hours with temperature of 0–7.2°C did not show a consistent pattern with the order of groups and that the overall difference among them was not significant (Table 1). In contrast, the number of hours with temperatures <0°C decreased significantly from group 1 to group 5. The number of hours with temperatures in the range 0–3.6°C did not show a trend among the groups, although that of group 1 was significantly lower than those of other groups. The number of hours of temperature in the range 3.7–7.2°C decreased from group 1 to group 5, whereas the number of hours with temperatures above 7.2°C did not show any specific trend among the groups.
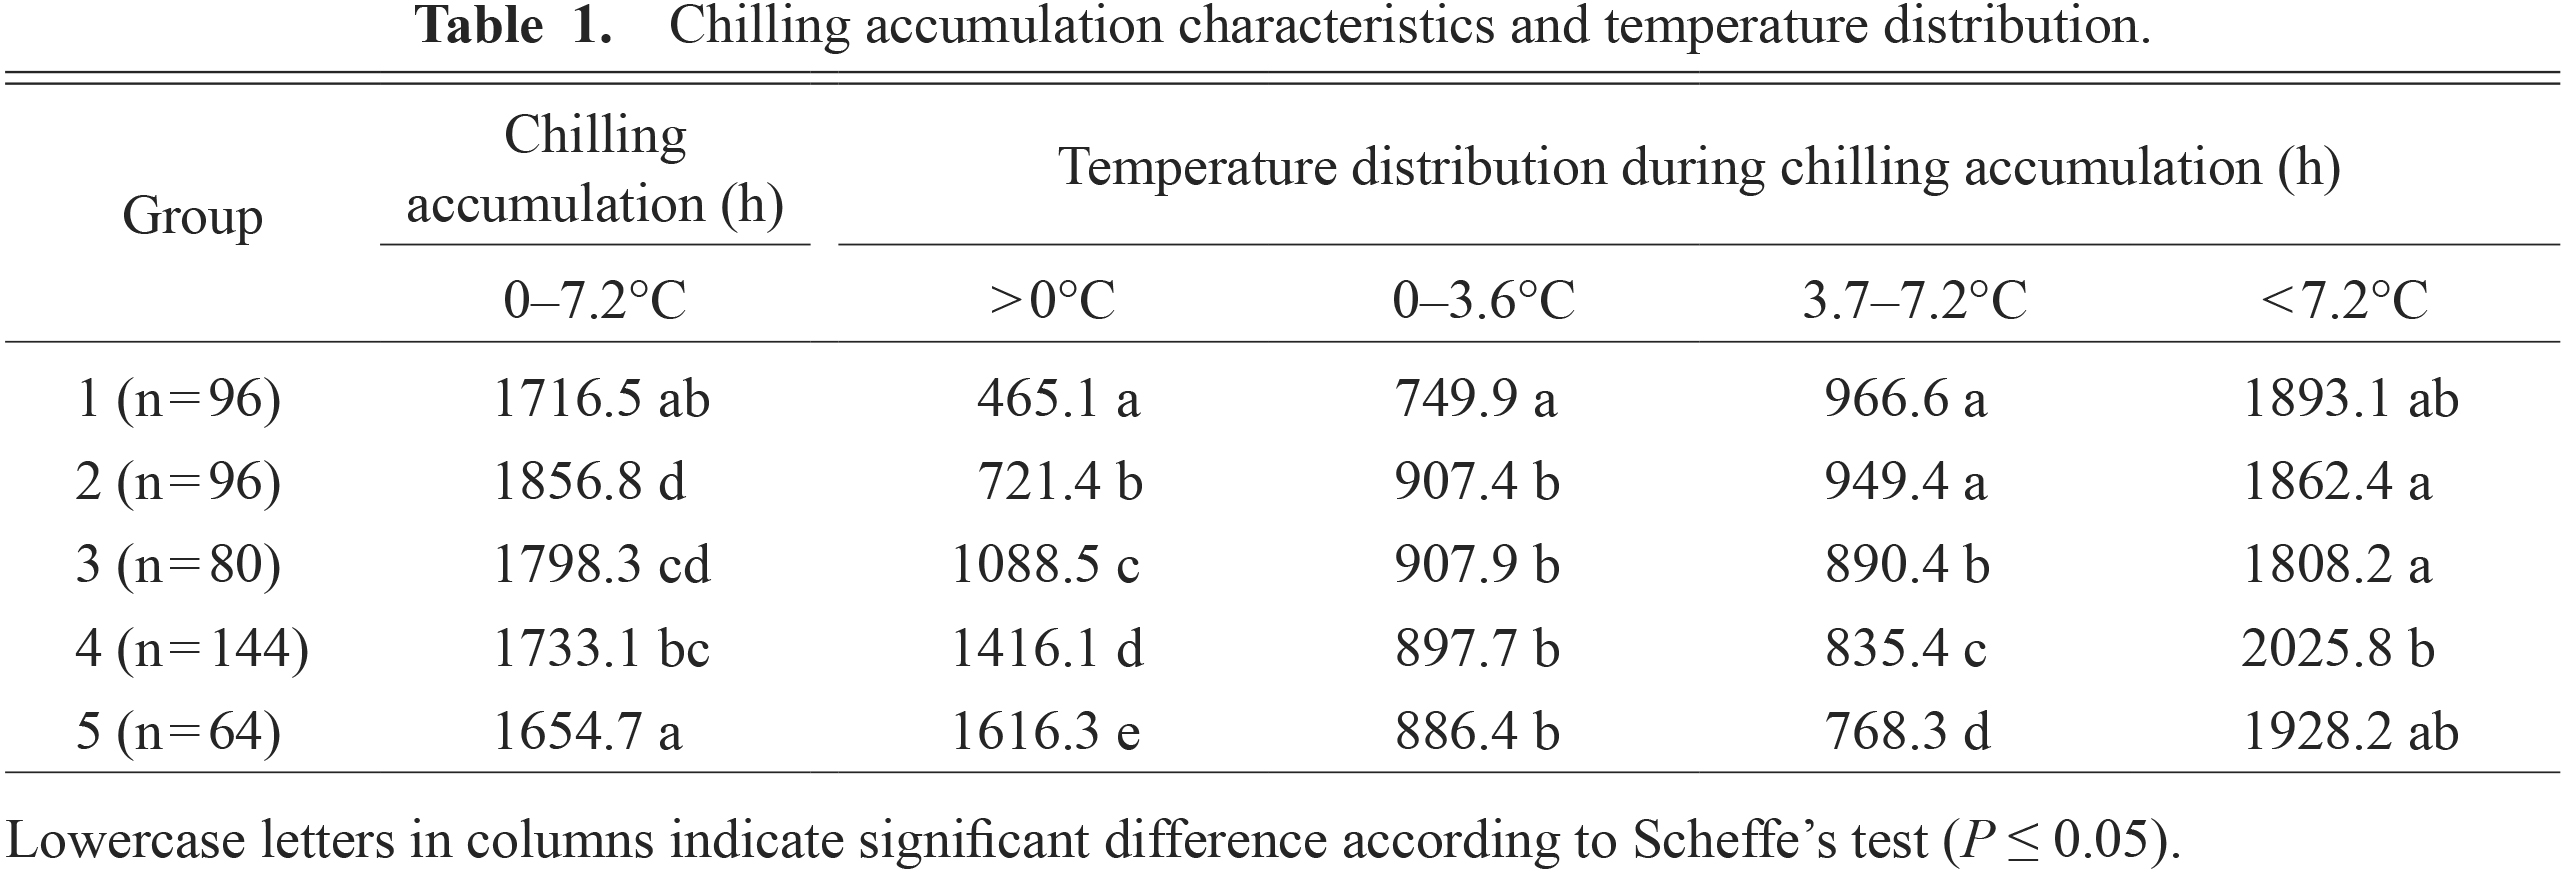
Chilling accumulation characteristics and temperature distribution.
Elevated temperatures from 1.5 to 6.0°C were applied to temperature data in each region to determine the expected pattern of chilling accumulation in each group. Group 1 was expected to experience the most rapid decrease in chilling accumulation (Fig. 4A; Table 2). It was projected that this group would have 1200 and 800 fewer hours of chilling accumulation when the temperature increased by 3°C and 5°C, respectively. Chilling accumulation in group 2 decreased at a similar pace as that in group 1; however, it consistently had 250–300 h more than group 1 had, until the temperature increased by 6.0°C. It was predicted that the chilling accumulation would be 1200 h with a temperature increase of 4.9°C. The chilling accumulation of group 3 was expected to decrease by 100 h per 1°C temperature increase. However, our results showed that it would still have more than 1200 h of chilling accumulation even if temperature increased by 6.0°C. Groups 4 and 5 showed similar projected dynamics in chilling accumulation. Since they showed little change in chilling accumulation, the quantity of chilling accumulation was expected to remain stable until the temperature increased by 6.0°C. In contrast, the period of chilling accumulation decreased from group 5 to group 1, in that order, due to a delayed start and earlier end time of the chilling accumulation period (Fig. 4B–D; Table 2). This trend was expected to continue until the temperature increased by 6.0°C. Overall, all five groups showed very similar patterns in the dynamics of the start, end, and duration of chilling accumulation. It was projected that if temperature increased by 6.0°C, the chilling accumulation would start 20–25 days later and end 25–30 days earlier, resulting in a chilling accumulation duration 45–55 days shorter, as compared to the conditions from 1999–2015.

Changes in chilling accumulation characteristics under elevated temperature conditions. The graphs show linear regression lines of temperature data derived by adding the temperature elevation to the collected temperature data. Black ( ), red (
 ), green (
 ), blue (
 ), and pink (
 ) lines indicate groups 1, 2, 3, 4, and 5, respectively.

Regression functions and statistical values of the five groups under elevated temperature conditions.
Londo and Johnson (2014) compared 27 grape varieties, and reported that 25 of them required less than 1750 h of chilling. Kweon et al. (2013) compared the chilling requirements of nine apple varieties, which occupy the largest area of fruit tree cultivation in South Korea, and found that it was in the range of 1363–1699 h. These values are lower than the current 1750 h of available chilling accumulation, indicating that these apple varieties can successfully break endodormancy under current winter temperature conditions. Thus, the breaking of endodormancy in South Korea is not currently limited by chilling accumulation.
The results presented here showed that chilling accumulation did not vary with latitude. The distribution of temperature can be influenced by the distance to the coast, altitude, and peripheral terrain (Baldocchi and Wong, 2008; Luedeling et al., 2009). Therefore, there is no clear linear trend between the latitude and complex interactions among environmental factors, and any discussion of the chilling accumulation traits or classification of the regions solely by latitude is inadequate.
We hypothesized that global warming will reduce the supply of chilling, and we applied detailed criteria to temperature data to identify regions that would experience the most abrupt decrease in chilling accumulation. The current duration of temperatures <0°C is not effective to break endodormancy, but may become effective under elevated climatic temperature conditions. The current duration of temperatures in the range of 0–3.6°C falls within the effective temperature range and remains effective for a relatively long period, compared to that of temperatures in the range of 3.6–7.2°C, even if the climatic temperature is elevated. In contrast, the duration of temperature in the range of 3.7–7.2°C is currently effective in breaking endodormancy, but it will exceed the effective range faster than that for the range of 0–3.6°C under changed climate conditions. Lastly, the current duration of temperature >7.3°C is not included in the effective range and will further deviate from the effective range under elevated temperature conditions. Thus, the duration of temperature <0°C decreased from group 5 to group 1, whereas the duration of temperature in the range of 3.7–7.2°C increased in that order (Table 1). These results indicate that group 1 will have fewer hours in the effective temperature range starting from a smaller climatic temperature change than group 5, and it will lose more effective temperature hours than group 5 under elevated climatic temperature conditions. Our results showed little change in chilling accumulation for groups 4 and 5 until the temperature increased by 6.0°C, but projected an abrupt decrease in chilling accumulation for groups 1 and 2 (Fig. 4A).
Regions classified as group 1 were mainly located in the southern coastal area of South Korea, while regions of group 5 were situated inland (Fig. 1). Regions classified as groups 2, 3, and 4 were distributed regardless of the costal line or latitude. Baldocchi and Wong (2008) classified the regions of California based on the expected changes in chilling accumulation and they showed that the distribution of each group was scattered without a clear relationship with latitude or longitude. These results suggest that the specific temperature distribution of a region should be determined to identify areas unsuitable for breaking the endodormancy of each cultivar.
Recent studies have emphasized not only the chilling requirement of each cultivar, but also the timing of the chilling period for each cultivation area (Campoy et al., 2012; Kweon et al., 2013). An earlier end and shorter duration of the chilling period means that the endodormancy of woody plants needs to break sooner. If the start of chilling supply is delayed, the endodormancy of most pome fruit trees such as the apple (Malus domestica) and pear (Pyrus communis) will begin later because low temperature induces the initiation of endodormancy of these trees (Davis, 2002; Nitsch, 1957; Song et al., 2010). When endodormancy initiation is delayed, an earlier end of chilling supply will exacerbate the problem of insufficient chilling, owing to the limited duration of chilling accumulation for endodormancy release. Meanwhile, some tree species such as the peach (Prunus persica) and poplar (Populus tremula) have an endodormancy initiated by not only low temperature, but also declining day length (Davis, 2002; Nitsch, 1957; Song et al., 2010). However, since their endodormancy status could be released by chilling accumulation, they are not exempt from insufficient chilling damage due to the earlier end and shortened duration of chilling supply.
In summary, the results of this study can be used as a first-order filter in the selection of plant varieties for future cultivation, to identify areas suitable for cultivation, and to renew existing crops. For example, the chilling requirement of the ‘Hongro’ apple variety is 1500 h (Kweon et al., 2013). When the reported value is substituted into the models used in the present study, the results indicate that the ‘Hongro’ apple would not meet the chilling requirement after temperature increases of 1.4, 3.0, 3.9, 6.3, and 7.6°C in groups 1, 2, 3, 4, and 5, respectively. Therefore, groups 4 and 5 will satisfy the chilling requirement of the ‘Hongro’ apple even if the temperature increased by 6.0°C, which was the maximum value examined in the present study. In contrast, groups 1 and 2 will not be able to satisfy the chilling requirement when temperature increases by 1.4 and 3.0°C, respectively. Considering that the level of temperature increase projected in the RCP 8.5 scenario is 0.7°C per decade, new ‘Hongro’ apple tree should not be planted in group 1 and group 2 regions. If this variety is currently cultivated in these regions, it should be substituted with a variety with a lower chilling requirement.
Already, Midgley and Lötze (2011) reported that growers are transitioning to low chill crops such as grapes. They predict this trend will continue and the use of artificial endodormancy-breaking chemicals will increase in importance. Sunley et al. (2006) evaluated changes in winter chill supply from 1950 to 2002 in different sites in the United Kingdom using the CH and <7.2°C models. They found changes in winter chill over the period 1969–1997 of −10.9% for the CH model and −12.2% for the <7.2°C model. In addition, Else and Atkinson (2010), working in the United Kingdom, anticipated winter chill losses that could endanger the ability of fruit trees to break endodormancy sufficiently.
Additionally, there has been research on changes in winter chill supply in 14 Egyptian regions (Farag et al., 2010), 13 Australian regions (Darbyshire et al., 2011), the Western Cape in South Africa (Midgley and Lötze, 2011), and Brazil (Wrege et al., 2010) and the expected low-temperature supply in all these regions under future climate conditions. The results of this previous research in combination with that here allow the general conclusion to be reached that, for most fruit tree-growing areas analyzed, winter chill is expected to decrease.
In conclusion, until recently, there had been no significant differences in the quantity of chilling supply among the 30 study regions in South Korea. However, winter temperatures are different in each region, and the 30 regions could be categorized into five groups based on winter temperature characteristics. In predicting future chilling accumulation patterns, we found that elevated temperatures induced a delayed start and an earlier end to chilling accumulation, which caused reductions in both quantity and duration of the chilling accumulation essential for the endodormancy release of temperate trees. These reductions in the quantity and duration of chilling accumulation were predicted to be most drastic in groups 4 and 5 and of decreasing severity in groups 3 to 1, in that order. In addition, changes in temporal indicators for the start, end, and duration of chilling supply suggest that the damage caused by insufficient chilling accumulation, as determined by the decrease in quantity of chilling hours only, could intensify. Thus, temperature characteristics and predicted changes in the supply of effective temperatures should be considered in the selection and renewal of cultivated species.