Abstract
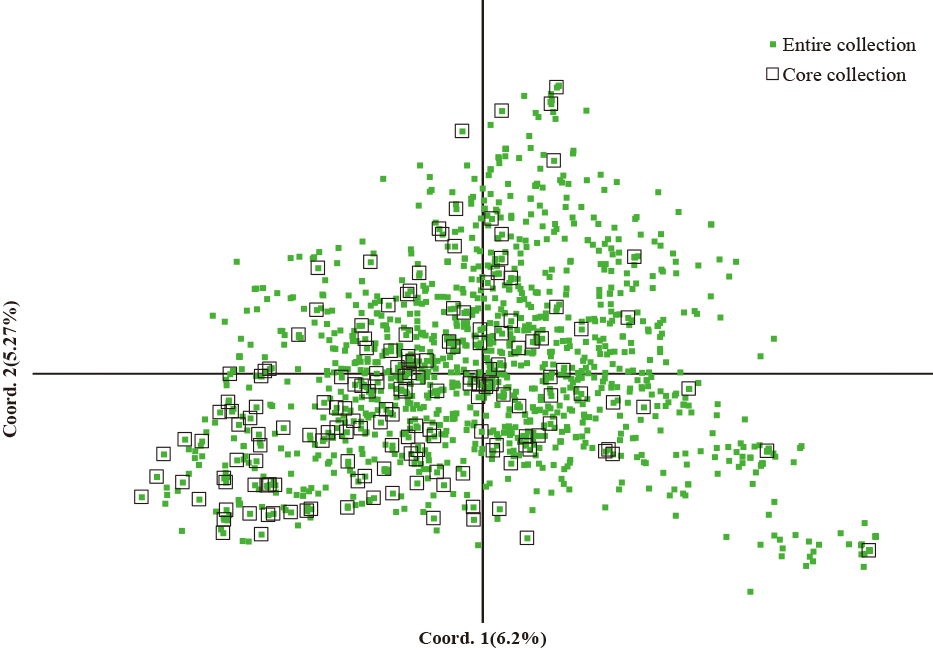
An apple (Malus × domestica Borkh.) core collection was established using 19 SSR markers in 1,344 apple germplasm samples using the PowerCore program. For this, 166 accessions were selected using a heuristic strategy, accounting for about 12.4% of the entire collection. The core collection had an allelic loci retention ratio of 100%, and no significant differences were observed in the number of alleles, Shannon’s information index, observed heterozygosity, expected heterozygosity, major allele frequency, or polymorphic information content between the core and the entire collection, as indicated by t-tests and Levene’s test. Analysis of molecular variance also revealed no significant genetic variation between the core and the entire collection. For all apple accessions, the genetic relationship, assessed using neighbor-joining analysis, was divided into five clusters, and the population structure had the highest value at k = 2. The first two axes in the principal coordinate analysis accounted for 14.00% and 9.85% of the total variance, and the core collection was distributed in a scattered pattern across the plot of the entire collection. The 166-apple core set constructed here is recommended for use as the core collection for the Korean apple germplasm.
Introduction
The apple (Malus × domestica Borkh.) is one of the most important cultivated fruit trees in the world (Hummer and Janick, 2009). More than 10,000 apple varieties are known to exist, but only a few commercial cultivars dominate worldwide fruit production (Janick and Moore, 1996). Apple germplasm collections are an important resource for apple breeding and research, enabling increases in genetic diversity and the development of target traits (Potts et al., 2012). With continuous effort at collection and selection, more than 1,400 accessions of apple germplasm have now been preserved in Korea. However, as the size of the germplasm collection increases, this continuous collection of genetic resources will be difficult to preserve, evaluate, and manage.
To solve this problem, Frankel et al. (1984) proposed the “core collection” concept. A core collection is defined as a representative sample of the entire collection, with minimum repetitiveness and maximum genetic diversity, of a crop species and its relatives. An efficient core collection must be smaller than the original collection and contain 5%–20% of the accessions present in the entire germplasm collection with no redundant entries (Brown, 1989; van Hintum et al., 2000; Wang et al., 2011; Yonezawa et al., 1995). Currently, the development of a core collection is regarded as fundamental in the evaluation, management, and use of plant germplasm. Numerous methods have been proposed to form core collections using passport data, along with morphological and molecular data, to maximize genetic diversity. By using these methods, core collections have been constructed for many crops, such as peach (Li et al., 2008), persimmon (Zhang et al., 2009b), rice (Zhang et al., 2011), apricot (Wang et al., 2011), olive (Belaj et al., 2012), litchi (Sun et al., 2012), adzuki beans (Wang et al., 2012), coffee (Leroy et al., 2014), and apple (Liang et al., 2015).
Previously, the construction of a core collection using a molecular marker was one of the strategies used to represent the entire genetic diversity available (Brown, 1989, 1995; Frankel, 1984; Marshall, 1990). Among the many types of molecular markers, the use of SSR markers has proven to be critical in the evaluation of genetic diversity and to determine genetic relatedness (Baraket et al., 2011; Chen et al., 2010; Liang et al., 2015; Potts et al., 2012; Yamasaki and Ideta, 2013). SSRs, also known as microsatellites, are short DNA fragments widely dispersed throughout eukaryotic genomes, and are often highly polymorphic due to variations in the number of repeat units, rendering them ideal for genetic diversity studies (Potts et al., 2012; Song et al., 2014; Yamamoto et al., 2001). To date, SSR markers have been widely used in the construction of apple core collections and have proven to be a useful tool for identifying genetic diversity (Yamamoto et al., 2001). Recently, core collections have been constructed for Malus accessions, such as hybrids and domesticated apples, and wild and domesticated apples (Gharghani et al., 2009; Liang et al., 2015; Potts et al., 2012; Zhang et al., 2009a, 2010). However, there is a lack of research on the genetic diversity, relationship, and structure of the Korean apple germplasm. Moreover, construction of core collections and studies on the usefulness of the developed core collections are insufficient.
The goal of this study was to investigate the genetic diversity and relatedness of a large collection of the Korean apple germplasm and to establish a core collection of Malus based on the polymorphism revealed by the SSRs.
Materials and Methods
Plant materials and DNA extraction
In total, 1,344 Malus accessions collected from the Apple Research Institution at the National Institute of Horticultural & Herbal Science in Korea (lat. 36°16'37.9" N, long. 128°27'59.0" E) were used in this study. The 1,344 apple germplasm samples used in this study are shown in Supplemental Table 1. Total genomic DNA was extracted from young fresh leaves using a Gentra Puregene Cell Kit for Plants (Qiagen, Valencia, CA, USA) according to the manufacturer’s instructions. The quality and concentration of extracted DNA were analyzed with a NanoDrop ND-1000 spectrometer (NanoDrop Technologies, Wilmington, DE, USA), and the extracted DNA was diluted to a final working concentration of 20 ng·μL−1.
Initial screening and choice of SSR markers
In this study, 15 published SSRs and 51 SSRs (unpublished) developed by Kyungpook National University were used for preliminary screening of polymorphic markers using 10 apple accessions. Eleven of 15 published SSRs and eight of 51 developed SSRs had good amplification and high levels of polymorphism. In total, 19 SSR markers, which were distributed over 17 linkage groups, were selected for evaluation of the apple germplasm. Details of the 19 SSR markers are shown in Table 1.
PCR and detection of PCR products
PCR reactions were performed in a total volume of 20 μL with a reaction mixture containing 40 ng of genomic DNA, 10 pmol of each fluorescent dye-labeled primer, 2 μL of 10× h-Taq PCR buffer (Solgent, Daejeon, Korea), 1.6 μL of dNTP mix (2.5 mm), and 0.3 μL of Taq polymerase (2.5 U·μL−1; Solgent). PCR was performed as follows: 3 min of initial denaturation at 94°C, then 30 cycles at 94°C for 30 s, 50 to 60°C for 20 s, and 72°C for 1 min, followed by a final extension at 72°C for 10 min in a PTC-200 thermocycler (MJ Research, Waltham, MA, USA). Amplified fluorescence-labeled PCR products were resolved on a ABI 3130x1 Genetic Analyzer (Applied Biosystems, Foster City, CA, USA) and sized precisely at the base-pair level using an internal size standard (35–500 bp, GeneScan 500 ROX; Applied Biosystems). Fragments were sized and scored into alleles using GeneMapper ver. 4.0 software (Applied Biosystems).
Genetic diversity analysis
To evaluate the genetic diversity within the apple germplasm, we used PowerMarker v 3.25 software (Liu and Muse, 2005) to assess the number of alleles (Na), observed heterozygosity (Ho), expected heterozygosity (He), major allele frequency (MAF), and polymorphism information content (PIC); and GenAlEx v 6.501 (Peakall and Smouse, 2012) to assess the number of effective alleles per locus (Ne), Shannon’s diversity index (I), and Wright’s fixation index (F).
Construction and characterization of the core collection
Based on the distribution of SSR alleles in the conserved apple germplasm, we constructed a core collection with a heuristic algorithm implemented in PowerCore software v 1.0 (Kim et al., 2007). There were two options: a random or non-random mode for analysis. Both modes were run to construct the core collection, with the latter one being selected, as the number of alleles was maximized with the least redundancy in the SSR data set. To investigate the genetic differences and similarities between the entire collection and the core collection, t-tests were conducted using Microsoft Excel software and Levene’s test using R version 3.2.3 statistical software. Correlations of MAF and Shannon’s diversity index between the entire collection and core collection were estimated separately using Microsoft Excel software. To assess the distribution of gene diversity and estimate the components of the population variances, analysis of molecular variance (AMOVA) based on a co-dominant genotypic was computed based on 10,000 bootstraps using GenAlEx v 6.5.
Cluster analysis and principal coordinate analysis
To reveal the genetic relationships among accessions, a neighbor-joining tree was constructed based on genetic distances obtained by the chord distance function of the neighbor-joining method using PowerMarker v 3.25 software and visualized with TreeView v 1.6.6 software. Principal coordinate analysis (PCoA) was performed using GenAlEx v 6.5 software to identify the distribution of the genetic diversity of the core collection in the entire collection.
Population structure
A model-based Bayesian clustering method was applied to infer genetic structure and define the number of clusters in the dataset using Structure v.2.3.4 software (Pritchard et al., 2000). Estimation of allele frequencies in the presumed number of clusters (k) was simulated based on the independent allele frequency model using a Markov Chain Monte Carlo (MCMC) method. Independent runs were performed by setting the number of clusters (k) from one to 11. The degree of admixture in each accession was estimated under the conditions of 200,000 burn-in length and 1,000,000 MCMC replications. An ad hoc statistic Δk based on the rate of change in the log probability of data between successive k values, as described by Evanno et al. (2005), was calculated using the Structure Harvester v.0.9.93 website (Earl and vonHoldt, 2012), and used to estimate the most likely number of clusters (k).
Results
Genetic diversity of the entire collection
Nineteen SSR loci were employed to identify polymorphic genotypes among 1,344 apple accessions. In total, 430 alleles were identified, ranging from four at Chr13-0020 to 52 at CH04f10, with an average allelic richness of 22.6 alleles per locus. The number of effective alleles (Ne) varied between 1.8 at Chr14-0051 and 11.4 at CH04f10, with an average of 4.93. The major allele frequency (MAF) ranged from 0.176 at CH04f10 to 0.713 at Chr10-0051, with an average of 0.407 per locus. The lowest and highest expected heterozygosity (He) values were 0.439 and 0.912 for Chr14-0051 and Ch04f10, respectively, with an average of 0.721. The observed heterozygosity (Ho) values varied from 0.297 to 0.904 for Chr10-0018 and CH01f03, respectively, with an average of 0.603. Shannon’s diversity index (I) values per locus ranged from 0.700 to 2.802 for Chr13-0020 and CH04f10, respectively, with an average of 1.758. In polymorphic information contents (PIC), 14 of 19 SSR markers were highly polymorphic (PIC > 0.5), ranging from 0.626 at GD12 to 0.906 at CH04f10. For Wright’s fixation index (F) values, higher values of Ho than He observed in 2 loci (Chr17-0014 and CH01f03b) resulted in negative values. For the remaining 17 loci, the F values were positive. The diversity parameters for the 19 SSR markers analyzed in the entire collection are summarized in Figure 1.

The apple core collection was constructed using 1,344 accessions and 430 alleles of the 19 SSR loci with POWERCORE 1.0 (Kim et al., 2007). As a result, the 166 accessions selected for the core collection accounted for approximately 12.4% of the entire collection. All of the genetic diversity parameters (Na, Ne, I, Ho, He, F, MAF, and PIC) of the core collection were calculated and are shown in Figure 1.
Comparison of genetic diversity between the entire and core collections
The core collection had an allelic loci (Na) retention ratio of 100% and the mean values of Ne, I, Ho, He, F, and PIC for the core collection were greater than those for the entire collection (Fig. 1). No significant differences were observed for Ne, I, Ho, He, F, MAF, and PIC between the core collection and the entire collection, as indicated by t-tests for equality of means and Levene’s test for equality of variance (Table 2). Moreover, Shannon’s diversity index (I) and major allele frequency (MAF) between the core collection and the entire collection were very highly correlated R2 = 0.9825 and R2 = 0.9538, respectively (Fig. 2). Analysis of molecular variance (AMOVA) revealed the distribution of molecular genetic variation between the core collection and the entire collection (Table 3). Approximately 1.4% of the total molecular variation was attributed to genetic differences between the core and entire collections, whereas more than 98.6% of the total molecular variation was attributed to genetic differences within the accession. The genetic differences between the core collection and the entire collection were also assessed using pairwise PhiPT. The PhiPT value generated by GenAlEx showed that no significant differences existed between the two collections (PhiPT = 0.014, P = 0.0001).

The genetic relationship among 1,344 apple accessions was classified into five clusters (Fig. 3). These five clusters contained 217, 86, 717, 219, and 105 accessions, respectively. The core collection was evenly distributed with 35, 13, 63, 27, and 28 accessions over these same five clusters. The genetic diversity of the core and the entire collection was assessed by principal coordinate analysis (PCoA). The core collection and the entire collection were found to be distributed in a scattered pattern across the plot (Fig. 4). The first two axes of the PCoA analysis based on genetic distances showed that 19 SSRs accounted for 14.00% and 9.85% of the total variance, respectively. The PCoA results therefore provided more evidence of the relationship among the different accessions.
Population structure of the apple germplasm
The population structure of the entire collection was analyzed based on the Bayesian clustering approach using STRUCTURE v.2.3.4 software (Pritchard et al., 2000). The structure harvester plotted the ΔK value against the K numbers of the sub-groups. The ΔK statistic gave the highest value at k = 2 (Δk = 862.2), although a minor peak of Δk was also found at k = 5 (Δk = 6.8) (Fig. 5). The results of the Bayesian STRUCTURE analysis identifying genetic groupings are shown in Figure 6. When considering k = 2, the entire collection was divided into two groups and gene pools were admixed. If K is 2, Group 1 includes Fuji and Golden Delicious, and Group 2 includes Orin and Yoko.
Discussion
This study used 19 SSR markers to analyze the genetic diversity and population structure of a Korean apple germplasm. A comprehensive assessment of genetic diversity in the core collection selection was revealed by the high number of polymorphic markers covering a wide genome range. Genetic markers with a high level of polymorphism are critical for use in finger-printing and core collection selection. The 19 SSR markers that we selected covered the entire apple chromosome complement and showed a high level of polymorphism for 14 of the 19 SSRs (PIC > 0.5). Overall, a high level of PIC, Ho, and He was observed in this Korean apple germplasm, as has been reported in previous studies (Hokanson et al., 2001; Kitahara et al., 2005; Liang et al., 2015; Potts et al., 2012; Zhang et al., 2011). In the entire and core collections, most loci showed positive F values. The F value is the mean reduction in heterozygosity of an individual due to non-random mating within a subpopulation and can range from −1 (all individuals heterozygous) to +1 (no observed heterozygotes) (Wright, 1978). The F value in our study (mean 0.161 and 0.220 in the entire and core collections, respectively) contrasted with those determined by Larsen et al. (2006) (F = −0.002) and Pereira-Lorenzo et al. (2007) (−0.088). However, our result was similar to those obtained by Coart et al. (2003) (F = 0.105) and Gharghani et al. (2009) (F = 0.197). Bruford et al. (1998) reported that positive fixation index values are often caused by the presence of null alleles. In our study, null alleles were found in all loci. A more plausible reason for the shortage of heterozygotes could be non-random mating in both the wild Malus species and the domesticated accessions, potentially leading to the Wahlund effect (Lowe et al., 2004).
The Korean Apple Research Institute preserves approximately 1,400 apple accessions; this requires significant effort and is costly. Moreover, the large size of the accession restricts its accessibility and application (Brown, 1989; Noirot et al., 1996; van Hintum et al., 2000). Therefore, it is important to select and manage a core collection that can represent the entire collection.
Currently, various methods have been implemented to develop core collections for many plants that can represent the maximum genetic diversity of the entire collection with minimal accessions (Franco et al., 2006; Gouesnard et al., 2001; Ortiz et al., 1998; Wang et al., 2007; Xu et al., 2016a, b). In this study, a heuristic approach, using POWERCORE software, captured 100% of the alleles existing in the entire collection, with a threshold of approximately 12.4%. It is important to determine the sampling percentage of the ideal core collection to enable effective utilization (Brown and Spillane, 1999). Brown (1989) reported that the proportion of core collection sampling should be about 10% of the entire collection, which retains more than 70% of the alleles in the entire collection. In contrast, Yonezwa et al. (1995) proposed that the optimal proportion of the core collection should be 20%–30%, while van Hintum et al. (2000) pointed out that most collections that have been constructed contain 5%–20% of the accessions conserved in the entire collection. Wang et al. (2011) also reported the percentage sampling of the core collection was generally 10%–30% in several crop species. Li et al. (2003) pointed out that the ideal sampling size for the core collection is defined by the size of the entire collection.
The ideal core collection is one that maximizes the total genetic diversity in the core, while representing the various parameter values of the entire collection (Frankel, 1984; Marita et al., 2000). According to Odong et al. (2013), maximizing the representativeness of genetic diversity signifies the inclusion of widely adapted and heterotic materials containing “generalist” alleles in a core collection. In this study, a genome-wide set of SSRs, which were located on 17 chromosomes, was used to provide a comprehensive evaluation of the genome of the Korean apple germplasm. To validate the representativeness of a core collection, suitable parameters are required to evaluate the representative core collection to ensure genetic diversity (Wang et al., 2007). In this study, the core collection retained 100% of the allelic loci of the entire collection, and the core collection was validated using a t-test to assess the equality of the means, while Levene’s test was used to assess the equality of variance in Ne, I, Ho, He, MAF, and PIC, with the data showing that the core collection and the entire collection were not significantly different (P > 0.05). Shannon’s diversity index (I) and the major allele frequency (MAF) also showed a strong correlation between the core collection and the entire collection, and the PCoA results confirmed the representativeness of the core collection. AMOVA between the core collection and the entire collection showed only a 1.4% change, with 98.6% of the variation occurring within the accessions; thus, most of the genetic variability of the entire collection was maintained in the core collection, and there was no significant difference between the core and entire collections.
Wada et al. (2017) used a cluster analysis and showed that core collection accessions could be selected almost evenly from different clusters to cover the genetic diversity of an entire collection. In this study, all of the core collection accessions were evenly distributed across five clusters. The 1,344 Korean apple germplasm samples could be divided into two groups at k = 2. Similar results were reported by Liang et al. (2015) and Larsen et al. (2006). Using the secondary peaks at k = 5, the entire collection could be divided into five groups. Moreover, admixture at this level was similar to the results for the genetic relationship using the neighbor-joining method. Both cluster and structure analyses have been found to be useful to analyze the genetic relationships of germplasms (Beaumont et al., 2001; Goossens et al., 2002). Wu et al. (2010) suggested that genetic structure analysis combined with cluster analysis can categorize groups from complex populations with no obvious genetic differentiation or from different groups with large amounts of genetic flow between them.
In the present study, we confirmed the possibility of creating a core Korean apple collection that could represent the entire collection. All of the parameters examined confirmed that the methodology used to construct the core collection were appropriate because the genetic diversity present in the core collection was maintained. In this regard, the core collection developed in this study may already fully cover the genetic diversity of the Korean apple germplasm. The information generated in this study could therefore be useful in managing the Korean apple germplasm and constructing other core sets for agriculturally useful traits.
Literature Cited
- Baraket, G., K. Chatti, O. Saddoud, A. B. Abdelkarim, M. Mars, M. Trifi and A. S. Hannachi. 2011. Comparative assessment of SSR and AFLP markers for evaluation of genetic diversity and conservation of fig, Ficus carica L., genetic resources in Tunisia. Plant Mol. Biol. Rep. 29: 171–184.
- Beaumont, M., E. M. Barratt, D. Gottelli, A. C. Kitchener, M. J. Daniels, J. K. Pritchard and M. W. Bruford. 2001. Genetic diversity and introgression in the Scottish wildcat. Mol. Ecol. 10: 319–336.
- Belaj, A., M. D. Dominguez-García, S. G. Atienza, N. M. Urdíroz, R. De la Rosa, Z. Satovic, A. Martín, A. Kilian, I. Trujillo, V. Valpuesta and C. Del Río. 2012. Developing a core collection of olive (Olea europaea L.) based on molecular markers (DArTs, SSRs, SNPs) and agronomic traits. Tree Genet. Genomes 8: 365–378.
- Brown, A. H. D. 1989. Core collection: a practical approach to genetic resources management. Genome 31: 818–824.
- Brown, A. H. D. 1995. The core collection at the crossroads, p. 3–19. In: T. Hodgkin, A. H. D. Brown, T. J. L. van Hintum and E. A. V. Morales (eds.). Core collections of plant genetic resources. John Wiley and Sons Inc., Chichester.
- Brown, A. H. D. and C. Spillane. 1999. Implementing core collections—principles, procedures, progress, problems and promise, p. 1–10. In: R. C. Johnson and T. Hodgkin (eds.). Core collections for today and tomorrow. Crop Sci., Madison.
- Bruford, M. W., C. Ciofi and S. M. Funk. 1998. Characteristics of microsatellites, p. 202–205. In: A. Karp, P. G. Isaac and D. S. Ingram (eds.). Molecular tools for screening Biodiversity. Chapman and Hall, London.
- Chen, X., Z. Xia, Y. Fu, C. Lu and W. Wang. 2010. Constructing a genetic linkage map using an F1 population of non-inbred parents in Cassava (Manihot esculenta Crantz). Plant Mol. Biol. Rep. 28: 676–683.
- Coart, E., X. Vekemans, M. J. M. Smulders, I. Wagner, J. Huylenbroeck, E. Bockstaele and I. Roldán-Ruiz. 2003. Genetic variation in the endangered wild apple (Malus sylvestris (L.) Mill.) in Belgium as revealed by amplified fragment length polymorphism and microsatellite markers. Mol. Ecol. 12: 845–857.
- Earl, D. A. and B. M. vonHoldt. 2012. STRUCTURE HARVESTER: a website and program for visualizing STRUCTURE output and implementing the Evanno method. Conserv. Genet. Resour. 4: 359–361.
- Evanno, G., S. Regnaut and J. Goudet. 2005. Detecting the number of clusters of individuals using the software structure: a simulation study. Mol. Ecol. 14: 2611–2640.
- Franco, J., J. Crossa, M. L. Warburton and S. Taba. 2006. Sampling strategies for conserving maize diversity when forming core subsets using genetic markers. Crop Sci. 46: 854–864.
- Frankel, O. H. 1984. Genetic perspectives of germplasm conservation, p. 161–170. In: W. Arber, K. Illmensee, W. J. Peacock and P. Starlinger (eds.). Genetic manipulation: Impact on man and society. Cambridge Univ. Press, Cambridge.
- Gharghani, A., Z. Zamani, A. Talaie, N. C. Oraguzie, R. Fatahi, H. Hajnajari, C. Wiedow and S. E. Gardiner. 2009. Genetic identity and relationships of Iranian apple (Malus × domestica Borkh.) cultivars and landraces, wild Malus species and representative old apple cultivars based on simple sequence repeat (SSR) marker analysis. Genet. Resour. Crop Evol. 56: 829–842.
- Goossens, B., S. M. Funk, C. Vidal, S. Latour, A. Jamart, M. Ancrenaz, E. J. Wickings, C. E. G. Tutin and M. W. Bruford. 2002. Measuring genetic diversity in translocation programmes: principles and application to a chimpanzee release project. Anim. Conserv. 5: 225–236.
- Gouesnard, B., T. M. Bataillon, G. Decoux, C. Rozale, D. J. Schoen and J. L. David. 2001. MSTRAT: An algorithm for building germplasm core collections by maximizing allelic or phenotypic richness. J. Hered. 92: 93–94.
- Hokanson, S. C., W. F. Lamboy, A. K. Szewc-McFadden and J. R. McFerson. 2001. Microsatellite (SSR) variation in a collection of Malus (apple) species and hybrids. Euphytica 118: 281–294.
- Hummer, K. E. and J. Janick. 2009. Rosaceae: taxonomy, economic importance, genomics, p. 1–17. In: Genetics and genomics of Rosaceae. Springer, New York.
- Janick, J. and J. M. Moore. 1996. Fruit breeding, tree and tropical fruits. John Wiley & Sons, Inc., New York.
- Kim, K. W., H. K. Chung, G. T. Cho, K. H. Ma, D. Chandrabalan, J. G. Gwag, T. S. Kim, E. G. Cho and Y. J. Park. 2007. PowerCore: a program applying the advanced M strategy with a heuristic search for establishing core sets. Bioinformatics 23: 2155–2162.
- Kitahara, K., S. Matsumoto, T. Yamamoto, J. Soejima, T. Kimura and H. Komatsu. 2005. Molecular characterization of apple cultivars in Japan by S-RNase analysis and SSR markers. J. Amer. Soc. Hort. Sci. 130: 885–892.
- Larsen, A. S., C. B. Asmussen, E. Coart, D. C. Olrik and E. D Kjær. 2006. Hybridization and genetic variation in Danish populations of European crab apple (Malus sylvestris). Tree Genet. Genomes 2: 86–97.
- Leroy, T., F. De Bellis, H. Legnate, P. Musoli, A. Kalonji, R. G. Loor Solórzano and P. Cubry. 2014. Developing core collections to optimize the management and the exploitation of diversity of the coffee Coffea canephora. Genetica 142: 185–199.
- Li, T. H., Y. X. Li, Z. C. Li, H. L. Zhang, Y. W. Qi and T. Wang. 2008. Simple sequence repeat analysis of genetic diversity in primary core collection of peach (Prunus persica). J. Integr. Plant Biol. 50: 102–110.
- Li, Z. C., H. L. Zhang, Y. S. Cao, Z. E. Qiu, X. H. Wei, S. X. Tang, P. Yu and X. K. Wang. 2003. Studies on the sampling strategy for primary rice. Acta Agron. Sin. 29: 20–24.
- Liang, W., L. Dondini, P. De Franceschi, R. Paris, S. Sansavini and S. Tartarini. 2015. Genetic diversity, population structure and construction of a core collection of apple cultivars from Italian germplasm. Plant Mol. Biol. Rep. 33: 458–473.
- Liu, K. and S. V. Muse. 2005. PowerMarker: An integrated analysis environment for genetic marker analysis. Bioinformatics 21: 2128–2129.
- Lowe, A., S. Harris and P. Ashton. 2004. Ecological genetics; design, analysis and application. Blackwell publishing, Oxford.
- Marita, J. M., J. M. Rodriguez and J. Nienhuis. 2000. Development of an algorithm identifying maximally diverse core collections. Genet. Resour. Crop Evol. 47: 515–526.
- Marshall, D. 1990. Crop genetic resources: current and emerging issues, p. 367–388. In: A. H. D. Brown, M. H. Clegg, A. L. Kahler and B. S. Weir (eds.). Plant population genetics, breeding, and genetic resources. Wiley, Chichester.
- Noirot, M., S. Hamon and F. Anthony. 1996. The principal component scoring: a new method of constituting a core collection using quantitative data. Genet. Resour. Crop Evol. 43: 1–6.
- Odong, T. L., J. Jansen, F. A. van Eeuwijk and T. J. L. van Hintum. 2013. Quality of core collections for effective utilisation of genetic resources review, discussion and interpretation. Theor. Appl. Genet. 126: 289–305.
- Ortiz, R., E. N. Ruiz-Tapia and A. Mujica-Sanchez. 1998. Sampling strategy for a core collection of Peruvian quinoa germplasm. Theor. Appl. Genet. 96: 475–483.
- Peakall, R. and P. E. Smouse. 2012. GenAlEx 6.5: Genetic analysis in Excel. Population genetic software for teaching and research an update. Bioinformatics 28: 2537–2539.
- Pereira-Lorenzo, S., A. M. Ramos-Cabrer and M. B. Diaz-Hernandez. 2007. Evaluation of genetic identity and variation of local apple cultivars (Malus × domestica Borkh.) from Spain using microsatellite markers. Genet. Resour. Crop Evol. 54: 405–420.
- Potts, S. M., Y. Han, M. A. Khan, M. M. Kushad, A. L. Rayburn and S. S. Korban. 2012. Genetic diversity and characterization of a core collection of Malus germplasm using simple sequence repeats (SSRs). Plant Mol. Biol. Rep. 30: 827–837.
- Pritchard, J. K., M. Stephens and P. Donnelly. 2000. Inference of population structure using multilocus genotype data. Genetics 155: 945–959.
- Song, Y., L. Fan, H. Chen, M. Zhang, Q. Ma, S. Zhang and J. Wu. 2014. Identifying genetic diversity and a preliminary core collection of Pyrus pyrifolia cultivars by a genome-wide set of SSR markers. Sci. Hortic. 167: 5–16.
- Sun, Q., L. Bai, L. Ke, X. Xiang, J. Zhao and L. Ou. 2012. Developing a core collection of litchi (Litchi chinensis Sonn.) based on EST-SSR genotype data and agronomic traits. Sci. Hortic. 146: 29–38.
- van Hintum, T. J. L., A. H. D. Brown, C. Spillane and T. Hodgkin. 2000. Core collections of plant genetic resources. IPGRI Technical Bulletin No. 3. IPGRI, Rome, IT.
- Wada, T., Y. Noguchi, S. Isobe, M. Kunihisa, T. Sueyoshi and K. Shimomura. 2017. Development of a core collection of strawberry cultivars based on SSR and CAPS marker polymorphism. Hort. J. 86: 365–378.
- Wang, J. C., J. Hu, H. M. Xu and S. Zhang. 2007. A strategy on constructing core collections by least distance stepwise sampling. Theor. Appl. Genet. 115: 1–8.
- Wang, L. X., X. Z. Cheng, S. H. Wang and J. Tian. 2012. Analysis of an applied core collection of adzuki bean germplasm by using SSR markers. J. Integr. Agric. 11: 1601–1609.
- Wang, Y., J. Zhang, H. Sun, N. Ning and L. Yang. 2011. Construction and evaluation of a primary core collection of apricot germplasm in China. Sci. Hortic. 128: 311–319.
- Wright, S. 1978. Variability within and among natural populations, vol 4. The Univ. Chicago Press, Chicago.
- Wu, C. L., Q. Q. Zhang, B. X. Dong, S. F. Li and C. Q. Zhang. 2010. Analysis of genetic structure and genetic relationships of partial maize inbred lines in China. Acta Agronomica Sinica 36: 1820–1831.
- Xu, C., J. Gao, Z. Du, D. Li, Z. Wang, Y. Li and X. Pang. 2016a. Identifying the genetic diversity, genetic structure and a core collection of Ziziphus jujuba Mill. var. jujuba accessions using microsatellite markers. Sci. Rep. 6: 31503. DOI: 10.1038/srep31503.
- Xu, Y., C. Chen, D. Ji, K. Xu, X. Xie and C. Xie. 2016b. Developing a core collection of Pyropia haitanensis using simple sequence repeat markers. Aquaculture 452: 351–356.
- Yamamoto, T., T. Kimura, T. Sawamura, K. Kotobuki, Y. Ban, T. Hayashi and M. Matsuta. 2001. SSRs isolated from apple can identify polymorphism and genetic diversity in pear. Theor. Appl. Genet. 102: 865–870.
- Yamasaki, M. and O. Ideta. 2013. Population structure in Japanese rice population. Breeding Science 63: 49–57.
- Yonezawa, K., T. Nomura and H. Morish. 1995. Sampling strategies for use in stratified germplasm collection, p. 35–53. In: T. Hodgkin, A. H. D. Brown and T. J. L van Hintum (eds.). Core collection of plant genetic resources. John Wily and Sons, Chichester.
- Zhang, C. Y., X. S. Chen, Y. M. Zhang, Z. H. Yuan, Z. C. Liu, Y. L. Wang and Q. Lin. 2009a. Method of constructing core collection for Malus sieversii in Xinjiang, China using molecular markers. Agric. Sci. China 8: 276–284.
- Zhang, J., Y. Wang, X. Zhang, T. Li, K. Wang, X. Xu and Z. Han. 2010. Sampling strategy to develop a primary core collection of apple cultivars based on fruit traits. Afr. J. Biotechnol. 9: 123–127.
- Zhang, P., J. Li, X. Li, X. Liu, X. Zhao and Y. Lu. 2011. Population structure and genetic diversity in a rice core collection (Oryza sativa L.) investigated with SSR markers. PLoS ONE 6: e27565. DOI: 10.1371/journal.pone.0027565.
- Zhang, Q., L. Li, Y. Zhao, S. Korban and Y. Han. 2011. Evaluation of genetic diversity in Chinese wild apple species along with apple cultivars using SSR markers. Plant Mol. Biol. Rep. 30: 539–546.
- Zhang, Y. F., Q. L. Zhang, Y. Yang and Z. R. Luo. 2009b. Development of Japanese persimmon core collection by genetic distance sampling based on SSR markers. Biotechnol. Biotec. Eq. 23: 1474–1478.