Abstract
Male sterility is defined as the loss of pollen fertility, and it represents a plant reproductive isolation symptom, along with self-incompatibility. It plays an important role in the efficient production of F1-hybrid seeds, which results in affordable seed prices for farmers. Male sterile cultivated strawberry Fragaria × ananassa Duch. plants were found in an F1 population and reciprocal backcrossed populations derived from a cross between ‘Fukuoka S6’ and ‘Kaorino’. Male sterile plants were clearly distinguished from male fertile plants in those populations based on the anther color. The pollen of the male sterile plants was a lighter yellow color and not maturely shaped compared with pollen of male fertile plants. Genotyping was performed using EST-SSR markers in the three populations. Quantitative trait locus analyses for pollen fertility were conducted independently using three kinds of populations, and this revealed that male sterility was controlled by three independent chromosomal regions in these populations, which corresponded to chromosome 4 in the wild strawberry (Fragaria vesca) genome. One region was derived from ‘Fukuoka S6’ and the other two regions from ‘Kaorino’. The segregation patterns of fertile and sterile plants in each population clearly supported the three gene theory of male sterility in cultivated strawberries. The accumulation of recessive alleles at the three regions led to male sterility, and the existence of a dominant allele in at least one region resulted in fertile pollen. Male sterile plants were also found in two self-pollenated populations derived from ‘Fukuoka S6’ and ‘Kaorino’, and the effects of the three regions were validated. The adaptability levels of the three genes with different genetic backgrounds were also evaluated using core collection cultivars and selected lines derived using recurrent selection. We also detected flanking DNA markers for the three regions associated with male sterility. The use of these markers, which are in the vicinity of quantitative trait loci and responsible for male-sterility, could increase the efficiency of producing seed-propagated strawberry F1-hybrids.
Introduction
Cultivated strawberry (Fragaria × ananassa Duch.) is an important fruit species in Japan and worldwide. The total value of cultivated strawberry is 170 billion JPY in Japan (MAFF 2017, http://www.maff.go.jp/j/tokei/kouhyou/nougyou_sansyutu/index.html), and this is the highest among total fruit outputs and second highest among vegetable outputs (strawberry is classified as a vegetable in Japanese agricultural statistics). To maintain stable strawberry production, high-quality seedlings are essential. Currently, the seedlings of most vegetables (such as tomato and eggplant) are produced from F1 hybrid seeds derived from a cross between male and female inbred lines (Ito, 2016). However, strawberry seedlings for commercial production are vegetatively propagated using so-called “runners”, not only in Japan, but also worldwide. Vegetative propagation requires more labor and is less cost effective compared with seed propagation. Furthermore, the transmission of diseases and insects through the use of runners is a severe problem in vegetative propagation. As a result, strawberry farmers must use large amounts of pesticides and fungicides to prevent diseases and insects from spreading. Therefore, the development of a seed-propagated strawberry cultivar is required.
In the 21st century, such seed-propagated strawberry cultivars have been developed. ‘Elan’ and ‘Milan’ were developed by Bentvelsen et al. (1997) in the Netherlands. In Japan, Ishikawa and Maeda (2008) developed ‘Chiba F-1’ and Mori et al. (2015) developed ‘Yotsuboshi’ through a collective collaboration of four institutes. However, the F1-hybrid seeds of these cultivars are produced artificially by crossing by hand. The emasculation of female parental lines and the pollination of male parental lines with female lines are labor intensive. Consequently, the seeds and resulting seedlings are quite expensive.
For cost-effective F1-hybrid seed production, male sterility has been applied in many crop species. Maize has three types (T, S, and C) of male-sterile cytoplasm (Jones, 1937; Rogers and Edwardson, 1952), and subsequent seed production systems using cytoplasmic male sterility (CMS) have been applied for commercial maize seed production. In rice, research on a three-line seed production system using CMS began in the 1970s, and more than 60 types of CMS were found. Some of these types have been used in F1-hybrid seed production mainly in China (De Guzman and Oard, 2019). In onion, S cytoplasm, which causes male-sterility, was identified by Jones and Emsweller (1936) and was applied to F1-hybrid seed production. In addition to CMS, genetic male sterility (GMS) has been found and studied. In China, a hybrid rice production system has been deployed using sterile genetic male lines (Chang et al., 2016). Chen et al. (2006) developed DNA markers linked to a responsible gene for genetic male sterility in sunflower, and De Block et al. (1997) established a genetic male sterility system in wheat. In the genus Fragaria, including the cultivated strawberry F. × ananassa, plants of F. chiloensis are dioecious or trioecious (female, male, and hermaphrodite) (Gambardella and Sánchez, 2016), and female and hermaphrodite plants were classified into male sterile and male fertile plants, respectively. Similarly, female plants of F. virginiana were discovered and their phylogeny studied (Goldberg et al., 2010; Govindarajulu et al., 2013; Spigler and Ashman, 2011; Spigler et al., 2008, 2010; Tennessen et al., 2013, 2016), and Liu et al. (2014) reported that overexpression of the YUCCA6 flavin monooxygenase gene induced male sterility in F. vesca. However, an F1-hybrid seed production system at the commercial level has not been established in cultivated strawberry.
Cultivated strawberry is an alloploid species and has a highly heterozygous octoploid (2n = 8x = 56) genome (Darrow, 1966). The complexities of the cultivated strawberry genome have prevented researchers from detecting quantitative trait loci (QTLs) for important agronomic traits and developing DNA markers closely linked to these traits (Gambardella and Sánchez, 2016). However, in the 21st century, information on Fragaria species’ genomes and DNA markers has been accumulated. Sargent et al. (2009, 2012) reported SSR markers for cultivated strawberry and constructed a linkage map. In Japan, Isobe et al. (2013) also developed EST-SSR markers based on F. vesca ESTs and constructed a linkage map. Shulaev et al. (2011) reported the genome sequence of F. vesca ‘Hawaii 4’, a wild diploid relative of cultivated strawberry. Furthermore, Hirakawa et al. (2014) uncovered the F. × ananassa genomic sequences by focusing on subgenomic structures identified in a comparison with other Fragaria species. Recently, Edger et al. (2019) performed chromosome-scale assembly and annotated the genome of the ‘Camarosa’ cultivar, revealing that the total genome length was ~805 million bp and that cultivated strawberries originated from four different wild strawberries. These previous studies generated useful information about wild strawberry genetics, with implications for the breeding of cultivated strawberry.
The objective of this study was to develop a method for obtaining male-sterile lines of cultivated strawberry to support the establishment of an F1-hybrid seed production system. First, we developed a male-sterile line from a cross between commercial cultivars of cultivated strawberry, and then we detected chromosomal regions responsible for male sterility. Finally, we identified DNA markers located in the vicinity of QTLs associated with male-sterility that are applicable to the efficient selection of male-sterile lines.
Materials and Methods
Plant materials
Five populations derived from ‘Fukuoka S6’, ‘Kaorino’, and ‘MS-2’ were used in this study (Table 1). The populations, named SK_F1, BC1F1_S, and BC1F1_K, were used for the QTL analysis. The population SK_F1, which was composed of 100 plants, was derived from a cross between ‘Fukuoka S6’ (Mitsui et al., 2003) and ‘Kaorino’ (Kitamura et al., 2015). From the SK_F1 population, we selected a male sterility line, ‘MS-2’, as the seed parent line for the subsequent backcrossing. The population BC1F1_S, which was composed of 48 plants, was derived from a cross between ‘MS-2’ and ‘Fukuoka S6’, and the population BC1F1_K, which was composed of 46 plants, was derived from a cross between ‘MS-2’ and ‘Kaorino’. The populations named S1_S and S1_K were used for QTL validation. The population S1_S, which was composed of 93 plants, was generated from the self-pollination of ‘Fukuoka S6’, and the population S1_K, which was composed of 46 plants, was also generated from the self-pollination of ‘Kaorino’.

For the subsequent evaluation of the adaptability of QTLs for male sterility in different genetic backgrounds, ‘MS-2’ was crossed with some of the core collection cultivars (Wada et al., 2017) and selected lines derived from recurrent selection (Table S1). ‘Tochihitomi’ (Ueki et al., 2006), ‘Beni hoppe’ (Takeuchi et al., 1999), and ‘Elsanta’, which originated in the Netherlands, were selected from the core collection cultivars, and ‘85-06a’, ‘29-02b’, and ‘ANF2’, which were developed by combining recurrent selection and selfing (Kataoka and Noguchi, 2016), were also selected. Details of the breeding strategies involving these three lines are shown in Table S1.
Genotyping of populations with SSR markers for QTL analysis
DNA extraction was performed with a DNeasy Plant Mini Kit (Qiagen Inc., Hilden, Germany) using young leaves from the plants. SSR markers used for population genotyping were selected based on a previous study (Isobe et al., 2013) using both parental lines and their descendants, and six F1 plants each from SK_F1, BC1F1_S, and BC1F1_K, were used for selection of polymorphic SSR markers. PCR was performed in a 5-μL reaction volume using 0.6 ng of genomic DNA in 1× PCR buffer (Bioline Reagents Ltd., London, UK), 3 mM MgCl2, 0.08 U of BIOTAQ DNA polymerase (Bioline), 0.8 mM dNTPs, and 0.4 mM of each primer that was post-labeled with fluorescent dyes (Schuelke, 2000). The amplification profile was as follows: 1 cycle of 5 min at 95°C, 30 cycles of 30 s at 95°C, 30 s at 55°C, and 45 s at 72°C, followed by 5 min at 72°C for the final extension. PCR was performed using a TAdvanced 384 thermal cycler (Analytik Jena AG, Thuringia, Germany). The PCR products were separated with an ABI 3730xl fluorescent fragment analyzer (Thermo Fisher Scientific, Waltham, MA, USA), according to the polymorphic fragment sizes of the PCR amplicons. Polymorphisms were investigated using Gene Marker software (Softgenetics LLC., State College, PA, USA), based on the presence or absence of the relevant peak. Because some of the SSR markers were unable to generate marker-specific amplicons, probably due to the addition of the sequence for post labelling, the PCR for those markers was performed in an 8-μL reaction volume that included 1.0 ng of genomic DNA, 4.0 pmol of each primer, and 4 μL of 2 × GoTaq Green master mix (Promega Corporation, Madison, WI, USA). The amplification profile was as follows: 1 cycle of 5 min at 95°C, 30 cycles of 30 s at 95°C, 30 s at 55°C, and 45 s at 72°C, followed by 5 min at 72°C for the final extension. PCR was performed in a PC-818 thermal cycler (ASTEC CO., LTD., Fukuoka, Japan). Amplified products were electrophoresed on 12.0% polyacrylamide non-denatured gels, and gels were stained with GelRed solution (Biotium Inc., Fremont, Canada) based on the manufacturer’s protocol.
In both analyses, we compared the bands in electrophoresis gels and peak sizes during fragment analyses, and signals differing in molecular weight were considered independent dominant markers in the strawberry genome. As a result, we were unable to determine whether different signals were allelic. Therefore, the presence of a signal was scored as genotype ‘1’, while the absence of a signal was scored as genotype ‘0’. Heterozygous genotypes were not used.
Trait evaluation for pollen fertility
The pollen fertility level of the SK_F1 population was evaluated using individual plants derived from crossed seeds and propagated seedlings during the 2012–2013 season (later designated 2012), the 2013–2014 season (2013), and the 2014–2015 season (2014). The crossed seeds’ SK_F1 population was sown on May 10th, 2012 in nursery soil commonly used for vegetable seeds (Takii & Co., Ltd., Kyoto, Japan). Germinated plants were moved to nursery pots (9-cm diameter) containing strawberry nursery soil (Seishin Industry, Fukuoka, Japan) for subsequent growth. Transplanting was performed on September 28th. The amount of applied basal fertilizer was 5:3.8:1.9 g/m2 (N:P2O5:K2O), and additional fertilizer was applied at a rate of 10:11.8:11.3 g·m−2 (N:P2O5:K2O) on October 20th, approximately 30 days after transplantation. Watering and weed growth control were performed as necessary, and there was no artificial lighting during the night. After confirming the flowering of the primary branch, we evaluated pollen fertility based on the anther color as shown in Figure 1. The plants that generated fertile pollen formulated deep, dense yellow-colored anthers (Fig. 1 upper left). On the contrary, the plants that generated sterile pollen formulated light yellow-colored anthers (Fig. 1 upper right). Since these classifications were used as the criteria to differentiate male sterility and fertility in previous studies (Spigler et al., 2008; Goldberg et al., 2010; Spigler and Ashman, 2011; Tennessen et al., 2013), we also classified plant materials based on these criteria. In addition, the pollen of each line was retrieved and stained with 1% aceto-carmine. Fertile pollen reached full maturity and stained red (Fig. 1 lower left), while sterile pollen shrank and did not stain (Fig. 1 lower right). Using the anther color and the extent of pollen staining, all the F1 plants were classified into one of the two types.

Propagation of the clones from each line of the SK_F1 population started in May 2013, with propagated clones being grown according to the method described for 2012. Transplantation occurred on September 24th, 2013. Plant cultivation and the subsequent evaluation of pollen fertility were performed as described for 2012. The experiment in 2014 was conducted in a similar manner to that of 2013. Transplantation occurred on September 24th, 2014. The experiment with clones was conducted with two replications.
The pollen fertility levels of the BC1F1_S, BC1F1_K, S1_K, and S1_S populations were evaluated in the 2015–2016 (2015), 2016–2017 (2016), and 2017–2018 (2017) seasons, respectively. Crossed seeds of the BC1F1_S, BC1F1_K, S1_K, and S1_S populations were sown on May 11th, May 22th, May 22th, and May 25th, respectively, and transplanted on Sep. 17th, Sep. 16th, Sep. 16th, and Sep. 26th, respectively. The cultivation and evaluation of the pollen fertility levels of the four populations were conducted in the same manner as for the SK_F1 population.
The pollen fertility levels of the F2 populations of ‘MS-2’ × ‘Tochihitomi’, ‘MS-2’ × ‘85-06a’, ‘MS-2’ × ‘29-02b’, and ‘MS-2’ × ‘ANF2’ were determined in 2016. That of the F1 population of ‘MS-2’ × ‘Elsanta’ was also determined in 2016. That of the F2 population of ‘MS-2’ × ‘Beni hoppe’ was determined in 2017. Sowing seeds, transplanting seedlings, and cultivation were performed in the above-mentioned manner for 2016 and 2017.
Construction of linkage maps and QTL analysis for pollen fertility
Based on the SSR marker polymorphisms in the SK_F1 population, linkage analysis was performed with JoinMAP4.1 software (Kyazma B. V., Wageningen, the Netherlands). The frequency of recombination between two markers was converted to genetic distance using Kosambi’s map function (Kosambi, 1944), and marker segregation data were converted to relevant scores assuming a ‘HAP1’ (haploid population derived from the F1 of a cross between two fully homozygous diploid parents) mapping population. Out of all SSR markers, those that showed a 1:1 segregation pattern (P < 0.05 based on the chi-square test), were used for the subsequent linkage analysis. Linkage maps of ‘Fukuoka S6’ and ‘Kaorino’ were separately constructed using a two-way pseudo-testcross mapping strategy (Grattapaglia and Sederoff, 1994), and grouped by logarithm of odds (LOD) = 5.0 using the regression mapping module. Interval mapping was performed using MapQTL6 software (Kyazma) with a 5,000-cycle permutation test to detect significant QTLs. The linkage map construction and QTL analysis of the BC1F1_S and BC1F1_K populations were conducted in the same manner as for the SK_F1 population.
Detection of sequences amplified using flanking DNA markers of QTLs for male sterility
Amplicon sizes for fragment analyses using SSR markers frequently fluctuate within several base pairs owing to slight differences in electrophoretic patterns between amplicons and molecular size markers. To detect accurate amplicon sizes resulting from flanking SSR markers of QTLs, target amplicon sequences (Bybee et al., 2011) of ‘Fukuoka S6’ and ‘Kaorino’ were analyzed using a next generation sequencer, MiSeq (Illumina Inc., San Diego, CA, USA), and paired-end reads of 250 bp were obtained. Primer sequences were designed with Primer 3 plus (https://primer3plus.com/cgi-bin/dev/primer3plus.cgi) based on the genome sequence of F. × ananassa FANhybrid_r1.2 (Hirakawa et al., 2014) to include the original forward and reverse primer sequences of the relevant SSR markers. The first PCR was performed with primer pairs that included an adapter sequence for binding the second PCR primer sequence at the 5' ends (Table S2). The second PCR was performed with modified primer pairs containing a flow cell-binding site at the 5' ends in addition to the adapter sequence (Table S3). After a sequence run with MiSeq, reads 1 and 2, which had starting sequences that perfectly matched the original primer sequence, were extracted with fastx_barcode_splitter.pl program (FASTX Toolkit 0.0.14; http://hannonlab.cshl.edu/fastx_toolkit/). Primer regions, regions greater than 251 bp, and low-quality regions, were trimmed using fastx_trimmer (FASTX Toolkit 0.0.14) and sickle ver. 1.33 (http://en.wikipedia.org/wiki/Anterior_nares). After being trimmed, reads 1 and 2 were merged, overlapping by at least 20 bp, using FLASH (https://ccb.jhu.edu/software/FLASH/). Merged fastq files were converted to fasta files using fastq_to_fasta (FASTX Toolkit 0.0.14), and the identification of unique sequences and detection of repeated sequences were performed using R ver 3.5.1 software (https://www.r-project.org/) with the dplyr package (https://cran.r-project.org/web/packages/dplyr/index.html). A set of unique sequences was mapped to the reference data of the cultivated strawberry genome, FAN_iscf00182832.1.fas, to generate a sam file using Bowtie2 ver 2.2.0 https://sourceforge.net/projects/bowtie-bio/files/bowtie2/). The generated sam file was converted to a bam file using samtools ver 0.1.19 44428cd (http://www.htslib.org/) to construct an index file. Amplicon sequences corresponding to specific peaks of SSR markers were detected by comparing sequence reads of amplicons and electrophoretic fragment pattern analysis.
QTL validation for male sterility using self-pollinated populations
S1_K and S1_S populations were used for QTL validation. Based on the QTL analysis, all the lines of both populations were classified into two groups, a “Fertile genotype” and a “Sterile genotype”, using genotype data of SSR markers flanking relevant QTLs. As we mentioned before, the pollen fertility of all the lines was detected. We validated the effectiveness of the detected QTLs by comparing the genotypic and phenotypic data, as well as calculating a consistency rate.
Adaptability of QTLs to different genetic backgrounds
As mentioned above, the F2 and F1 populations were generated using ‘MS-2’ as the seed parent and both core collection cultivars and selected lines from recurrent selection as the pollen parents. Comparisons of genotypic and phenotypic data for these populations were carried out in the same manner as for the S1_K and S1_S populations in the QTL validation.
Results
Phenotypic variation in populations derived from a cross between ‘Fukuoka S6’ and ‘Kaorino’
Male sterile plants harboring sterile pollen were commonly observed in the three mapping populations used for the QTL analysis (Table 1). In total, 12, 10, and 21 plants of the SK_F1, BC1F1_S, and BC1F1_K populations exhibited sterile pollen in flowers, respectively. If recessive homozygous allele(s) were responsible for male sterility, three genes could be expected to be involved in the segregation of pollen fertility in the SK_F1 population. In that case, the expected segregation ratio was 7 (fertile):1 (sterile). In a similar manner, two genes and one gene could be involved in the BC1F1_S and BC1F1_K populations, respectively, and the expected ratios were 3:1 and 1:1, respectively, in each population. These assumptions were also validated using the chi-square test (Table 1).
Male sterile plants also segregated in the S1_K and S1_S populations during QTL validation (Table 1). The segregation patterns of the two populations were estimated to be 15:1 and 3:1, respectively, in the same manner as the materials used for the QTL analysis.
We could not detect any plants in any population that harbored partially fertile pollen. Furthermore, the phenotypic classification of pollen fertility in the SK_F1 population was common from 2012 to 2014.
Linkage map construction and QTL analysis
The linkage map construction and QTL analysis were performed using three kinds of genetic populations independently. Basic information on the linkage analysis is shown in Table 2, and actual linkage maps of the three kinds of populations are shown in Figure S1 (SK_F1 population), S2 (BC1 F1_S population), and S3 (BC1 F1_K population).
1. SK_F1 population
The linkage map of ‘Fukuoka S6’ was composed of 30 linkage groups (LGs) with 171 SSR markers. The total map length was 1,082.6 cM, and the average marker distance was 6.3 cM. The linkage map of ‘Kaorino’ was composed of 27 LGs with 151 SSR markers. The total map length was 1,148.0 cM, and the average marker distance was 7.6 cM. QTLs for male sterility were detected on three regions, two on the ‘Fukuoka S6’ map and one on the ‘Kaorino’ map (Fig. 2). Three QTLs were designated as qMS4.1, qMS4.2, and qMS4.3 because all the primer sequences for the QTLs’ flanking markers (FVES1264_208, FVES1356_207, and FAES0001_284) were derived from chromosome 4 of the wild strawberry F. vesca (Shulaev et al., 2011). qMS4.1, qMS4.2, and qMS4.3 explained 16.3%, 17.8%, and 13.4% of the total phenotypic variance, respectively, and the absence of any flanking marker-associated peak led to male sterility.
2. BC1 F1_S population
The linkage map of ‘MS-2’ was composed of 23 LGs with 59 SSR markers. The total map length was 336.0 cM, and the average marker distance was 5.7 cM. The linkage map of ‘Fukuoka S6’ was composed of 21 LGs with 84 SSR markers. The total map length was 554.0 cM, and the average marker distance was 6.6 cM. QTLs for male sterility were detected on two regions, both located on the ‘Fukuoka S6’ map. No associated QTLs were detected on the ‘MS-2’ map (Fig. 3). Because the flanking markers of the two QTLs (FVES1264 and FVES1356) were also detected in the SK_F1 population, we compared waveforms of the fragment analysis between the populations and confirmed that the QTLs on LG1 and LG21 of the ‘Fukuoka S6’ map were identical to qMS4.2 and qMS4.1, respectively, although the amplicon sizes of the flanking markers were slightly different. Consequently, the two QTLs were named qMS4.1 and qMS4.2 to correspond with those of the SK_F1 population. qMS4.1 and qMS4.2 explained 27.5% and 22.3% of the total phenotypic variance, respectively, and the absence of either flanking marker-associated peak led to male sterility, similar to the findings for the SK_F1 population.

The linkage map of ‘MS-2’ was composed of 20 LGs with 72 SSR markers. The total map length was 503.5 cM, and the average marker distance was 7.0 cM. The linkage map of ‘Kaorino’ was composed of 20 LGs with 68 SSR markers. The total map length was 356.9 cM, and the average marker distance was 5.2 cM. A QTL was detected on only one region on the ‘Kaorino’ map. As in the BC1 F1_S population, no QTLs were detected on the‘MS-2’ map (Fig. 4). Because the flanking marker of the QTL (FAES0001) was also detected in the SK_F1 population, this QTL was named qMS4.3. A comparison of the waveforms of the fragment analysis of SK_F1 and BC1_F1_K populations confirmed that the QTLs on LG3 of the ‘Kaorino’ map were identical to qMS4.3 that was detected in SK_F1 population. qMS4.3 explained 83.8% of the total phenotypic variance, and the absence of the flanking marker-associated peak led to male sterility, similar to the findings for the SK_F1 and BC1 F1_S populations.

Thus, using three independent populations, we detected 3, 2, and 1 QTLs in the SK_F1, BC1 F1_S, and BC1 F1_K populations, respectively. This result corresponded to the number of genes that were expected to be involved in male sterility in the genetic backgrounds of ‘Fukuoka S6’ and ‘Kaorino’, as shown in Table 1.
Detection of amplicon sequence of flanking DNA markers of QTLs for male sterility
The amplicon sizes of SSR marker products fluctuated among the different experiments. Furthermore, amplicon sizes from PCR using the post-labeling method (Schuelke, 2000) were approximately 10 to 20 bp longer than when using the pre-labeling method. Therefore, the amplicon sizes shown in Figure 2, 3, and 4 differed from actual amplicon sizes. To detect actual amplicon sizes of flanking marker products of QTLs, we conducted target amplicon sequencing (Bybee et al., 2011) of ‘Fukuoka S6’ and ‘Kaorino’ using next-generation sequencing with MiSeq. Forward and reverse primer sequences for the target sequences, designed using Primer 3 plus software, are listed in Table S3. Comparing sequence reads from MiSeq with amplicon peak sizes of the fragment analysis, we detected the actual amplicon sizes of QTL-flanking marker products, FVES1264, FVES1356, and FAES0001, as 196 bp, 195 bp, and 269 bp, respectively (Table 3). This result clearly supported the expected ratio based on the segregation pattern of three kinds of population for QTL analysis, as shown in Table 1.

To validate the effects of the QTLs detected in the three different populations, we compared pollen fertility with genotypes of the QTLs’ flanking markers for male sterility using the S1_S and S1_K populations. In this validation test, plants that carried commonly recessive alleles of qMS4.1, qMS4.2, and qMS4.3 were classified as the “Sterile” type (S). Other plants that carried at least one dominant allele at either QTL were classified as the ‘Fertile’ type (F). The results of the validation test are shown in Table 4. The consistency ratios between phenotype and genotype were extremely high, at 97.8% and 93.5% in the S1_S and S1_K populations, respectively.
Adaptability of QTLs to different genetic backgrounds
Using different populations derived from the cross between ‘MS-2’ and some core collections and selected lines derived from recurrent selection as the pollen parent, we evaluated the adaptability of the detected QTLs in different genetic backgrounds. Table 5 shows the consistency ratios between phenotype and genotype in the tested populations. The consistency ratios in populations that were derived from crosses with ‘Tochihitomi’ and ‘29-02b’ as the pollen parent were extremely high (95.3% and 100%, respectively). However, populations that were derived from crosses with ‘Elsanta’ and ‘85-06a’ as the pollen parent had lower consistency ratios (24.4% and 31.7%, respectively) than those of ‘Tochihitomi’ and ‘29-02b’. The consistency ratio of the population derived from a cross with ‘ANF2’ was moderate (72.2%), while two populations derived from different F1 plants resulting from a cross with ‘Beni hoppe’ exhibited different consistency ratios (85.0% and 40.9%).
Discussion
The genome of cultivated strawberry exhibits allo-octoploidy (Darrow, 1966) so its inheritance has been a controversial topic. Senanayake and Bringhurst (1967) proposed an AA A′A′ BB BB structure for the cultivated strawberry genome. However, the current most accepted theory is the AA A′A′ BB B′B′ structure proposed by Bringhurst (1990). Kunihisa et al. (2005) confirmed disomic inheritance based on analysis using CAPS markers, and supported the AA A′A′ BB B′B′ structure. Furthermore, disomic inheritance of cultivated strawberry was also supported by Rousseau-Gueutin et al. (2008), Sargent et al. (2012), Isobe et al. (2013), and Lerceteau-Köhler et al. (2012). Based on this theory, the predicted number of cultivated strawberry linkage groups was 28 (seven basic chromosomes multiplied by four homoeologous groups), and the linkage group numbers found in this study in the SK_F1 population were 30 and 27 in Fukuoka S6 and Kaorino map, respectively, almost corresponding to the number of predicted linkage groups. Based on these findings, we can conclude that QTL analysis, as in diploid species, is applicable for cultivated strawberry. We successfully detected QTLs for the male sterility of the cultivated strawberry F. × ananassa using three kinds of genetic populations derived from a cross between ‘Fukuoka S6’ and ‘Kaorino’. Genetic regions that are responsible for male sterility were located on three distinct regions of the F. × ananassa genome, two of them were heterozygous in ‘Fukuoka S6’ and one was heterozygous in ‘Kaorino’. Furthermore, the accumulation of recessive alleles in those three regions could lead to male sterility, as shown in Table 3. This fact clearly suggested that male sterility of cultivated strawberry was not a quantitative trait, but a qualitative one that was inherited in a Mendelian manner, combining a small number of major genes. Additionally, flanking marker sequences of all three regions were derived from LG4 of the F. vesca genome (Shulaev et al., 2011).
Male sterility is a kind of reproductive isolation symptom that plays an important role not only in plant adaptation and evolution (Darwin, 1877), but also in the efficient seed production of F1 hybrid cultivars (Horner and Palmer, 1995). It has been identified in many crop species, including onion (Jones, 1937), welsh onion (Moue and Uehara, 1985; Yamashita et al., 2010), rice (Shinjyo, 1969), carrot (Kvasnikov and Zhidkova, 1970), rapeseed (Thompson, 1972), sugar beet (Owen, 1942; Owen, 1945), wheat (Kihara, 1967; Wilson and Ross, 1962), and Japanese radish (Ogura, 1968). In cultivated strawberry, Valleau (1918) first reported sterile male wild strawberry plants (materials were probably F. virginiana) and analyzed their inheritance using several kinds of F1 populations. It was finally concluded that sterile male plants (pistillates) were clearly distinguishable from hermaphrodites (no moderate types), and inheritance followed a simple Mendelian pattern (Valleau, 1923). Recent studies using genomic and DNA marker resources also revealed that the male sterility of the genus Fragaria (F. vesca, F. virginiana, F. chiloensis, and F. ananassa ssp. cuneifolia) was not a quantitative trait, but a qualitative one (Goldberg et al., 2010; Govindarajulu et al., 2013; Spigler and Ashman, 2011; Spigler et al., 2008, 2010; Tennessen et al., 2013, 2016; Wei et al., 2017).
Although our study also supported the conclusion of several studies that male sterility alleles are recessive, many other previous studies found that male sterility was inherited dominantly, not recessively. We summarized information on genetic regions for male-sterility in the genus Fragaria described in previous studies and this study in Table 6. In F. vesca, Tennessen et al. (2013) developed an F1 population (95 plants) derived from a cross between a male-sterile seed parent and a hermaphroditic parent. They confirmed that the segregation ratio of male sterility and male fertility was 1:1, and detected a QTL on the maternal map at LG4 of the F. vesca genome assembly v1.0 (Shulaev et al., 2011). Ashman et al. (2015) conducted genetic analysis using more than 60 populations derived from crosses using several kinds of F. vesca strains and mapped the region for male sterility; it was identical to the region detected by Tennessen et al. (2013) on Fvb4. In octoploid species, Spigler et al. (2008) generated an F1 population (184 plants) by crossing a female (male sterile) maternal (seed) parent with a hermaphroditic paternal (pollen) parent (both parents were F. virginiana) and performed QTL analysis for male sterility. The segregation of sterile and fertile male plants was 1:1, and a QTL for male sterility was detected on the maternal map, implying that male sterility was dominant. Their further analyses (Spigler and Ashman, 2011; Spigler et al., 2010) indicated that the genetic region for male sterility was located on a chromosome region that was syntenic with LG6 of the F. vesca genome (Sargent et al., 2009). Goldberg et al. (2010) conducted QTL analysis for male sterility using an F1 population (84 plants) derived from a cross between a male-sterile maternal (seed) parent and a male-fertile parent (both parents were F. chiloensis). The segregation ratio of male sterility and male fertility was 1:1, and a QTL for male sterility was detected on VI-A (m), which was on the maternal map. Tennessen et al. (2016) revealed that this region corresponded to Fvb6 of the F. vesca genome (Tennessen et al., 2014). Additionally, Govindarajulu et al. (2013) created a F. × ananassa. subsp. cuneifolia population derived from a cross between F. chiloensis and F. virginiana, and they revealed that male sterility was controlled by a single gene in a region that corresponded with LG6 in the F. vesca genome (Sargent et al., 2009).
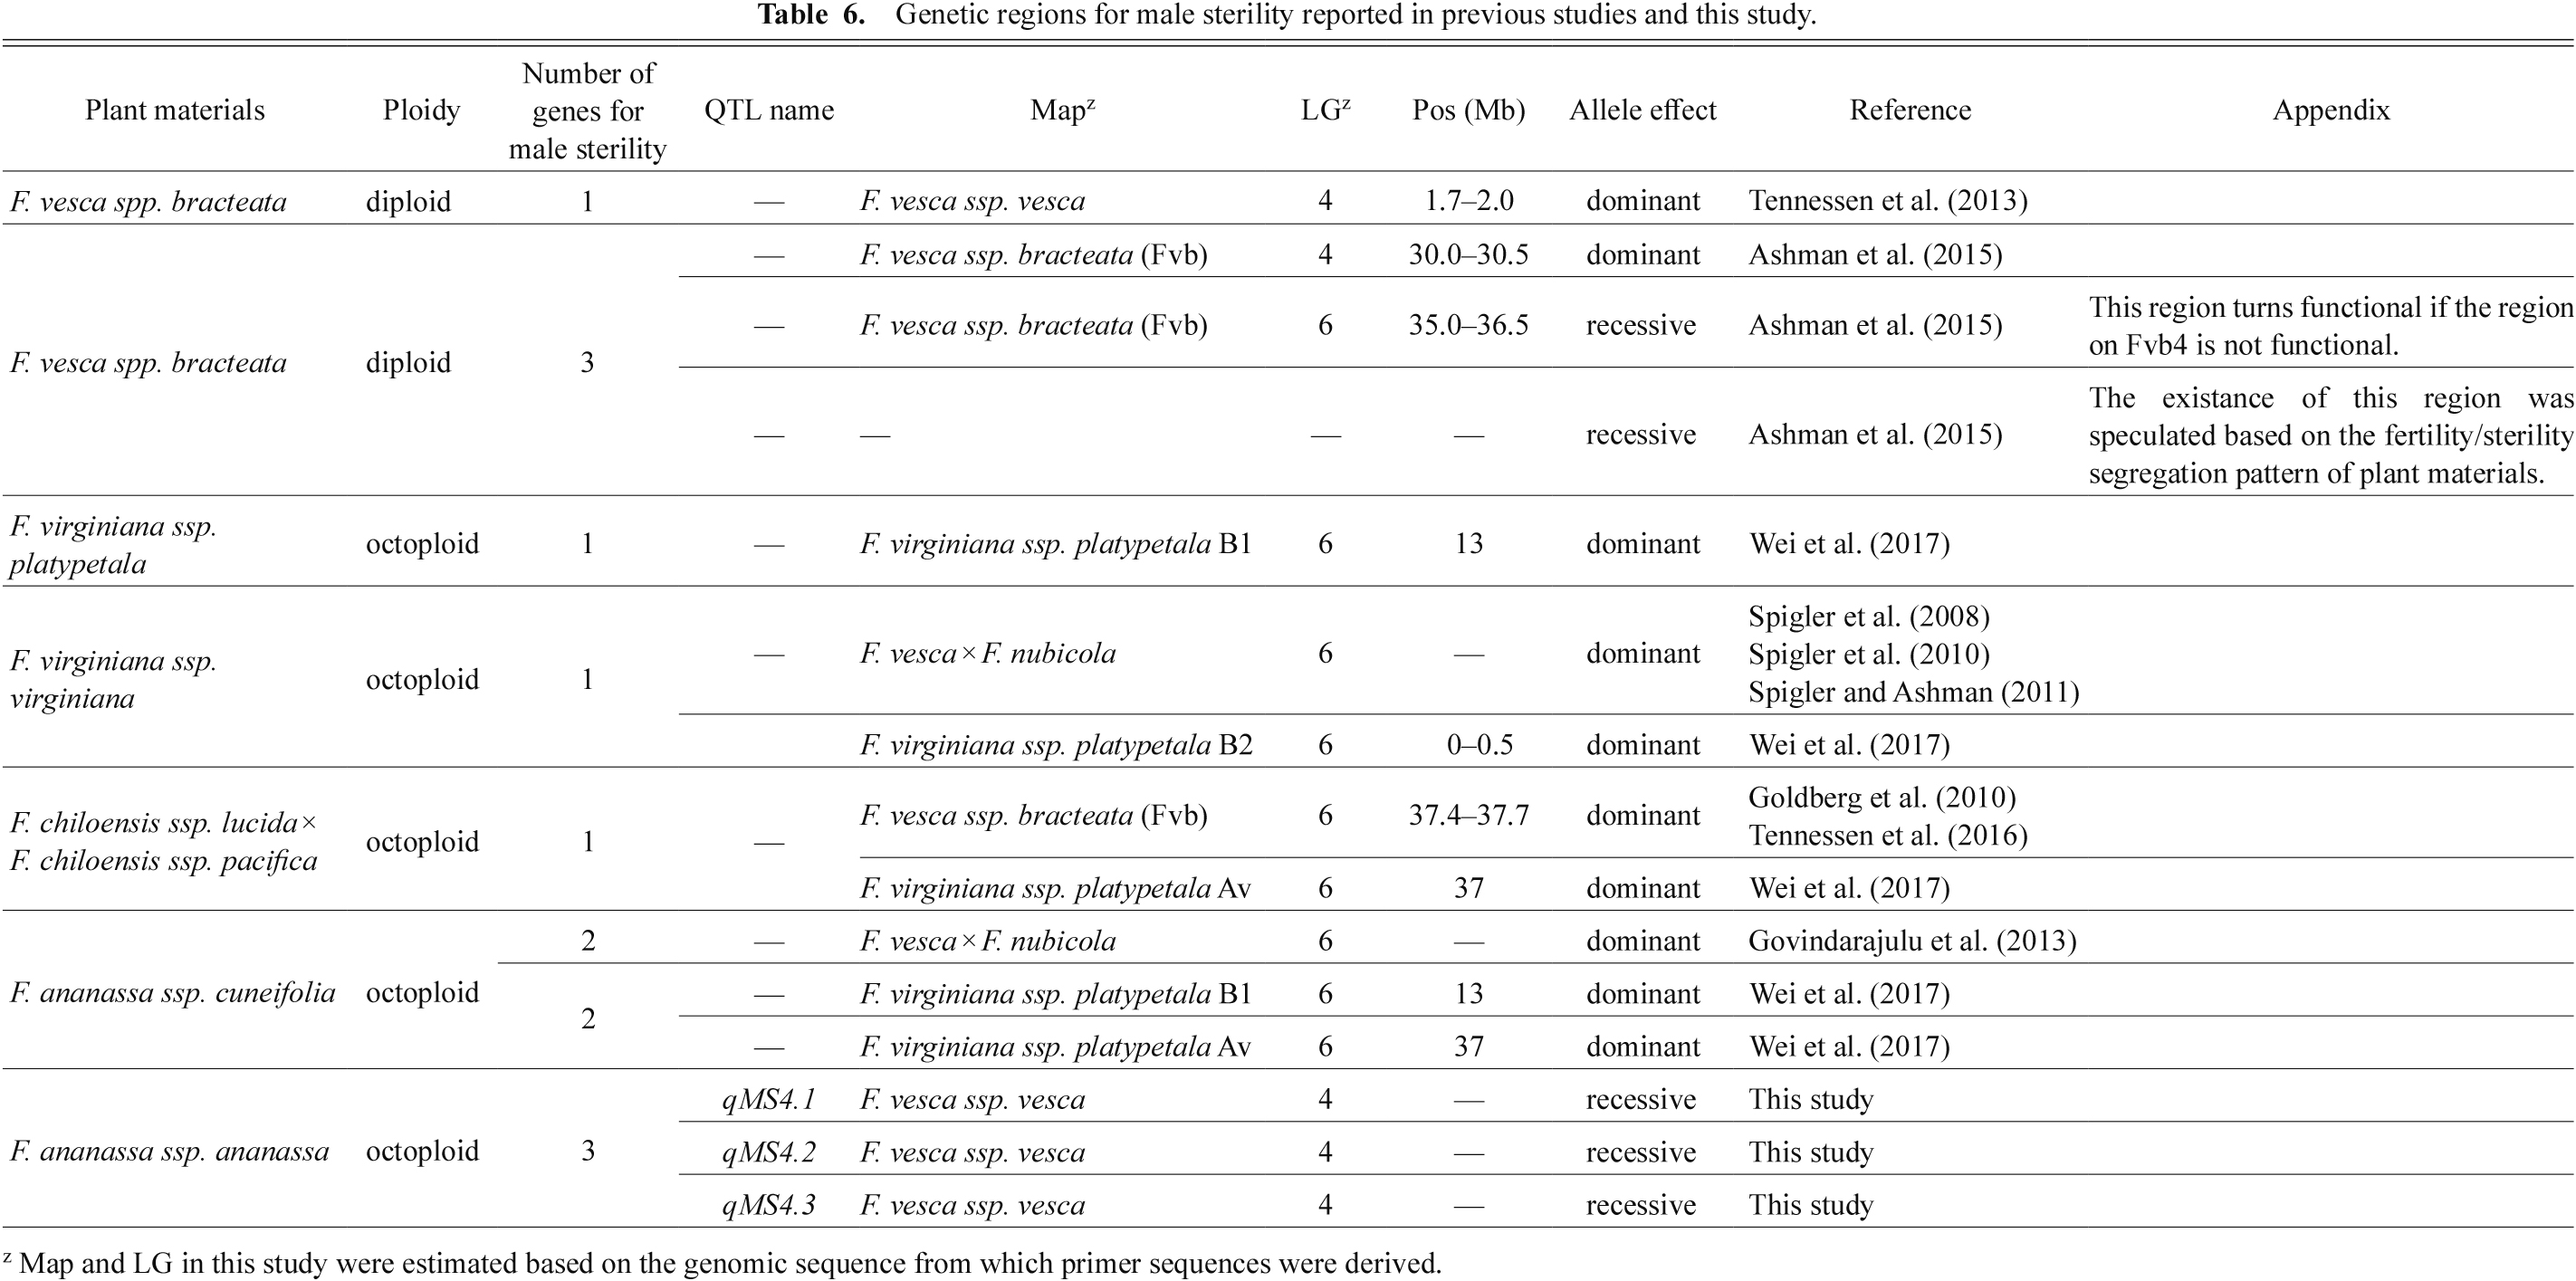
Therefore, most of these previous studies suggested that male sterility in the genus Fragaria (F. vesca, F. chiloensis, and F. virginiana) was controlled by a dominant gene(s) in a simple Mendelian manner. Although the material of Govindarajulu et al. (2013) belonged to F. × ananassa, this subspecies is a natural hybrid of F. chiloensis and F. virginiana that inhabits coastal areas of north-western USA (Staudt, 1999); therefore, it may be genetically different from the cultivated strawberry F. × ananassa subsp. ananassa used in this study. Wei et al. (2017) summarized previous studies regarding the male-sterile genetic regions of F. vesca, F. chiloensis, F. virginiana, and F. × ananassa. subsp. cuneifolia, and revealed that three sub-genomes, corresponding to those of the octoploid strawberry genome (Tennessen et al., 2014), included independent sex-determining regions (SDRs, male-sterile regions). Furthermore, Tennessen et al. (2018) uncovered genomic sequences of SDRs on Fvb6 and proved the translocation of an SDR from F. vesca to F. chiloensis and F. × ananassa. subsp. cuneifolia via F. virginiana. Although this SDR translocation event was beneficial in the domestication of the genus Fragaria, the question as to why the genetic regions for male sterility detected in this study were recessive and not dominant remains unanswered.
Ashman et al. (2015) proposed important and critical answers to the above-mentioned question. They revealed that there was another male sterility region in F. vesca, located on Fvb6, in addition to the region on Fvb4 found by Tennessen et al. (2013). The male sterility controlled by this novel region on Fvb6 is inherited recessively, not dominantly. They also pointed out that the male sterility gene on Fvb6 turned functional only when the genotype of the male sterility gene at Fvb4 was recessive because the effect of the male sterility region on Fvb4 was dominant to that of Fvb6. Based on the findings of Ashman et al. (2015), we hypothesize the following: the genotype of male sterility gene(s) corresponding to Fvb4 became recessive (non-functional) in the cultivated strawberry F. × ananassa during evolution. Additionally, in the cultivated strawberry genome, the male sterility recessive genes on Fvb6 translocated and duplicated to three distinct positions that corresponded to Fvb4 in the F. vesca genome, and became functional. Furthermore, dominant genes on Fvb6 derived from F. chiloensis and F. virginiana could have turned recessive (non-functional) throughout this evolutionary process. To prove this hypothesis, comparisons of male sterility regions among cultivated strawberry and wild strawberry are urgently required. Furthermore, comparing the study of Ashman et al. (2015) with that of Tennessen et al. (2016) suggested that the genetic region on Fvb6 of F. vesca was different from that of F. chloensis because the physical positions of both regions on Fvb6 were slightly different from each other (Table 6).
For practical breeding of cultivated strawberry, the male sterility system we found in this study has very good potential. Using three kinds of genetic populations derived from a cross between ‘Fukuoka S6’ and ‘Kaorino’, we revealed that three distinct regions are involved in male sterility, and the use of flanking SSR markers could accelerate the development of seed parents of F1 hybrids. The next question was ‘Are there other genes that are responsible for male sterility in cultivated strawberry?’ To answer this question, we crossed some cultivars that belonged to the core collection of cultivated strawberry (Wada et al., 2017) and selected lines derived from recurrent selection with a male sterility line, ‘MS-2’, and evaluated the consistency ratio between genotype and phenotype. The consistency ratio was high in progeny from crosses of ‘Tochihitomi’ (95.3%) and ‘29-02b’ (100%), but low in progeny from crosses of ‘Elsanta’ (24.4%) and ‘85-06b’ (31.7%). Because ‘85-06a’ was developed using ‘Elsanta’ as a seed parent, ‘Elsanta’ may harbor novel male sterility regions. Furthermore, crosses using ‘Beni hoppe’ indicated different consistency ratios in different F1 plants (85.0% and 40.9%). This suggested that the male sterility genes of ‘Beni hoppe’ were not only on the regions we found in this study, but also on novel regions. Of course, recombination events between male sterility genes and flanking SSR markers may have occurred while generating these populations, leading to the inconsistency between genotype and phenotype. Furthermore, since the population that indicated a consistency ratio of 40.9% harbored 65 fertile and 45 sterile plants, and this segregation did not match the 3:1 ratio, a certain lethal gene may exist in ‘Beni hoppe’. Consequently, fine mapping of the three male sterility genes we detected is necessary to address this issue.
There are two kinds of male sterility systems, genic male sterility and CMS (Budar and Pelletier, 2001). Although all the populations used in this study, SK_F1, BC1F1_S, and BC1F1_K, carried cytoplasm of ‘Fukuoka S6’, the S1 population of ‘Kaorino’ also contained sterile male plants according to the three gene theory (Table 4). These results indicated that the male sterility system in cultivated strawberry used in this study was genic male sterility, not CMS. However, Ashman et al. (2015) proposed that the differences in cytotype may involve sterility. The strawberry was introduced into Japan in the middle of the 19th century for the first time, and the genetic resources used in strawberry breeding were quite limited. This suggests that the cytotypes of strawberry cultivars bred in Japan were also limited. Therefore, crosses using foreign cultivars may uncover the contribution of these cytotypes to male sterility.
We consider that the following two approaches are necessary to apply the male sterility system found in this study to the practical breeding of seed-propagated strawberry cultivars. 1) Fine mapping of male sterility genes on the genome of cultivated strawberry. As indicated in Table 4, the consistency ratio between genotype and phenotype for male sterility was not 100%. This could result from the recombination of genes responsible for male sterility and flanking SSR markers. Fine mapping of male sterility genes could increase the accuracy of marker-assisted selection and finally lead to the efficient development of seed-parent lines for F1 hybrids. 2) Analysis of the restoration of female function. Based on our observations, most of the male sterility lines were also female sterile; however, some male sterility lines showed a high proportion of seed set, implying that they were female fertile. This fact suggests that specific genes, which are involved in the restoration of female function, could exist in the cultivated strawberry genome. Further genomic analysis is necessary to clarify this point. Recently, Edger et al. (2019) reported highly comprehensive genomic sequences of cultivated strawberry that distinguished homoeologous chromosomes evolutionarily derived from F. vesca, F. iinumae, F. nipponica, and F. virdis. Although we identified three independent QTLs for male sterility, the homoeologous chromosome that harbors each gene for male sterility remains unknown. Furthermore, it is possible that another gene for male sterility exists in the cultivated strawberry genome if four different homoeologous chromosomes carry one sterile male gene. Using information on genome structure for fine mapping of male sterility genes, finding a novel male sterility gene, and analysis of the restoration of female fertility could contribute to the efficient breeding of seed-propagated F1 hybrid cultivars and developing the strawberry seed and nursery industry. Furthermore, strawberry cultivation and fruit production systems could be dramatically improved with the application of this male sterile system in the future.
Acknowledgements
We thank Prof. Shigyo of Yamaguchi University for his critical and valuable comments for accelerating this research. We also thank S. Sasamoto, T. Wada, C. Minami, H. Tsuruoka, M. Kato, K. Nannri, and A. Kurabayashi in the Kazusa DNA Research Institute for technical assistance. Sequences of flanking SSR markers of QTLs for male sterility were amplified by FASMAC, Co., Ltd. (Atsugi, Japan).
Literature Cited
- Ashman, T. L., J. A. Tennessen, R. M. Dalton, R. Govindarajulu, M. H. Koski and A. Liston. 2015. Multilocus sex determination revealed in two populations of gynodioecious wild strawberry, Fragaria vesca subsp. bracteata. G3: Genes, Genomes, Genetics 5: 2759–2773.
- Bentvelsen, G. C. M., E. Bouw and J. E. Veldhuyzen van Zanten. 1997. Breeding strawberries (Fragaria × ananassa Duch.) from seed Int. Soc. Hort. Sci., Leuven, Belgium. 149–154.
- Bringhurst, R. S. 1990. Cytogenetics and evolution in American Fragaria. HortScience 25: 879–881.
- Budar, F. and G. Pelletier. 2001. Male sterility in plants: occurrence, determinism, significance and use. Comptes Rendus de l’Académie des Sciences-Series III-Sciences de la Vie 324: 543–550.
- Bybee, S. M., H. Bracken-Grissom, B. D. Haynes, R. A. Hermansen, R. L. Byers, M. J. Clement, J. A. Udall, E. R. Wilcox and K. A. Crandall. 2011. Targeted amplicon sequencing (TAS): a scalable next-gen approach to multilocus, multitaxa phylogenetics. Genome Biol. Evol. 3: 1312–1323.
- Chang, Z., Z. Chen, N. Wang, G. Xie, J. Lu, W. Yan, J. Zhou, X. Tang and X. W. Deng. 2016. Construction of a male sterility system for hybrid rice breeding and seed production using a nuclear male sterility gene. Proc. Natl. Acad. Sci. USA 113: 14145–14150.
- Chen, J., J. Hu, B. A. Vick and C. Jan. 2006. Molecular mapping of a nuclear male-sterility gene in sunflower (Helianthus annuus L.) using TRAP and SSR markers. Theor. Appl. Genet. 113: 122–127.
- Darrow, G. M. 1966. The strawberry. History, breeding and physiology. Holt, Rinehart, and Winston, NewYork.
- Darwin, C. 1877. The different forms of flowers on plants of the same species. John Murray, London.
- De Block, M., D. Debrouwer and T. Moens. 1997. The development of a nuclear male sterility system in wheat. Expression of the barnase gene under the control of tapetum specific promoters. Theor. Appl. Genet 95: 125–131.
- De Guzman, C. and J. Oard. 2019. Genetics and breeding system for cytoplasmic and genetic male sterility in rice Protecting Rice Grains in the Post-Genomic Era. IntechOpen, London.
- Edger, P. P., T. J. Poorten, R. VanBuren, M. A. Hardigan, M. Colle, M. R. McKain, R. D. Smith, S. J. Teresi, A. D. L. Nelson, C. M. Wai, E. I. Alger, K. A. Bird, A. E. Yocca, N. Pumplin, S. Ou, G. Ben-Zvi, A. Brodt, K. Baruch, T. Swale, L. Shiue, C. B. Acharya, G. S. Cole, J. P. Mower, K. L. Childs, N. Jiang, E. Lyons, M. Freeling, J. R. Puzey and S. J. Knapp. 2019. Origin and evolution of the octoploid strawberry genome. Nat. Genet. 51: 541–547.
- Gambardella, M. I. and S. Sánchez. 2016. Genetic resources of the strawberry. p. 10–25. In: A. M. Husaini and D. Neri (eds.). Strawberry—growth, development and diseases—. CAB International, Wallingford, Oxfordshire.
- Goldberg, M. T., R. B. Spigler and T. L. Ashman. 2010. Comparative genetic mapping points to different sex chromosomes in sibling species of wild strawberry (Fragaria). Genetics 186: 1425–1433.
- Govindarajulu, R., A. Liston and T. Ashman. 2013. Sex-determining chromosomes and sexual dimorphism: insights from genetic mapping of sex expression in a natural hybrid Fragaria × ananassa subsp. cuneifolia. Heredity 110: 430–438.
- Grattapaglia, D. and R. Sederoff. 1994. Genetic linkage maps of Eucalyptus grandis and Eucalyptus urophylla using a pseudo-testcross: mapping strategy and RAPD markers. Genetics 137: 1121–1137.
- Hirakawa, H., K. Shirasawa, S. Kosugi, K. Tashiro, S. Nakayama, M. Yamada, M. Kohara, A. Watanabe, Y. Kishida and T. Fujishiro. 2014. Dissection of the octoploid strawberry genome by deep sequencing of the genomes of Fragaria species. DNA Res. 21: 169–181.
- Horner, H. T. and R. G. Palmer. 1995. Mechanisms of genic male sterility. Crop Sci. 35: 1527–1535.
- Ishikawa, M. and F. Maeda. 2008. Strawberry ‘Chiba F-1 gou’. Cultivar registration. 20844.
- Isobe, S. N., H. Hirakawa, S. Sato, F. Maeda, M. Ishikawa, T. Mori, Y. Yamamoto, K. Shirasawa, M. Kimura and M. Fukami. 2013. Construction of an integrated high density simple sequence repeat linkage map in cultivated strawberry (Fragaria × ananassa) and its applicability. DNA Res. 20: 79–92.
- Ito, T. 2016. Sosainoshinhinsyu Vol. 19 (In Japanese). Seibundoshinkoushya. Tokyo.
- Jones, H. and S. Emsweller. 1936. Development of the flower and macrogametophyte of Allium cepa. Hilgardia 10: 415–428.
- Jones, H. A. 1937. Onion improvement. US Department of Agriculture, Washington.
- Kataoka, S. and Y. Noguchi. 2016. Vigorous strawberry lines developed from recurrent selection under forcing culture. VIII International Strawberry Symposium, Québec City. 1156 197–202.
- Kihara, H. 1967. Cytoplasmic male sterility in relation to hybrid wheat breeding. Der Züchter 37: 86–93.
- Kitamura, H., T. Mori, J. Kohori, S. Yamada and H. Shimizu. 2015. Breeding and extension of the new strawberry cultivar ‘Kaorino’ with extremely early flowering and resistance to anthracnose. Hort. Res. (Japan) 14: 89–95 (In Japanese with English abstract).
- Kosambi, D. 1944. The estimation of map distances from recombination values. Annual Eugenics 12: 172–175.
- Kunihisa, M., N. Fukino and S. Matsumoto. 2005. CAPS markers improved by cluster-specific amplification for identification of octoploid strawberry (Fragaria × ananassa Duch.) cultivars, and their disomic inheritance. Theor. Appl. Genet. 110: 1410–1418.
- Kunihisa, M., H. Ueda, N. Fukino and S. Matsumoto. 2009. DNA markers for identification of strawberry (Fragaria × ananassa Duch.) cultivars based on probability theory. J. Japan. Soc. Hort. Sci. 78: 211–217.
- Kvasnikov, V. B. and N. I. Zhidkova. 1970. The method of producing forms of carrots with cytoplasmic male sterility. p. 19–25. In: La sterilite male chez les plantes horticoles. EUCARPIA section horticole, Versailles.
- Lerceteau-Köhler, E., A. Moing, G. Guérin, C. Renaud, A. Petit, C. Rothan and B. Denoyes. 2012. Genetic dissection of fruit quality traits in the octoploid cultivated strawberry highlights the role of homoeo-QTL in their control. Theor. Appl. Genet. 124: 1059–1077.
- Liu, H., W. -F. Xie, L. Zhang, V. Valpuesta, Z. -W. Ye, Q. -H. Gao and K. Duan. 2014. Auxin Biosynthesis by the YUCCA6 flavin monooxygenase gene in woodland strawberry. J. Integr. Plant Biol. 56: 350–363.
- Mitsui, H., K. Fujita, T. Sueyoshi and H. Fushihara. 2003. New strawberry cultivar ‘Fukuoka S6’ and ‘Fukuoka S7’ for forcing culture. Bull. Fukuoka Agric. Res. Cent. 22: 61–68 (In Japanese with English abstract).
- Mori, T., J. Kohori, H. Kitamura, T. Iguchi, I. Kato, K. Sone, M. Ishikawa, F. Maeda, M. Fukami, S. Isobe and S. Sato. 2015. Development of F1-hybrid strawberry of seed propagation type named ‘Yotsuboshi’ by collaborative breeding among institutes. Hort. Res. (Japan) 14: 409–418 (In Japanese with English abstract).
- Moue, T. and T. Uehara. 1985. Inheritance of cytoplasmic male sterility in Allium fistulosum L. (Welsh onion). J. Japan. Soc. Hort. Sci. 53: 432–437 (In Japanese with English summary).
- Ogura, H. 1968. Studies on the new male-sterility in Japanese radish, with special reference to the utilization of this sterility towards the practical raising of hybrid seeds. Memoirs Fac. Agric., Kagoshima Univ. 6: 39–78.
- Owen, F. 1942. Inheritance of cross and self fertility in Beta vulgaris. Jour. Agr. Res. 64: 679–698.
- Owen, F. 1945. Cytoplasmically inherited male-sterility in sugar beets. Jour. Agr. Res. 71: 423–440.
- Rogers, J. S. and J. R. Edwardson. 1952. The utilization of cytoplasmic male-sterile inbreds in the production of corn hybrids 1. Agron. J. 44: 8–13.
- Rousseau-Gueutin, M., E. Lerceteau-Köhler, L. Barrot, D. J. Sargent, A. Monfort, D. Simpson, P. Arus, G. Guérin and B. Denoyes-Rothan. 2008. Comparative genetic mapping between octoploid and diploid Fragaria species reveals a high level of colinearity between their genomes and the essentially disomic behavior of the cultivated octoploid strawberry. Genetics 179: 2045–2060.
- Sargent, D. J., F. Fernandéz-Fernandéz, J. Ruiz-Roja, B. Sutherland, A. Passey, A. Whitehouse and D. Simpson. 2009. A genetic linkage map of the cultivated strawberry (Fragaria × ananassa) and its comparison to the diploid Fragaria reference map. Molecular Breeding 24: 293–303.
- Sargent, D. J., T. Passey, N. Šurbanovski, E. L. Girona, P. Kuchta, J. Davik, R. Harrison, A. Passey, A. Whitehouse and D. Simpson. 2012. A microsatellite linkage map for the cultivated strawberry (Fragaria × ananassa) suggests extensive regions of homozygosity in the genome that may have resulted from breeding and selection. Theor. Appl. Genet. 124: 1229–1240.
- Schuelke, M. 2000. An economic method for the fluorescent labeling of PCR fragments. Nat. Biotechnol. 18: 233.
- Senanayake, Y. and R. Bringhurst. 1967. Origin of Fragaria polyploids. I. Cytological analysis. Am. J. Bot. 54: 221–228.
- Shinjyo, C. 1969. Cytoplasmic-genetic male sterility in cultivated rice, Oryza sativa L. II. The inheritance of male sterility. Jpn. J. Genet. 44: 149–156.
- Shulaev, V., D. J. Sargent, R. N. Crowhurst, T. C. Mockler, O. Folkerts, A. L. Delcher, P. Jaiswal, K. Mockaitis, A. Liston and S. P. Mane. 2011. The genome of woodland strawberry (Fragaria vesca). Nat. Genet. 43: 109–116.
- Spigler, R. B. and T. L. Ashman. 2011. Sex ratio and subdioecy in Fragaria virginiana: the roles of plasticity and gene flow examined. New Phytologist 190: 1058–1068.
- Spigler, R. B., K. S. Lewers, A. L. Johnson and T. L. Ashman. 2010. Comparative mapping reveals autosomal origin of sex chromosome in octoploid Fragaria virginiana. J. Heredity 101: S107–S117.
- Spigler, R. B., K. S. Lewers, D. Main and T. Ashman. 2008. Genetic mapping of sex determination in a wild strawberry, Fragaria virginiana, reveals earliest form of sex chromosome. Heredity 101: 507–517.
- Staudt, G. 1999. Systematics and geographic distribution of the American strawberry species: Taxonomic studies in the genus Fragaria (Rosaceae: Potentilleae) (Vol. 81). Univ. of California Press, Berkeley.
- Takeuchi, T., H. Fujinami, T. Kawata and M. Matsumura. 1999. Pedigree and characteristics of a new strawberry cultivar ‘Beni hoppe’. Bull. Shizuoka Agr. Exp. Stn. 44: 13–24 (In Japanese with English abstract).
- Tennessen, J. A., R. Govindarajulu, T. L. Ashman and A. Liston. 2014. Evolutionary origins and dynamics of octoploid strawberry subgenomes revealed by dense targeted capture linkage maps. Genome Biol. Evol. 6: 3295–3313.
- Tennessen, J. A., R. Govindarajulu, A. Liston and T. L. Ashman. 2013. Targeted sequence capture provides insight into genome structure and genetics of male sterility in a gynodioecious diploid strawberry, Fragaria vesca ssp. bracteata (Rosaceae). G3: Genes, Genomes, Genetics 3: 1341–1351.
- Tennessen, J. A., R. Govindarajulu, A. Liston and T. L. Ashman. 2016. Homomorphic ZW chromosomes in a wild strawberry show distinctive recombination heterogeneity but a small sex‐determining region. New Phytologist 211: 1412–1423.
- Tennessen, J. A., N. Wei, S. C. Straub, R. Govindarajulu, A. Liston and T. L. Ashman. 2018. Repeated translocation of a gene cassette drives sex-chromosome turnover in strawberries. PLoS Biol. 16: e2006062.
- Thompson, K. 1972. Cytoplasmic male-sterility in oil-seed rape. Heredity 29: 253.
- Ueki, M., Y. Ohashi, T. Shigeno, M. Deguchi, H. Takagiwa, H. Tochigi, I. Fukasawa, S. Kebukawa and Y. Inaba. 2006. Breeding of a new everbearing strawberry cultivar ‘Tochihitomi’. Bull. Tochigi Agr. Exp. Stn. 58: 47–57 (In Japanese with English abstract).
- Valleau, W. D. 1918. Sterility in the strawberry. J. Agric. Res. 12: 614–619.
- Valleau, W. 1923. The inheritance of flower types and fertility in the strawberry. Am. J. Bot. 10: 259–274.
- Wada, T., Y. Noguchi, S. Isobe, M. Kunihisa, T. Sueyoshi and K. Shimomura. 2017. Development of a core collection of strawberry cultivars based on SSR and CAPS marker polymorphisms. Hort. J. 86: 365–378.
- Wei, N., R. Govindarajulu, J. A. Tennessen, A. Liston and T. L. Ashman. 2017. Genetic mapping and phylogenetic analysis reveal intraspecific variation in sex chromosomes of the virginian strawberry. J. Heredity 108: 731–739.
- Wilson, J. and W. Ross. 1962. Cross breeding in wheat, Triticum aestivum L. II. Hybrid seed set on a cytoplasmic male-sterile winter wheat composite subjected to cross-pollination 1. Crop Sci. 2: 415–417.
- Yamashita, K., H. Tsukazaki, A. Kojima, T. Ohara and T. Wako. 2010. Inheritance mode of male sterility in bunching onion (Allium fistulosum L.) accessions. Euphytica 173: 357–367.


