ORIGINAL ARTICLES
Genetic and Gene Expression Analysis of Berry Sugar Composition in a Sucrose-accumulating Grapevine
2020 Volume 89 Issue 3 Pages 216-224

Details
2020 Volume 89 Issue 3 Pages 216-224
We examined hexose- and sucrose-accumulating grapevines to elucidate genetic and transcriptional control of berry sugar composition in table grapes. Sugar composition was classified into two types: a hexose accumulator that accumulates fructose, glucose, and no or trace amounts of sucrose and a sucrose accumulator that accumulates fructose, glucose, and a large amount of sucrose. Segregation ratios among diploid seedling populations of S1 and F2 indicate that the trait of sucrose accumulation is controlled by a single major recessive gene. Transcriptional levels of sugar accumulation-related key genes were monitored during berry ripening using two hexose-accumulating cultivar/selections and one sucrose-accumulating cultivar. Gene expression of sucrose transporter and sucrose phosphate synthase coincided with a rapid increase in sugar accumulation after the onset of berry ripening; gene expressions of those enzymes and cell wall invertase were not significantly different between sucrose- and hexose-accumulators and gene expression of vacuolar acid invertase decreased after the onset of berry ripening in both sucrose- and hexose-accumulators. Gene expression of sucrose synthase (catalyzes the reaction of sucrose cleavage) in the hexose accumulators remained constant throughout berry development, whereas the expression in sucrose accumulators was significantly lower, with a concomitant sharp rise in sucrose accumulation. These results suggest that sucrose synthase may play a critical role in the sugar metabolism of sucrose-accumulating grape berries.
Grapevines (Vitis spp.) are an economically important fruit crop worldwide, and berry development undergoes a complex series of physical and biochemical changes divided into three major phases (reviewed in Kuhn et al., 2014). In the initial phase of berry growth (phase I), berry size increases by cell division and expansion. The second phase (phase II) is defined as a lag phase in which cell expansion ceases and sugars begin to accumulate. Véraison, or the onset of ripening, marks the beginning of the last phase (phase III), in which berry softening, sugar accumulation, and a decline in organic acids occurs. For several decades, sugar accumulation in wine and table grapes has been extensively characterized at the metabolite level because sugar content is an important quality determinant in wine production and fresh market use (Agasse et al., 2009; Amerine et al., 1982; Castellarin et al., 2016; Martínez-Esteso et al., 2011; Winkler et al., 1974).
Soluble sugars produced by photosynthesis are exported from the leaf as sucrose and transported to the berry flesh by phloem unloading (Conde et al., 2007; Lecourieux et al., 2014; Ribéreau-Gayon et al., 2000; Zhang et al., 2006). In general, at the onset of berry ripening, soluble sugars accumulate in the vacuole at high levels in the form of hexose sugars, such as glucose and fructose, following the enzymatic cleavage of sucrose (Coombe, 1992; Davies and Robinson, 1996; Hawker, 1969; Rüffner et al., 1995). However, there are some sucrose-accumulating grapevines among American hybrid table grape cultivar/selections that have V. labrusca in their parentage, having large amounts of sucrose in addition to hexose sugars, although they appear with extremely low frequency within Vitis germplasm repositories (Lott and Barrett, 1967; Shiraishi, 1993; Shiraishi et al., 2008, 2010; Wu et al., 2011).
Sucrose-accumulating organs are characterized by a metabolic transition during developmental stages in horticultural crops. During the last growth phase, the activity of vacuolar acid invertase declines concomitantly with sucrose accumulation in sweet melon (Hubbard et al., 1989; McCollum et al., 1988), citrus (Kato and Kubota, 1978), and tomato (Klann et al., 1993; Yelle et al., 1991). Similarly, Takayanagi and Yokotsuka (1997) speculate that low activity of vacuolar acid invertase during the latter part of development in grape berries is the principal cause of sucrose accumulation in the grapevine of ‘Steuben’ (V. labruscana × vinifera). However, recent biochemical and molecular studies on hexose-accumulating grapevines suggest that vacuolar acid invertase and sucrose synthase, acting in an independent or cooperative manner in sucrose cleavage, are responsible instead (Deluc et al., 2007; Forte et al., 2011; Martínez-Esteso et al., 2011; Tian et al., 2012; Zhang et al., 2006). In other fruit crops such as tomato (Miron and Schaffer, 1991) and citrus (Komatsu et al., 2002) sucrose synthase gene(s) may play a physiologically significant role in the determination of sucrose accumulation.
Biochemical and transcriptional considerations of sucrose accumulation could provide valuable information for the manipulation of sugar metabolism in grape berries for future breeding of table grapes. Shiraishi et al. (2012) proposed in a preliminary genetic study a monogenic control model for the trait of sucrose accumulation in table grapes: complete dominance of hexose accumulation [A] over sucrose accumulation [a]. We also established two-schemed diploid S1 and F2 seedling populations from 2009 to 2011 to further test the single-gene hypothesis. However, most seedlings were unfruited, and it remains to be confirmed whether a single gene controls sucrose accumulation in grape berries. In this study, we report 1) genetic analysis on the trait of sucrose accumulation using diploid seedling populations of S1 and F2, and 2) transcriptional analysis of sugar accumulation during diploid grape berry ripening in both sucrose- and hexose-accumulating grapevines, together with time-course changes in the associated berry quality traits.
Table 1 shows the sugar composition of the parental cultivar/selections used in the present study, in which the type of sugar accumulation and its presumed genotype are given according to previous studies (Shiraishi et al., 2010, 2012). We used two-schemed diploid S1 and F2 seedling populations for genetic analysis of sugar accumulation (Shiraishi et al., 2012). One vine per seedling was grafted onto Kober 5BB rootstock and grown from 2016 to 2017 with a vine-by-row spacing of 0.8 × 2.0 m in a north-south orientation in a greenhouse at Fukuoka Agricultural and Forestry Research Center, Fukuoka, Japan (33°50' N; 130°57' E). The soil type was sandy loam and was uniformly fertilized on an annual basis with 60 kg nitrogen (N)·ha−1. The vineyard was micro-sprinkle irrigated and ~4,200 L of water (105 L·day−1, 40 days in total) was applied over the course of the experiment. The tree age was seven to eight years old, and the vine was cane-pruned to 15–20 nodes with a horizontal grid trellis training system. From 80 to 90 days after full bloom (E-L system 37 to 38; Coombe, 1995), three representative clusters were selected from each seedling in two successive years. The berries from the three individual clusters were pooled and pressed to obtain a juice sample for the soluble solids content, titratable acidity, and sugar composition analyses.
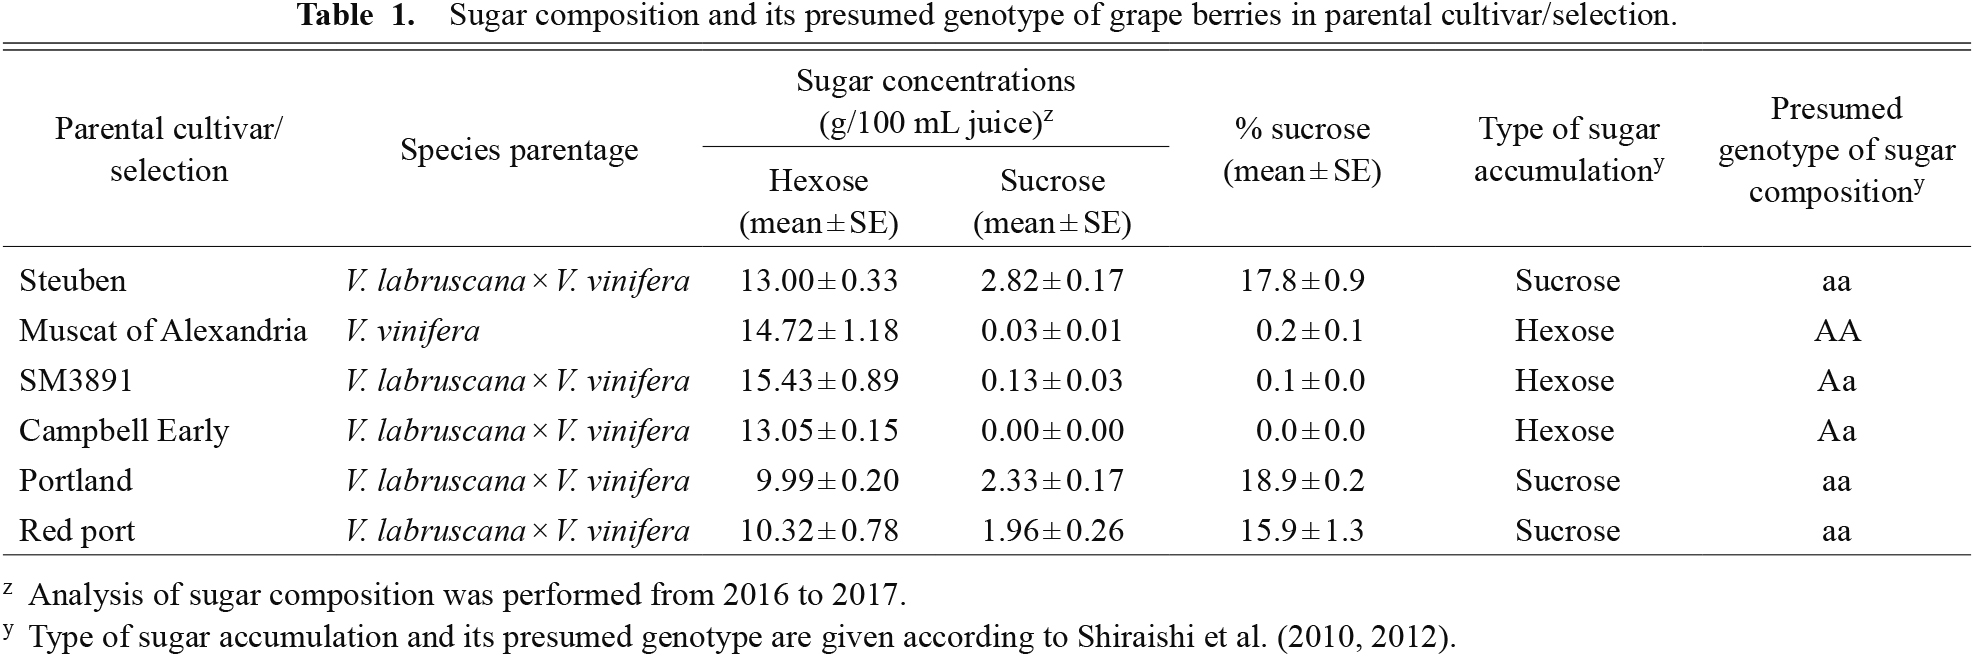
Sugar composition and its presumed genotype of grape berries in parental cultivar/selection.
Diploid cultivar/selections of ‘Steuben’, ‘Muscat of Alexandria’, and SM3891 were grown at Fukuoka Agricultural and Forestry Research Center, Chikushino, Fukuoka in Japan from 2017 to 2018, and used for gene expression analysis of sugar composition. Three seven- to eight-year-old vines per cultivar/selection, grafted on Kober 5BB rootstock, were planted according to the practices described above. The full bloom data were noted as the day on which 50% of the cluster was flowering (E-L system 23), with time measured as days after full bloom. Three replicates of 10 berries were randomly taken from 10 clusters of each vine at 30, 40, 50, 60, 70, and 80 days after full bloom. Developmental stages during berry ripening were characterized by changes in key genes involved in sugar metabolism as well as by observed changes in berry weight, soluble solids content, titratable acidity, and sugar composition.
Soluble solids content and titratable acidity analysisSoluble solids content was determined with a hand refractometer (N1; ATAGO CO., LTD., Tokyo, Japan) using 1 mL of the juice sample. Titratable acidity was measured by potentiometric titration to pH 7.8 using 0.1 N NaOH (Shiraishi et al., 2010) using a 5 mL juice sample.
Sugar composition analysisAfter determination of soluble solids content and titratable acidity, the remaining juice sample was clarified by centrifugation at 5,000 × g for 10 min for sugar composition analysis (Shiraishi et al., 2012). The resulting supernatant was diluted 10 times with deionized water and filtered through a 0.45 μm filter. The filtrate was frozen and stored at −20°C in sealed polypropylene tubes prior to HPLC analysis. Sugar composition was measured by an HPLC (LC-10A; Shimadzu Corporation., Kyoto, Japan) consisting of an SCL-10A system controller, LC-10AD pumps, a CTO-10A column oven, and a RID-10A refractive index detector. The column (SCR-101N, 7.9 × 300 mm; Shimadzu) was operated at 60°C with water delivered at a flow rate of 0.6 mL·min−1. The injection volume was 10 μL.
Gene expression analysisPeeled and deseeded berries were ground in liquid nitrogen. 1 mL of Fruit-mate for RNA Purification (Takara Bio Inc., Kyoto, Japan) containing 1% [v/v] of β-mercaptoethanol was added to approximately 400 mg of frozen powder, and vortexed for 1 min. The mixture was centrifuged at 10,000 × g for 2 min at room temperature, then 400 μL of the supernatant was transferred to a new 1.5 mL RNase-free tube. 400 μL of RLT buffer of an RNeasy Plant Mini Kit (Qiagen, Hilden, Germany) was added to the tube, and vortexed for 1 min at room temperature. Subsequent procedures for RNA extraction were conducted according to the manufacturer’s instructions for the RNeasy Plant Mini Kit. cDNA was synthesized using PrimeScript RT Master Mix (Takara Bio) as described in the manufacturer’s manuals. Quantitative RT-PCR was performed with a 7500 Real-Time PCR system (Applied Biosystems, Forster City, CA, USA) and a TB Green Premix Ex Taq II (Takara Bio) as described in the manufacturer’s manual. Primer pairs for sugar accumulation-related key genes for vacuolar acid invertase (GIN1 and GIN2; Dry, 2006), sucrose transporter (SUT1; Tian et al., 2012), cell wall invertase (CWI; Tian et al., 2012), sucrose phosphate synthase (SPS; Tian et al., 2012), and sucrose synthase (SuSy; Tian et al., 2012) are shown in Table S1. The PCR protocol was as follows: 95°C for 30 s; 40 cycles of 95°C for 5 s, 60°C for 34 s; 95°C for 15 s, 60°C for 1 min, 95°C for 15 s. Relative gene expression was calculated with the ΔΔCt method (2017) and standard curve method (2018) with three biological replicates per cultivar/selection. The amounts of each transcript were normalized against β-actin (Actin; Tian et al., 2012).
Frequency distribution of the sucrose concentration of grape berries in two-schemed diploid S1 and F2 seedling populations (Fig. 1) indicated that plants could be classified into two types: hexose accumulators in which the percentage of sucrose ranged from 0 to 2.5% with an average of 0.2% or sucrose accumulators in which the percentage of sucrose ranged from 5.4 to 29.4% with an average of 11.5%. Semi-bimodal distributions of sucrose percentages also suggested that the sucrose accumulation can be treated as a qualitative trait, i.e. major gene control. If the parental genotypes are homozygous (AA or aa), the genotype of the seedling population would be the same as that of the corresponding parent. If the parental genotype is heterozygous (Aa), the ratio of hexose:sucrose accumulators in the seedlings would be 3:1 (= AA + Aa:aa).

Frequency distribution of sucrose concentration of grape berries in two-schemed diploid S1 and F2 seedling populations used for genetic analysis of sugar accumulation. SM3891 was derived from a cross of ‘Steuben’ × ‘Muscat of Alexandria’. ‘Red port’ was derived from a cross of ‘Portland’ × ‘Campbell Early’. Sucrose- and hexose-accumulators are represented by black and white rectangles, respectively. Arrows indicate the parental cultivar/selection of each seedling population of S1 and F2.
As shown in Table 2, the populations in scheme 1 were as follows: 8 S1 seedlings of V. labruscana × V. vinifera derived from selfing of ‘Steuben’ (aa), 8 S1 seedlings of V. vinifera derived from selfing of ‘Muscat of Alexandria’ (AA), and 24 F2 seedlings of V. labruscana × V. vinifera derived from selfing of F1, SM3891 (Aa). The populations in scheme 2 were as follows: 8 S1 seedlings of V. labruscana × V. vinifera derived from selfing of ‘Portland’ (aa), 29 S1 seedlings of V. labruscana × V. vinifera derived from selfing of ‘Campbell Early’ (Aa), and 23 F2 seedlings of V. labruscana × V. vinifera derived from selfing of F1, ‘Red port (aa). Many seedlings exhibited moderate or weak growth throughout the experimental period (e.g. the dwarfed shoot growth in Fig. S1). Nevertheless, segregation ratios of S1 and F2 populations were successfully consistent with the expected monogenic ratio of 1:0 or 3:1 (Table 2), indicating that the sucrose accumulation trait was re-confirmed by a single recessive gene hypothesis (Shiraishi et al., 2012). However, differences in sucrose content were observed among the sucrose-accumulating populations (Fig. 1), suggesting that the involvement of other factors affecting the sucrose concentration of grape berries.
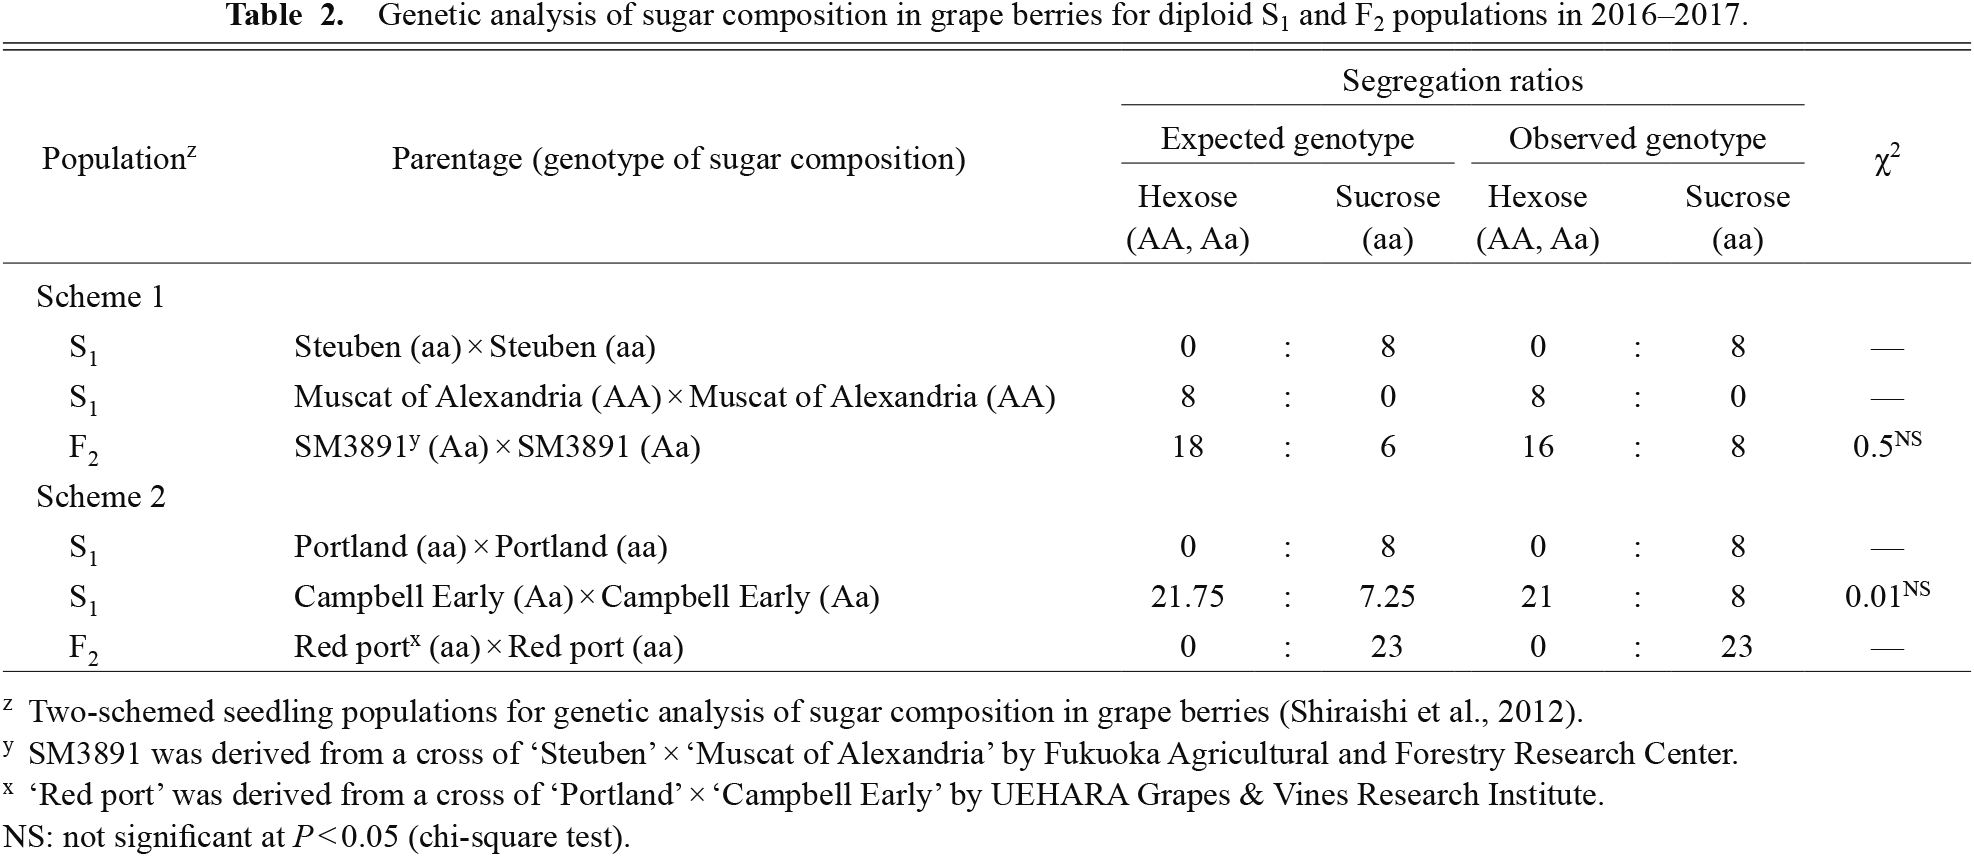
Genetic analysis of sugar composition in grape berries for diploid S1 and F2 populations in 2016–2017.
The growth pattern of grape berries can be described as a double sigmoid curve in which two periods of rapid growth (phase I: 30 to 40 days after full bloom, and phase III: 50 to 80 days after full bloom) are separated by a lag period of little growth (phase II: 40 to 50 days after full bloom). Berry weight steadily increased towards the end of the ripening period (Fig. 2a), and there was a significant difference (P < 0.05) in berry weight at 80 days after full bloom (6.3 g in ‘Muscat of Alexandria’, 5.8 g in SM3891, 2.8 g in ‘Steuben’). Soluble solids content (SSC) was ~5 °Brix at 30 to 40 days after full bloom, and progressively increased until 80 days after full bloom (Fig. 2b). There was a significant difference (P < 0.05) in the SSC at 80 days after full bloom (18.0 in ‘Steuben’, 16.5 in ‘Muscat of Alexandria’ and SM3891). In contrast, rapid decreases in titratable acidity levels were observed from 50 to 80 days after full bloom, during phase III (Fig. 2c). No significant difference (P < 0.05) was observed in the titratable acidity levels at 80 days after full bloom (0.53% in SM3891, 0.53% in ‘Muscat of Alexandria’, 0.48% in ‘Steuben’). A striking increase was observed in fructose and glucose from 50 days after full bloom, and hexose sugars appeared to be higher in hexose accumulators than in sucrose accumulators throughout berry development (Fig. 3a, b). The ‘Steuben’ cultivar accumulated a significantly large amount of sucrose from 50 days after full bloom, reaching more than 20 mg·g−1 FW, whereas its counterparts accumulated only a small amount of sucrose, approximately 2 mg·g−1 FW (Fig. 3c).

Changes in berry weight (a), soluble solids content (b), and titratable acidity (c) of berries at days after full bloom in three grape cultivar/selections from 2017 to 2018: ‘Steuben’, SM3891, and ‘Muscat of Alexandria’, represented by black, gray, and white squares, respectively. Data are presented as means ± SE (n = 3). Different letters associated with each cultivar indicate significant differences on the sampling date (Tukey’s test, P < 0.05).

Changes in fructose (a), glucose (b), and sucrose (c) contents of berries at days after full bloom in three grape cultivar/selections from 2017 to 2018: ‘Steuben’, SM3891, and ‘Muscat of Alexandria’, represented by black, gray, and white squares, respectively. Data are presented as means ± SE (n = 3). Different letters associated with each cultivar indicate significant differences on the sampling date (Tukey’s test, P < 0.05).
Transcription of SUT1, CWI, SPS, GIN1, GIN2, and SuSy was examined to determine the expression level of sugar accumulation-related key genes during grape ripening. On the whole, similar transcriptional patterns were observed using the ΔΔCt method of 2017 (Fig. S2) and standard curve method of 2018 (Fig. 4). The transcription level of the SUT1 gene (Fig. 4a) and SPS gene (Fig. 4c) increased continuously until the end of ripening. The expression of the CWI gene increased from 30 to 60 days after full bloom, and it gradually decreased until 90 days after full bloom (Fig. 4b). There were no significant differences among the cultivar/selections used here for the SUT1, CWI, and SPS genes, except for SPS at 60 days after full bloom. The expression patterns of GIN1 and GIN2 among the cultivar/selections were different during berry ripening. Levels of GIN1 expression of hexose-accumulating cultivar/selections decreased 50 days after full bloom, while those of ‘Steuben’ (sucrose accumulator) slightly increased (Fig. 4d). It is likely that levels of GIN2 expression steadily decreased 30 days after full bloom (Fig. 4e). At 60 to 80 days after full bloom, no marked differences in the levels of transcription of the two genes were observed among the cultivar/selections. The transcriptional level of the SuSy gene in SM3891 and ‘Muscat of Alexandria’ steadily increased until 50 days after full bloom, but remained constant thereafter (Fig. 4f). Conversely, transcription of the SuSy gene in ‘Steuben’ significantly declined after 50 days after full bloom, and the corresponding levels were much lower than those of SM3891 or ‘Muscat of Alexandria’ (Fig. 4f). These results suggest that, in addition to the vacuolar acid invertase, sucrose synthase has an important role in sucrose cleavage in berry flesh.

Relative gene expression of SUT1 (a), CWI (b), SPS (c), GIN1 (d), GIN2 (e), and SuSy (f) in berry flesh at days after full bloom in three grape cultivar/selections in 2018: ‘Steuben’, SM3891, and ‘Muscat of Alexandria’, represented by black, gray, and white squares, respectively. Data are presented as means ± SE (n = 3) and were assessed by quantitative real-time PCR analysis (standard curve method: β-actin was used as a reference gene). Different letters associated with each cultivar indicate significant differences on the sampling date (Tukey’s test, P < 0.05).
Hexose sugars such as glucose and fructose are the principal sugars during grape berry development and are present in approximately equal amounts with little or no sucrose detectable in ripe berries (Amerine et al., 1982; Coombe, 1992; Iland and Coombe, 1988; Kliewer, 1966, 1967; Ribéreau-Gayon et al., 2000; Winkler et al., 1974). However, several American hybrid cultivar/selections such as ‘Buffalo’, ‘Portland’, and ‘Steuben’ are sucrose accumulators, i.e., they contain large amounts of sucrose ranging from 15 to 33% of total sugars (Lott and Barrett, 1967; Shiraishi, 2000; Shiraishi et al., 2010; Wu et al., 2011). The hexose- and sucrose-accumulating traits of grapes appear to be related to regional and genetic differences, since no sucrose accumulators have been found among V. vinifera cultivars (Reisch and Pratt, 1996; Shiraishi et al., 2010). American hybrid cultivars that include V. labrusca in their parentage may differ from other species in the gene(s) regulating sugar metabolism.
Shiraishi et al. (2012) proposed a monogenic control model for the trait of the hexose-/sucrose-accumulating genotype. Further inheritance studies presented here verify that sucrose accumulation is determined by a single major recessive gene, as demonstrated in other horticultural crops such as carrots (Simon, 1993) and tomato (Chetelat et al., 1993, 1995; Harada et al., 1995; Stommel and Haynes, 1993; Yelle et al., 1991). Similar to cultivated grapes, the fruit of domesticated tomato (Lycopersicon esculentum) predominantly accumulates hexose sugars (glucose and fructose), while wild tomato (L. chmielewskii) accumulates significant quantities of sucrose in addition to hexoses. Mendelian and molecular genetic studies revealed that the sucrose accumulation trait in tomato fruit is determined by a single major recessive gene, sucr. However, the involvement not of polygenes, but rather additional modifier genes could account for differences in the percent sucrose (30 to 85%) in sucrose-accumulating tomato seedlings (Chetelat et al., 1993). It is likely that similar modifier factors are involved in the modulation of the sucrose concentration of grape berries in association with the single major recessive gene. Most S1 and F2 seedlings displayed difficulties in terms of growing and bearing fruits for use in genetic analysis. This is partly a result of inbreeding depression due to the selfing of diploid grapevines, as indicated by Gray et al. (2005). To date, however, we have effectively selected promising sucrose accumulators in ongoing table grape breeding projects on the basis of the above-described genetic model. For instance, several large-sized tetraploid selections with a range of 19.7 to 24.3% sucrose were obtained from the cross combination of FR-4 (aaaa) and FR-3 (aaaa) (Table S2).
In grapevines, carbohydrates generated by photosynthesis are exported from the leaves as sucrose and transported in the phloem to the berry (Conde et al., 2007; Ribéreau-Gayon et al., 2000; Zhang et al., 2006). Regarding symplasmic phloem unloading sucrose in grape berries, sucrose transporters such as SUT1 and SUC12 act to maintain sucrose in the conducting bundles until it reaches the site of unloading (Lecourieux et al., 2014). Davies et al. (1999) showed that the transcripts of SUT1 increase concomitantly with post-véraison sugar accumulation (phase III), leading to accelerated sucrose phloem unloading, which is in agreement with our results. The presence of cell wall invertase favors apoplasmic sucrose unloading because of the formation of a steep sucrose gradient (Frommer and Sonnewald, 1995; Patrick, 1997). Zhang et al. (2006) postulated that sucrose cleavage is largely catalyzed by cell wall invertase, thus promoting the accumulation of hexose sugars (glucose and fructose) in the apoplasmic space of grapes. In the present study, however, the expression of the cell wall invertase gene CWI showed no significantly different patterns between sucrose- and hexose-accumulating grapevines throughout berry development. Rüffner et al. (1990) showed that CWI enzyme activity in berries represents only 4% of total invertase activity. Furthermore, Agasse et al. (2009) suggest that CWI alone cannot be responsible for the increase in hexose sugar concentration in ripening berries. Taken together, these results suggest that less sucrose degradation may have occurred in the cytoplasm and/or vacuoles of berries of the sucrose accumulator ‘Steuben’.
Later in berry development, a rapid increase in transcription levels of the SPS gene responsible for sucrose phosphate synthase (SPS), localized in both the cytoplasm and the vacuoles, coincided with total sugar accumulation in both types of accumulators included in this study. Enzymatic sucrose synthesis as a result of SPS activity has been reported in mature, sucrose-accumulating sugar beet (Fieuw and Willenbrink, 1990), sweet melon (Lingle and Dunlap, 1987), and wild tomato (Miron and Schaffer, 1991). Hubbard et al. (1989) proposed a scheme whereby sucrose accumulation in sweet melon is determined by the relationship between SPS activity and sucrose breakdown (vacuolar acid invertase and sucrose synthase) activities. Komatsu et al. (2002) indicated that SPS and sucrose synthase during ripening have important roles in sink strength when sucrose is accumulated in citrus fruit. In grape, Grimplet et al. (2007) suggested the participation of the SPS gene in the re-synthesis of sucrose following its unloading from the phloem into the berry.
In the current study, in terms of sucrose cleavage in vacuoles, gene expression of vacuolar acid invertases (GIN1 and GIN2) and a sucrose synthase (SuSy) was compared between sucrose-accumulating and non-accumulating genotypes. Transcription of GIN1 and GIN2 decreased after the onset of berry ripening in hexose accumulators, which is consistent with earlier reports (Davies and Robinson, 1996; Deluc et al., 2007; Zhang et al., 2006). Gene expression levels of SuSy in the hexose accumulators remained constant throughout berry development, agreeing with previous results (Deluc et al., 2007; Zhang et al., 2006). The activity of SuSy in grape is considered to promote sucrose breakdown in a way similar to that seen in other plants (Yamaki, 2010). However, it is noteworthy that the levels of SuSy in the sucrose-accumulating cultivar ‘Steuben’ were significantly low from the onset of berry ripening (phase III), and this was linked to a sharp increase in sucrose accumulation. This indicates that sucrose synthase gene(s) may play a critical role in sucrose accumulation in grapes, contributing to reduced enzymatic activity leading to sucrose cleavage. As postulated by transcriptomic studies (Deluc et al., 2007; Martínez-Esteso et al., 2011; Zhang et al., 2006), together with cell wall invertase, sucrose synthase may cooperate with vacuolar acid invertase in sucrose cleavage in grape berries during ripening.
Further genetic experiments have demonstrated that the trait of sucrose accumulation in grape berries is controlled by a single major recessive gene. Subsequent transcriptional studies on sugar metabolism revealed that the low expression of sucrose synthase (SuSy) may be the cause of the high accumulation of sucrose in the berries of the ‘Steuben’ cultivar. Therefore, the trait of sucrose accumulation in grapes may result from an allele of the SuSy gene. However, in general, sucrose-metabolizing enzymes in grape berries exist in the form of isozymes, and polymorphism may be possible for the relevant allele. According to Zhu et al. (2017), there are five SuSy genes in the grape genome (V. vinifera) as shown by genome-wide analysis. Together with their upstream regulators, further research should be carried out to elucidate the functional roles of SuSy genes in sucrose- and hexose-accumulating grapevines.