Abstract
To develop equations to predict the titratable acidity of grape berries at harvest from air temperature, we analyzed several years of datasets on wine grapes grown in experimental vineyards in seven prefectures and of table grapes grown in 37 prefectures in Japan. Although the number of days from the full-flowering date to harvest date varied with the cultivar, the temperature throughout the period of 40 to 50 days before the harvest date was the most strongly correlated with the titratable acidity of all tested cultivars. The titratable acidity at the harvest date of the wine grape cultivars decreased as the mean temperature of the period increased as did that of the table grape cultivars, although the latter did not decrease much above 24°C. The titratable acidity of the wine grape cultivars showed good linear regression with the mean temperature from 60 to 99 DAF (days after full-flowering) in ‘Chardonnay’, from 65 to 109 DAF in ‘Monde Briller’, and from 35 to 84 DAF in ‘Colline Verte’. That of table grape cultivars grown in cold regions showed good quadratic regression with the mean temperature from 50 to 92 DAF in ‘Kyoho’, from 46 to 91 DAF in ‘Pione’, and from 52 to 93 DAF in ‘Suzuka’. The titratable acidity of table grape cultivars grown in warm regions was estimated to be about 0.5 g/100 mL. These regression equations can be used to select cultivars to plant and to identify suitable regions for each cultivar, as well as to estimate changes in acid concentration under global warming. We also determined the relationship between the rate of acid reduction of the wine grape cultivars and temperature from serial measurements of titratable acidity to allow growers to predict the change in titratable acidity.
Introduction
It has long been known that the acid concentration in grape berries is generally higher in colder regions (Winkler, 1932). Because the concentration also depends on the cultivar, so predicting the concentration could contribute to the selection of appropriate cultivars to plant and to identify regions suitable for each cultivar.
The acid concentration in apple fruits has already decreased under global warming (Sugiura et al., 2013), and that in grape berries will also likely decrease (Bock et al., 2011). As a result, some regions where grape berries are currently too sour may become suitable in the future.
The acid concentration of grapes has been reported to be negatively correlated with the temperature of the period after veraison to harvest (Poudel et al., 2009), coloration (Yamane and Shibayama, 2006; Yamane et al., 2006), and maturation (Barnuud et al., 2014), all of which are roughly the same. If the relationship between the temperature in this period and the acid concentration at the harvest date could be quantified, it could be used to estimate current and future acid concentrations from observed and projected air temperatures.
The purpose of this study was to develop equations to predict acid concentration from air temperature by analyzing measured values of titratable acidity of wine and table grape berries in many grape-production regions across Japan.
Materials and Methods
Titratable acidity at harvest date
We analyzed data on the full-flowering date (the date when > 80% of all florets were open in > 80% of all flower clusters; NIFTS, 2007), harvest date (the date when 50% of the clusters had been harvested), and titratable acidity at the harvest date of grapes grown in the National Trial of Grapes for regional adaptability in Japan (Table 1). The white wine cultivars ‘Chardonnay’, ‘Monde Briller’, and ‘Colline Verte’ (Vitis vinifera L.) were grown in eight experimental vineyards at agricultural research institutes in seven prefectures from 2008 to 2016. The table grape cultivars ‘Kyoho’, ‘Pione’, and ‘Suzuka’ (Vitis labrusca L. × V. vinifera L.) were grown in 40 such vineyards in 37 prefectures from 1990 to 2016. The cluster harvest time was mainly judged by perceived flavor (Yamada, 2011).

In one vineyard in Ishikawa prefecture, vines of wine grape cultivars were grown under partial cover (part of the roof was covered with a clear plastic film), but all others were grown in open fields. The table grape cultivars were grown in heated or unheated plastic greenhouses (roofed entirely with clear plastic film) with side film, in plastic greenhouses without side film, under partial cover, or in open fields. A solution of gibberellic acid (GA3, 25 ppm) was applied to all clusters of table grapes once or twice to induce seedless berries.
Ten harvested clusters were sampled randomly from each cultivar in each vineyard on the harvest date, and 20 (wine grape) or five (table grape) berries from each cluster were randomly selected to measure the titratable acidity (NIFTS, 2007), which was expressed as grams of tartaric acid per 100 mL of juice. The method for this evaluation was not specified in the National Trial of Grapes.
Change of titratable acidity of wine grape berries with time
To measure changes in titratable acidity with time after veraison, we sampled berries from ‘Chardonnay’ and ‘Colline Verte’ grown in open fields in Iwate, Ishikawa, Yamanashi, and Hiroshima prefectures (Table 1) in 2014, 2015, and 2016. Ten clusters were sampled weekly during the period when titratable acidity decreased from about 1.2 to 0.7 g/100 mL in ‘Chardonnay’ or from 1.1 to 0.6 g/100 mL in ‘Colline Verte’. Twenty berries from each cluster were randomly selected to measure the titratable acidity, which was expressed as grams of tartaric acid per 100 mL of juice. The titratable acidity was determined by potentiometric titration to pH 7.8 using 0.1 N NaOH.
Climate data
For air temperature at each vineyard, we used the daily mean in the AMeDAS mesh dataset (Seino, 1993), a climate dataset with 1-km resolution (each cell measures 45" longitude × 30" latitude), estimated from data collected at meteorological observation stations of the Japan Meteorological Agency across Japan.
All covers were usually removed before veraison to avoid trapping the summer heat (Kumashiro, 2000; Nakajima, 2016). Although in rare cases the roof film may not have been removed, the AMeDAS mesh dataset was used as temperature data for all cultivation conditions in the analysis of the relationship between acid concentration and temperature.
Results
Titratable acidity of wine grapes at the harvest date
Table 2 summarizes the number of days from full-flowering date to the harvest date and titratable acidity at the harvest date of each tested cultivar across vineyards, cultivation conditions, and years. The titratable acidity of all tested wine grape cultivars was > 0.7 g/100 mL.
The titratable acidity at the harvest date had a relatively strong negative correlation with the 10-day mean temperature from 60 days after full-flowering (DAF) in ‘Chardonnay’, 65 DAF in ‘Monde Briller’, and 35 DAF in ‘Colline Verte’ (Fig. 1A). As the mean harvest date of ‘Chardonnay’ was about 100 DAF (Table 2), we assumed that the temperature-sensitive period for its acid concentration was 60 to 99 DAF (40 days). Similarly, the temperature-sensitive periods were assumed to be 65 to 109 DAF (45 days) for ‘Monde Briller’ and 35 to 84 DAF (50 days) for ‘Colline Verte’.
As air temperature increased, the titratable acidities at the harvest date decreased in all three cultivars (Fig. 2). However, although the linear regressions were significant (P < 0.001), the coefficients of determination (R2) were ≤ 0.4 (Table 3) because of large variations (Fig. 2).
We therefore calculated regression parameters from titratable acidities and temperatures averaged over several years at each vineyard (Fig. 2; Table 3). The linear regressions were significant (P < 0.05). R2 values were > 0.6, and greater than those of individual data (Table 3). These equations can be used to predict the representative titratable acidity of berries at the harvest date in vineyards. The prediction error (root-mean-square error: RMSE) of the equation was about 0.05 g/100 mL (Table 3).
Titratable acidity of table grapes at the harvest date
The titratable acidity at the harvest date of all tested table grape cultivars was about 0.5 g/100 mL (Table 2). This had a relatively strong negative correlation with the 10-day mean air temperature from about 50 DAF (Fig. 1B).
In our previous report (Sugiura et al., 2018), we investigated the skin color of table grapes in 18 prefectures and found that air temperature had the strongest negative correlation with skin color at harvest from 50 to 92 DAF in ‘Kyoho’, from 46 to 91 DAF in ‘Pione’, and from 52 to 93 DAF in ‘Suzuka’. This period was similar to the temperature-sensitive period for titratable acidity (Fig. 1B). In the subsequent analysis of the titratable acidity of table grapes, we assumed that they were equivalent so that both would be easy to predict simultaneously.
A higher mean temperature during the temperature-sensitive period led to a lower titratable acidity of the three tested table grape cultivars, but unlike in the wine grape cultivars, the titratable acidity did not decrease much above about 24°C, and became constant at about 0.5 g/100 mL (Fig. 3). The quadratic regressions were significant (P < 0.001), but R2 values were < 0.4 (Table 3).

The full-flowering date was considerably earlier in heated and unheated greenhouses with side film than under any other condition (Sugiura et al., 2019). An earlier full-flowering date means an earlier onset of the temperature-sensitive period, so mean air temperatures during that period depend on both vineyard location and cultivation conditions. Because vines of table grape cultivars were grown under different cultivation conditions in some vineyards, we calculated regression parameters from titratable acidities and temperatures averaged over several years at each vineyard for heated greenhouse culture, unheated greenhouse with side film culture, and other conditions. The quadratic regressions (Fig. 3) were significant (P < 0.001), and R2 values were ≥ 0.6, and greater than those of individual data (Table 3).
These quadratic regressions became minimum at 26.2°C for ‘Kyoho’, 26.3°C for ‘Pione’, and 28.5°C for ‘Suzuka’. We used these to predict the representative titratable acidity at the harvest date in vineyards in cold regions. In vineyards where the air temperature was at or above the threshold, we used the minimum titratable acidity (about 0.5 g/100 mL, Table 3) as an estimated value. For example, the representative titratable acidity of ‘Kyoho’ is predicted by the quadratic equation at < 26.2°C and is predicted to be 0.50 g/100 mL at ≥ 26.2°C. The prediction error (RMSE) of this equation was 0.047–0.078 g/100 mL (Table 3).
Full-flowering date of wine grapes
The full-flowering dates of the three wine grape cultivars grown in open fields had a negative correlation with the mean temperature in April and May (Table 4). The linear regressions were significant (P < 0.001), and R2 values were high. The linear regressions were formulated as equations to predict the full-flowering dates in open fields from the field temperatures (Equations for the full-flowering dates under partial cover were not developed because data were collected from only one vineyard).
Changes in titratable acidity of wine grapes with time
We combined the serial measurement data of titratable acidity of wine grapes over three years at each vineyard for analysis. There was a significant negative correlation between the number of days after full flowering and the titratable acidity during the measurement period, when titratable acidity decreased from 1.2 to 0.7 g/100 mL in ‘Chardonnay’ and from 1.1 to 0.6 g/100 mL in ‘Colline Verte’ (Fig. 4A, B). The slope of the regression varied with the vineyard. The rate of acid reduction, defined as the absolute value of the regression slope, decreased as the three-year average temperature during the measurement period increased (Fig. 4C).
Discussion
Acid concentration in grape berries increases initially, is highest at the beginning of Stage III (mature stage), and decreases markedly after veraison (Buttrose et al., 1971; Matsui et al., 1979; Yamakawa, 1983). Acid concentration at the harvest date is known to be negatively correlated with temperature from veraison (Poudel et al., 2009), the onset of coloration (Yamane and Shibayama, 2006; Yamane et al., 2006), and the onset of maturation (Barnuud et al., 2014) to harvest. Although the number of days from the full-flowering date to the harvest date varied by cultivar (Table 2), the temperature throughout the period of 40 to 50 days before the harvest date was the most strongly correlated with the titratable acidity of all tested cultivars (Fig. 1). Our findings are generally consistent with those results.
In the wine grape cultivars, the relationship between the titratable acidity at the harvest date and the mean temperature during the temperature-sensitive period was linear (Fig. 2). In the table grape cultivars, however, the titratable acidity stopped decreasing above about 24°C (Fig. 3), possibly because it was lower than in the wine grapes (Table 2). The titratable acidity of the wine grape cultivars may also have stopped decreasing at higher temperatures.
The R2 values of air temperature versus titratable acidity of all cultivars were low in the individual data for all vineyards and years (Table 3). The acid concentration of grape berries is influenced not only by temperature, but also by rainfall (Barnuud et al., 2014) and solar radiation (Shinomiya et al., 2015). The result suggests that it is difficult to predict annual acid concentrations in each vineyard accurately from only the air temperature owing to year-to-year variations in precipitation and solar radiation.
In contrast, the R2 values were higher when data were averaged over several years (Table 3). This suggests that the representative titratable acidity of new cultivars could be estimated before planting by using the equation in Table 3 and the air temperature averaged over the last few years at the vineyard. The RMSEs of these equations, except that for ‘Suzuka’, were about 0.05 g/100 mL (Table 3), and were less than half the standard deviation of all data (Table 2).
The full-flowering date of the wine grape cultivars tested here had a strong correlation with the mean temperature in April and May (Table 4), in common with several table grape cultivars tested in Japan (Kamimori et al., 2019; Sugiura et al., 2019). To predict representative titratable acidity from the equation in Table 3 and recorded temperatures, it is necessary to estimate the full-flowering date in order to calculate the mean temperature during the temperature-sensitive period. The full-flowering date of wine grape cultivars can be predicted with the regression equation in Table 4. When the representative titratable acidities of the wine grape cultivars grown in open fields at each vineyard were estimated from the temperature data for the experimental years and the equations in Tables 3 and 4, the predicted titratable acidities had RMSEs of 0.035 (‘Chardonnay’), 0.056 (‘Monde Briller’), and 0.059 g/100 mL (‘Colline Verte’).
Table grape berries grown in cold regions are occasionally too sour. Palatable table grapes have a titratable acidity of ≤ 0.6 g/100 mL (Kurahashi, 2016). At a representative titratable acidity of 0.6 g/100 mL, the mean temperature during the temperature-sensitive period was estimated from the equation in Table 3 to be 21.9°C for ‘Kyoho’, 21.1°C for ‘Pione’, and 24.1°C for ‘Suzuka’.
We previously presented equations to estimate the full-flowering date of ‘Kyoho’ and ‘Pione’ in the open field, under partial cover, and in unheated plastic greenhouses with and without side film (Sugiura et al., 2019). Because the acid concentration of table grapes in warm regions is not of concern, we used these equations, the equation in Table 3, and the temperature data for the experimental year to estimate the representative titratable acidity only in vineyards where mean air temperatures during the temperature-sensitive period were below 25°C. The RMSEs of the estimates were 0.063 g/100 mL for ‘Kyoho’ and 0.060 g/100 mL for ‘Pione’.
Wine grapes are often harvested before ripening in warm regions because juice with a titratable acidity of < 0.7 g/100 mL is not suitable for making white wine (Yamakawa, 1983). In this case, grape producers usually sample berries several times to check their acid concentration. From these data, producers can predict changes in the titratable acidity by applying forecast temperatures to the acid reduction rate (Fig. 4C).
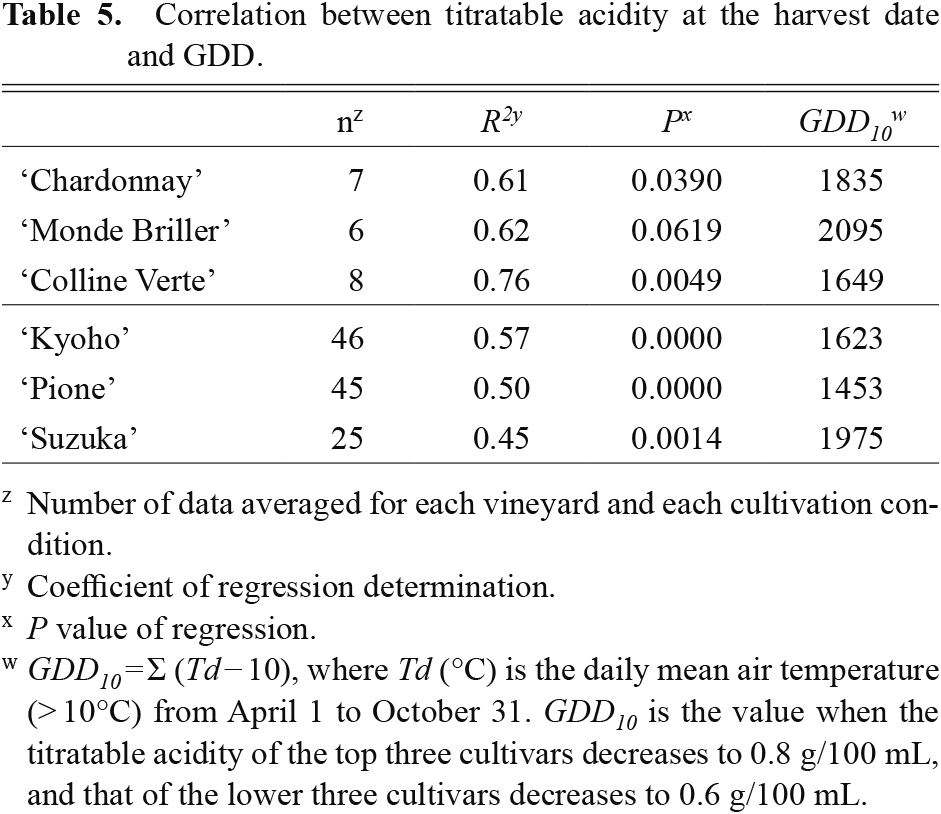
Growing degree days (GDD) is a common measure of heat accumulation and is often used to determine regions suitable for different cultivars, following the work of Winkler (1962). GDD is the sum of daily mean temperature above a base temperature (10°C is typically used for grapevines) from April through October.
To compare GDD with the equations for predicting representative titratable acidity developed here (Table 3), we analyzed the relation between GDD and titratable acidity at the harvest date averaged for each vineyard and each cultivation condition. The linear (wine grape) or quadratic (table grape) regressions were significant, except in ‘Monde Briller’ (Table 5), but R2 values were slightly lower than those of the regressions of averaged data in Table 3. From these regression equations, we calculated GDD at which the representative titratable acidity decreased to 0.8 g/100 mL in wine grapes or 0.6 g/100 mL in table grapes; acid concentrations of ‘Colline Verte’ and ‘Pione’ were shown to decrease even with fewer GDD (Table 5).
In this study, we developed an equation (Table 3) to predict the representative titratable acidity of wine and table grape cultivars from air temperature in Japan. This equation can be used to select cultivars to plant and to identify regions suitable for each cultivar, as well as to estimate changes in acid concentration under global warming. The relation between air temperature and the rate of acid reduction (Fig. 4C) could be useful to predict the change in titratable acidity from repeated samples. The sugar concentration and sugar/acid ratio are important to gain a better understanding of grape quality. Further research efforts are needed to predict the Brix values of juice in wine and table grapes.
Acknowledgements
The authors gratefully acknowledge the contributors to the National Trial of Grapes for providing data from each vineyard.
Literature Cited
- Barnuud, N. N., A. Zerihun, M. Gibberd and B. Bates. 2014. Berry composition and climate: Responses and empirical model. Int. J. Biometeorol. 58: 1207–1223.
- Bock, A., T. Sparks, N. Estrella and A. Menzel. 2011. Changes in the phenology and composition of wine from Franconia, Germany. Climate Res. 50: 69–81.
- Buttrose, M. S., C. R. Hale and W. M. Kliewer. 1971. Effect of temperature on the composition of ‘Cabernet-Sauvignon’ berries. Am. J. Enol Vitic. 22: 71–75.
- Kamimori, M., Y. Miwa, T. Isobe and A. Hosomi. 2019. Relationships between changes in air temperature and development of ‘Delaware’ grape for the past 48 years in Habikino, Osaka, Japan. Hort. Res. (Japan) 18: 133–138 (In Japanese with English abstract).
- Kumashiro, K. 2000. Protected cultivation (grape). p. 253–259. In: Basic Seminar on Agriculture. Fruit cultivation basic (Nogakukiso-seminar Kajusaibainokiso). Rural Culture Association Japan, Tokyo (In Japanese).
- Kurahashi, T. 2016. Determination of harvest date. p. 155–157. In: The latest agricultural technology. Fruit Trees (Saishinnogyogijutsu Kaju). vol. 9. Rural Culture Association Japan, Tokyo (In Japanese).
- Matsui, H., E. Yuda and S. Nakagawa. 1979. Physiological studies on the ripening of Delaware grapes. J. Japan. Soc. Hort. Sci. 48: 9–18 (In Japanese with English abstract).
- Nakajima, Y. 2016. Cover removal and temperature in simple covered cultivation. p. 151–154. In: The latest agricultural technology. Fruit Trees (Saishinnogyogijutsu Kaju). vol. 9. Rural Culture Association Japan, Tokyo (In Japanese).
- NIFTS (NARO Institute of Fruit Tree Science). 2007. Evaluation methods in national trial of selections and standard varieties (In Japanese). NARO, Tsukuba.
- Poudel, P. R., R. Mochioka, K. Beppu and I. Kataoka. 2009. Influence of temperature on berry composition of interspecific hybrid wine grape ‘Kadainou R-1’ (Vitis ficifolia var. ganebu × V. vinifera ‘Muscat of Alexandria’). J. Japan. Soc. Hort. Sci. 78: 169–174.
- Seino, H. 1993. An estimation of distribution of meteorological elements using GIS and AMeDAS data. J. Agric. Meteorol. 48: 379–383 (In Japanese).
- Shinomiya, R., H. Fujishima, K. Muramoto and M. Shiraishi. 2015. Impact of temperature and sunlight on the skin coloration of the ‘Kyoho’ table grape. Sci. Hortic. 193: 77–83.
- Sugiura, T., H. Ogawa, N. Fukuda and T. Moriguchi. 2013. Changes in the taste and textural attributes of apples in response to climate change. Sci. Rep. 3: 2418.
- Sugiura, T., M. Shiraishi, S. Konno and A. Sato. 2018. Prediction of skin coloration of grape berries from air temperature. Hort. J. 87: 18–25.
- Sugiura, T., M. Shiraishi, S. Konno and A. Sato. 2019. Assessment of deterioration in skin color of table grape berries due to climate change and effects of two adaptation measures. J. Agric. Meteorol. 75: 67–75.
- Winkler, A. J. 1932. Maturity tests for table grapes. Univ. California Agric. Exp. Stn. Bull. 529: 1–35.
- Winkler, A. J. 1962. General viticulture. University of California Press, Los Angeles.
- Yamada, M. 2011. Cross breeding in woody fruit crops (Kaju-no-Kouzatsuikusyuhou). Yokendo, Tokyo (In Japanese).
- Yamakawa, Y. 1983. Characteristics of white wine grape cultivars, ‘Semillon’, ‘Sylvaner’ and ‘Suntory Blanc’. J. Japan. Soc. Hort. Sci. 52: 145–152 (In Japanese with English abstract).
- Yamane, T., S. T. Jeong, N. Goto-Yamamoto, Y. Koshita and S. Kobayashi. 2006. Effects of temperature on anthocyanin biosynthesis in grape berry skins. Am. J. Enol. Vitic. 57: 54–59.
- Yamane, T. and K. Shibayama. 2006. Effects of changes in the sensitivity to temperature on skin coloration in ‘Aki Queen’ grape berries. J. Japan. Soc. Hort. Sci. 75: 458–462.


